Anatomy & Physiology: Current Research
Open Access
ISSN: 2161-0940
ISSN: 2161-0940
Research Article - (2017) Volume 7, Issue 6
Aim: To develop the novel regression equations that predict spirometric parameters (SPs) in concert with aging-specific corrections for four explanatory variables, including age, height, body weight, and fat fraction of body mass. Subjects: A large cohort of nonsmoking, non-obese, healthy adults in the general population in Japan (males: 3,056, females: 6,783). Methods: Supposing that SP is described by an aging-dependent, logarithmic, additive function of age, height, body weight, and fat fraction of body mass, gender- and aging-specific regression equations predicting the forced vital capacity (FVC), forced expiratory volume after one second (FEV1), FEV1/FVC, peak expiratory flow rate (PEF), forced expiratory flow rate at 50% expiration of the FVC (FEF50), and forced expiratory flow rate at 75% expiration of the FVC (FEF75) were established. The partial regression coefficients of explanatory variables against a specific SP were decided by a step-wise, multiple-regression analysis with least-squares minimization. Results: Age and fact fraction of body mass exerted negative impacts, whereas height and body weight had positive impacts on various SPs in an aging-dependent and/or aging-independent manner. These aging-related contributions of explanatory variables were highly gender-specific. Body weight and fat fraction of body mass concurrently played an important role in prescribing the SP, particularly in females. Conclusions: The gender-specific, aging-related corrections of age, height, body weight, and fat fraction body mass are important for deciding various spirometric parameters. If the aging-dependent and/or aging-independent contributions of body weight and/or fat fraction of body mass are ignored, substantial errors emerge for the reference means and lower limits of normal of specific SPs
Keywords: Spiro metric parameters, Age, Height, Body weight, Fat fraction of body mass
A: age; AC: abdominal circumference; Adjusted-R2: coefficient of determination adjusted for degrees of freedom; ai (i=1 to 4): aging-dependent and/or aging-independent partial regression coefficient; a0: invariable constant; ATS: American Thoracic Society; BFM: body fat mass; bi (i=1 to 4): invariable constant; BMI: body mass index; BSA: body; surface area; BW: body weight; ci (i=1 to 4): invariable constant; CV: coefficient of variation; ERS: European Respiratory Society; Exp: exponential function; F: fat fraction of body mass defined as %FAT/100; %FAT: fat percentage of body mass; FEF50: forced expiratory flow rate at 50% expiration of FVC; FEF75: forced expiratory flow rate at 75% expiration of FVC; FEV1: forced expiratory volume after one second; FVC: forced vital capacity; FEV1/FVC: forced expiratory volume after one second divided by forced vital capacity; GLI: Global Lungs Initiative; H: standing height; LLN: lower limit of normal; Ln: logarithmic function; PEF: peak expiratory flow rate; SD: standard deviation; SP: spirometric parameter; TLC: total lung capacity; VC: slow vital capacity; Z score: (%predicted- 100)/CV
The Global Lungs Initiative (GLI), a European Respiratory Society (ERS) Task Force, developed global multiethnic regression equations with the two explanatory variables of age and height that are applicable across a wide age range from 3 to 95 years [1-3]. The GLI addressed the problem related to a changing growth rate by assuming an agingspecific correction term in the form of the age-spline in a logarithmic linear regression equation. The implicit assumption involved in this view was that the growth-elicited effect on the lung function could be condensed in the independent term of the age-spline. The GLI aimed to develop the most parsimonious model for the prediction of lung function that specifically covered the complicated transition period between adolescence and young adulthood; thus, they used only height as an anthropometric variable in their regression equations. However, many studies conducted over several decades have shed light on the effects of various anthropometric variables other than height on SPs in adult subjects, such as body weight and/or body fat mass-associated parameters [4-17]. These studies have identified an important role of the anthropometric variables other than height in deciding SPs. Furthermore, several authors [9,10,12,16,18,19] have incorporated an aging-specific contribution of age into a regression equation that predicts SPs, the methods of which are qualitatively different from that introduced by the GLI. We recently demonstrated an important role of the aging-specific contributions of explanatory variables, including age, height, body weight, and body fat mass, in the decision of various SPs in the adult population in a semi-quantitative manner [20]. In contrast to the assumption of the GLI, the findings obtained in our earlier study indicated that the regression coefficients that describe the contributions of respective explanatory variables to a certain SP were not constant; rather, they appreciably changed with age. Thus, instead of the condensed term of the aging-specific correction used by the GLI, it may be more plausible to introduce an aging-dependent coefficient that describes the effect of each explanatory variable in the regression equation when modeling the SP. Based on these facts, we aimed to establish novel regression equations that describe the reference means and lower limits of normal (LLN) for six spirometric parameters, including the forced vital capacity (FVC), forced expiratory volume after one second (FEV1), FEV1/FVC, peak expiratory flow rate (PEF), forced expiratory flow rate at 50% expiration of the FVC (FEF50), and forced expiratory flow rate at 75% expiration of the FVC (FEF75), for a non-obese adult population incorporating the gender-specific difference in the aging-dependent contributions of four explanatory variables of age, height, body weight, and fat fraction of body mass. We excluded obese adults in the current analysis. This is because many groups of investigators [4,5,21-27] have demonstrated that the obesity distorts various SPs to a certain degree. The lung function parameters, including the total lung capacity (TLC), FVC, and FEV1, of an obese subject were shown to be substantially impaired [4,5,21-26]. Furthermore, Rubinstein [27] found that the expiratory flow rate represented by the FEF75 was appreciably lower in obese men compared with men with normal weight even after normalization regarding the difference in the vital capacity (VC). These findings clearly indicate that if spirometric data obtained from obese individuals are included, they will result in a prejudice against the regression equation that models the SP.
Study population
This is a retrospective, cross-sectional study performed on a large cohort of nonsmoking, non-obese, healthy, Japanese adults (≥ 20 years old) with spirometric examinations. They were selected among individuals in the general population who underwent a medical checkup at the Japanese Red Cross Kumamoto Health Care Center during one year from April 2009 to March 2010. The medical checkup included a questionnaire, a test of physical strength and fitness, spirometry, a chest X-ray, an electrocardiogram (ECG), various blood tests, and a medical examination by a physician. Thus, 29,030 subjects over 20 years old (men: 17,583, women: 11,447) were assessed for eligibility (Figure 1).
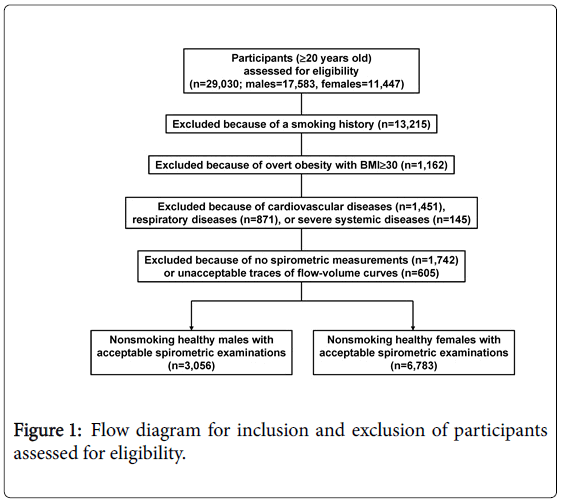
Figure 1: Flow diagram for inclusion and exclusion of participants assessed for eligibility.
Nonsmokers were defined as individuals who declared on the questionnaire that they had never smoked prior to the health screening examination. We did not confirm the nonsmoking status based on cotinine measures. The number of subjects who were excluded because of the current or past smoking history amounted to 13,215 individuals, which correspond to 45.5% of the total subjects considered for eligibility.
Based on the criterion proposed by the World Health Organization (WHO) [28], we also excluded obese adults, whose body mass index (BMI) exceeded 30 kg/m2 (n=1,162).
Of the nonsmokers with no overt obesity, no subject reported an occupational history of exposure to biomass fuels or dusts.
The medical histories and the results of various blood examinations, chest X-rays, and ECGs of these candidates were carefully examined by the staff physicians. The candidates who were confirmed to have an absence of cardiovascular diseases and respiratory diseases such as lung cancer, bronchial asthma, COPD, interstitial lung disease, or infiltrative lung disease were defined as healthy nonsmokers. Thus, 1,451 subjects with cardiovascular diseases and 871 subjects with respiratory diseases were excluded. The staff physicians excluded the subjects who took special medicines for asthma, COPD, and cardiovascular diseases, with the exception of hypertension and hyperlipidemia. In addition, they excluded the subjects who had serious systemic diseases such as malignancy in any organ, renal failure that needed dialysis, and diabetes mellitus with insulin therapy (n=145). However, the nonsmokers with hypertension or hyperlipidemia were accepted as healthy nonsmokers (regarding the lung function) unless their diseases were serious.
The number of subjects who did not consent to undergo the spirometric examination comprised 1,742 individuals, who were excluded from the assessment for eligibility.
The acceptability of the spirometric data was checked by consulting with the standardization guideline for lung function testing proposed by the American Thoracic Society (ATS)/ERS Task Force [29]. Using these processes, the healthy nonsmokers with incomplete and/or unacceptable traces of forced expiratory flow-volume curves were excluded (n=605). Thus, 9,839 (males: 3,056, females: 6,783) healthy, nonsmoking adults over 20 years of age without overt obesity were ultimately enrolled in the present analysis. All participants were provided with a written informed consent form to inform them that their data would be used for a variety of clinical researches. The participants were asked whether they agreed to the registration of their details in the database for various research programs. Our research protocol was approved by the Human Ethics Committee of the Japanese Red Cross Kumamoto Health Care Center (reference number: 2012-0137).
Spirometry and anthropometric measurements
Forced expiratory pulmonary function tests were performed using an electric spirometer (DISCOM-21 FX, CHEST Co., Tokyo, Japan). Maneuvers were performed according to the standardization of lung function testing recommended by the ATS/ERS Task Force [29].
Various anthropometric variables, including the standing height (H, cm), body weight (BW, kg), abdominal circumference (AC, cm), BMI (kg/m2), and fat percentage of body mass (%FAT, %), were examined for all participants. The %FAT was measured using a bioelectrical impedance method (BF-220, TANITA Co., Tokyo, Japan). The body fat mass (BFM, kg) was calculated by multiplying the BW by the fat fraction of body mass, F (F=%FAT/100).
Selection of explanatory variables
Age and height have been confirmed to act as the major explanatory variables deciding a variety of the SPs [1-3,20].
Body weight (body mass) is important because it is the sum of the various constituents that form the body, including the respiratory muscles that influence various pulmonary function parameters [4-7,30,31]. In humans, 10-20% of the muscle mass has been demonstrated to be lost by 50-60 years, and this loss increases to 25-30% by the age of 60-70 years [32]. Furthermore, the overall muscle function in the body has been demonstrated to decrease by 2% annually [33,34] in association with the reduction in both the inspiratory and expiratory muscle strengths as age advances [35]. We ascertained that the body weight decreased at a rate of −0.3 kg/year (which corresponded to a 13% loss during 30 years of age) in Japanese adult males and −0.1 kg/year (which corresponded to a 5% loss during 30 years of age) in Japanese adult females [20]. These findings suggest that irrespective of the gender, the behavior of the aging-dependent decrease in body weight would roughly be in accordance with the aging-dependent loss of muscle mass. However, it should be noted that the body fat mass (BFM), a factor that exerts a negative impact on SPs [4,20,30,31], also stands for a constituent of the body weight, which indicates that body weight is a double-edged sword in deciding SPs. Regarding the aging-associated change in the BFM, we recently demonstrated that the BFM in male adults decreased with age at a rate of −0.1 kg/year [20], which only explained one-third of the agingdependent loss of body weight in men. Furthermore, the BFM in female adults increased with age at a rate of +0.04 kg/year [20], which could not explain the aging-dependent loss of body weight in women. Thus, we concluded that the change in body weight with age would primarily follow the aging-dependent loss of the body muscle mass that contained the respiratory muscles aiding respiration. Therefore, we assumed that the simultaneous introduction of the body weight and the fat fraction of body mass, which comprises the essential component of the BFM, as the explanatory variables would enable us to distinguish the positive effect of body weight from the negative effect of BFM in an initial approximation. In place of the BFM, we introduced the fat fraction of body mass (F) as an explanatory variable with a substantial impact on various SPs [6,11,14]. This approach was implemented because the BFM is defined as the body weight multiplied by the F, which indicates that the effect of the BFM can be separated into that of the body weight and that of the F in a logarithmic, additive model employed to describe the SP in the present analysis (see subsequent description). We recently demonstrated that F decreased at a rate of −0.09%/year in men, whereas it increased at a rate of +0.05%/year in women [20], which suggests that F changes with age in a qualitatively different manner depending on the gender.
Some investigators have used the BMI and body surface area (BSA) as explanatory variables for SP predictions [5-9,16]. As argued in our previous paper [20], however, the effects of these two variables on SPs are associated with the effects of height and body weight. The waist-hip index, abdominal circumference, or thoracic circumference have been used as the explanatory variable to predict SPs by investigators [17]; however, we verified that most of the effects elicited by these variables on deciding SPs were explained by the integrated effects of age, height, body weight, and body fat mass [20].
Multiple regression equations
The first assumption on regression equations was that each SP could be described by the multiplicative, exponential function with four explanatory variables, including age (A), height (H), body weight (BW), and fat fraction of body mass (F):
SP = k0·(A)a1·(H)a2·(BW)a3·(F)a4 ·············· eq. (1)
The multiplicative exponential function with age and height has been widely used in case of constructing the regression equations for describing the SPs [1-3]. Weibel and colleagues [36,37] have demonstrated that in mammals with different body sizes, including human species, allometric parameters, such as the tracheal diameter, tracheal length, alveolar surface area, and lung volume, were described by an exponential function of the body mass (BW). Their findings suggest that it would make sense to model the SP as a function of the exponent term of the BW from a biological standpoint. The body fat mass (BFM), which is characterized by the fat fraction of body mass (F), acts as a factor that modifies the BW. The BFM is one constituent that forms the BW; thus, it may also be reasonable to express the effect of F on a SP by an exponential function.
The second assumption was that the effect of each explanatory variable on a specific SP would be aging-dependent. In the previous study [20], we demonstrated the evidence for supporting this assumption in a semi-quantitative manner. Since there is no definitive theory that enables us to determine the best function for expressing the aging-dependent contribution of the explanatory variable to the decision of the SP, we attempted to empirically determine the function pertinent to describing the aging-dependent contribution of the explanatory variable to the SP. The detailed description on this respect was provided in the Supplemental Information-1 (S-Figures 1-3), which resulted in that the aging-dependent contribution of the explanatory variable to the SP, if any, would be approximated by the linear function of age. Thus, the regression model for a specific SP assumes the following logarithmic (Ln), additive function:
Ln(SP) = a0 + a1.Ln(A) + a2.Ln(H) + a3.Ln(BW) + a4.Ln(F) .................... eq. (2)
In eq. (2), ai (i=1 to 4) is the aging-dependent and/or agingindependent partial regression coefficient of an explanatory variable, whereas a0 (=Ln(k0)) is the invariable constant. The aging-associated change in ai (i=1 to 4) is approximated by the following linear function:
ai = bi + ci.A .......... eq. (3)
where bi (i=1 to 4) and ci (i=1 to 4) comprise invariable constants. Eq. (3) implies that if ci is zero but bi is not zero, there is only the aging-independent component in the ai. If bi is zero but ci is not zero, ai only has the aging-dependent component. If bi and ci are not zero, ai has both the aging-dependent and aging-independent components. Thus, eq. (2) can be rearranged in the following manner:
Ln(SP) = a0 + (b1 + c1.A).Ln(A) + (b2 + c2.A).Ln(H) + (b3 + c3.A).Ln(BW) + (b4+ c4.A).Ln(F)......eq(4)
We decided the coefficients of a0, bi (i=1 to 4), and ci (i=1 to 4) in men and women by applying a step-wise, multiple-regression analysis with least-squares minimization. The overall agreement between the predicted reference means and the measured values was judged by the coefficient of determination adjusted for the degrees of freedom (adjusted-R2). We assumed that the agreement between the measured and predicted values was satisfactory when the adjusted-R2 was greater than 0.5 [38].
We determined the LLN for each Ln(SP) according to the 5th percentile of the distribution of residuals. The disparity between the log-transformed value of the predicted reference mean and the 5th percentile of the residuals distribution was defined as ΔLLN. Therefore, the log-transformed value of LLN is provided as follows:
Ln(LLN) = Ln(reference mean) ‐ ⊿LLN⋅⋅⋅⋅⋅ eq. (5)
Using the ΔLLN, the coefficient of variation (CV) for each SP, which represents the between-subject variability of the SP, is defined by the following equation:
CV = 100·[Exp(⊿LLN) ‐ 1] ····· eq. (6)
All calculations were performed using IBM SPSS Statistics (Version 22.0, SPSS Inc., an IBM Co., NY, USA). The values were expressed as the means ± standard deviations (SDs). A p-value lower than 0.05 was considered statistically significant.
The basic characteristics of the participants are provided in Table 1. The single correlation between measured FEV1 and each explanatory variable of age (A), standing height (H), body weight (BW), or fat fraction of body mass (F) in females was depicted in Figure 2. Similarly, the distribution of measured FVC in females and that in males against each explanatory variable were denoted in the Supplemental Information-2 (S-Figures 4 and 5). These figures confirmed the validity of the fundamental assumption; i.e., in addition to A and H, BW and F exert a significant impact on deciding SPs irrespective of the gender. All partial regression coefficients of a1, a2, a3, and a4 for nonsmoking healthy males and females were highly statistically significant (p<0.0001 for all). Using the partial regression coefficients (ai, i=0 to 4) and ΔLLN denoted in Table 2, the reference mean and LLN of a specific SP are calculated as;
| Male (n=3,056) | Female (n=6,783) | |
|---|---|---|
| Age (years) | 50.9 ± 11.6 [22, 86] | 51.4 ± 10.9 [22, 89] |
| Height (cm) | 168.9 ± 6.3 [145.0, 194.7] | 156.3 ± 5.7* [135.0, 178.5] |
| Body weight (kg) | 67.1 ± 8.9 [38.1, 104.0] | 53.3 ± 7.4* [31.0, 85.4] |
| BMI (kg/m2) | 23.5 ± 2.6 [15.7, 30.0] | 21.8 ± 2.8* [14.6, 30.0] |
| Fat fraction | 0.22 ± 0.05 [0.06, 0.40] | 0.27 ± 0.06* [0.12, 0.57] |
| Body fat mass (kg) | 14.8 ± 4.6 [3.2, 35.1] | 14.8 ± 4.9 [4.1, 36.1] |
| Abdominal circumference (cm) | 84.2 ± 7.3 [59.0, 108.0] | 79.8 ± 8.3* [55.0, 110.5] |
| FVC (L) | 4.1 ± 0.6 [2.6, 6.3] | 3.0 ± 0.4* [1.6, 4.6] |
| FEV1 (L) | 3.3 ± 0.5 [2.0, 5.1] | 2.4 ± 0.4* [1.3, 3.8] |
| FEV1/FVC (%) | 80.9 ± 4.0 [71.0, 93.0] | 81.9 ± 4.5* [70.0, 98.0] |
| PEF (L/s) | 8.7 ± 1.3 [5.0, 12.6] | 5.7 ± 1.1* [3.2, 9.0] |
| FEF50 (L/s) | 4.1 ± 0.9 [2.1, 7.7] | 3.2 ± 0.8* [1.4, 6.0] |
| FEF75 (L/s) | 1.2 ± 0.4 [0.4, 3.0] | 1.0 ± 0.4* [0.3, 2.9] |
Values represent means ± SDs. Bracket: range of a value [minimum, maximum]. BMI: body mass index. Fat fraction: fat percentage of body mass/100. Body fat mass: calculated from the body weight multiplied by the fat fraction. *: significantly different from the values for males (p<0.0001).
Table 1: Demographic, anthropometric and spirometric characteristics of male and female participants.
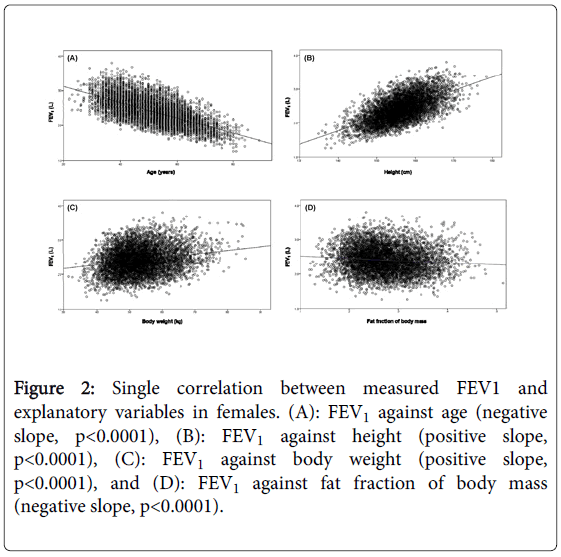
Figure 2: Single correlation between measured FEV1 and explanatory variables in females. (A): FEV1 against age (negative slope, p<0.0001), (B): FEV1 against height (positive slope, p<0.0001), (C): FEV1 against body weight (positive slope, p<0.0001), and (D): FEV1 against fat fraction of body mass (negative slope, p<0.0001).
Reference mean = Exp[a0+a1·Ln(A)+a2·Ln(H)+a3·Ln(BW)+a4·Ln(F)].....eq. (7)
LLN = (reference mean)·Exp[-⊿LLN] ····· eq. (8)
To judge the abnormality of a specific SP, it is recommended to use a Z score which converts a raw measurement to a standardized score in units of standard deviations [39]. The Z score combines the %predicted (measured value/reference mean) and the CV into a single number, which is given by;
Z = (%predicted ‐ 100)/CV····· eq. (9)
When data are normally distributed, z scores correspond directly to percentiles such that the z score of 1.64 is equivalent to the 5th percentile.
The coefficients of determination adjusted for the degrees of freedom (adjusted-R2) were greater than 0.5 for most SPs, with the exclusion of the FEV1/FVC in males and PEF in both genders (Table 2). However, the adjusted-R2 values for the FEV1/FVC in males, PEF in males, and PEF in females were 0.46, 0.48, and 0.45, respectively, all of which were not greatly different from 0.5, which indicates that the agreement between the measured values and the predicted reference means is passably satisfactory for all the SPs concerned.
| Spirometric parameter | a0 | a1 | a2 | a3 | a4 | DLLN | Adjusted-R2 |
|---|---|---|---|---|---|---|---|
| Ln(FVC)M | −10.269 | 0.358 | 1.989 | 0.164−0.003A | −0.001A | 0.146 | 0.78 |
| F | −5.659 | −0.009A | 0.909+0.013A | 0.497−0.007A | −0.067 | 0.178 | 0.684 |
| Ln(FEV1)M | −7.823 | 0.116−0.002A | 1.74 | 0 | −0.001A | 0.136 | 0.828 |
| F | −5.784 | −0.003A | 1.291 | 0.082+0.002A | −0.002A | 0.17 | 0.75 |
| Ln(FEV1/FVC)M | 6.041 | −0.11 | −0.238 | 0 | 0 | 0.075 | 0.462 |
| F | 6.313 | −0.178 | −0.289 | 0.001A | −0.171+0.003A | 0.079 | 0.514 |
| Ln(PEF)M | −1.185 | −0.011A | 0.573+0.010A | 0 | 0 | 0.246 | 0.481 |
| F | 0.078 | −0.012A | 0.011A | 0.293 | −0.002A | 0.284 | 0.453 |
| Ln(FEF50)M | −1.194 | −0.002A | 0.462 | 0.14 | 0 | 0.314 | 0.525 |
| F | 1.238 | −0.004A | −0.005A | 0.009A | −0.15 | 0.37 | 0.513 |
| Ln(FEF75)M | −6.334 | −0.003A | 1.498 | −0.171 | −0.282+0.004A | 0.4 | 0.736 |
| F | −0.057 | −0.88 | 0.381 | 0.167+0.002A | −0.869+0.012A | 0.576 | 0.714 |
A: age (years), H: height (cm), BW: body weight (kg), F: fat fraction of the body mass (decimal). a0: invariable constant, a1: partial regression coefficient for Ln(A), a2: partial regression coefficient for Ln(H), a3: partial regression coefficient for Ln(BW), and a4: partial regression coefficient for Ln(F). DLLN: disparity between the log-transformed value of the reference mean and that of the LLN. Adjusted-R2: the coefficient of determination adjusted for degrees of freedom.
Table 2: Partial regression coefficients for reference means and LLNs of spirometric parameters in males (M) and females (F).
The coefficients of variation (CVs) of the main SPs were small; 15.7% for the FVC, 14.6% for the FEV1, and 7.8% for the FEV1/FVC in males and 19.5% for the FVC, 18.5% for the FEV1, and 8.2% for the FEV1/FVC in females. However, the CVs of the flow parameters were appreciably large; the CVs of the PEF, FEF50, and FEF75 in males were 27.9%, 36.9%, and 49.2%, respectively, while the CVs of the flow parameters in females were 32.8%, 44.8%, and 77.9%, respectively.
Effect of age
The partial regression coefficients (a1) of the Ln(A) for most SPs were conspicuously aging-dependent (Table 2). The exception was the FVC in the males, the FEV1/FVC in both genders, and the FEF75 in the females, in which the a1 values were constant, irrespective of the age. In general, age acted as the factor that had a negative (decreasing) impact on the SP through the aging-dependent or aging-independent contribution of a1; however, the FVC in the males was exceptionally prescribed by the aging-independent, positive effect of a1 in collaboration with the aging-dependent, negative contributions of a3 and a4.
When the analysis was performed under conditions with a varying A but constant H, BW, and F, the reference mean of the FVC changed from a near plateau to a negative direction at 25-30 years in both genders (Figure 3). We defined this change as the “transition point”. The aging-dependent change in a3 or a4 significantly contributed to the formation of the transition point of the male FVC, whereas the agingdependent change in a1, a2, or a3 played a role in the formation of the transition point of the female FVC. The transition points were also determined for the FEV1 and PEF in both genders; however, they were less evident than the transition points detected for the FVC. The transition points of the FEV1 and PEF in both genders were also generated by aging-dependent changes in ai. On the other hand, the FEV1/FVC, FEF50, and FEF75 in both genders monotonously decreased with age without forming the transition points, even though several ai of these SPs were also aging-dependent.
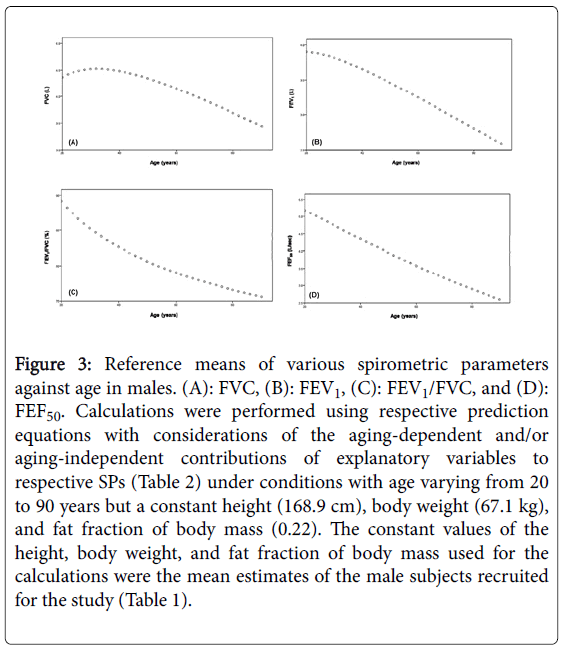
Figure 3: Reference means of various spirometric parameters against age in males. (A): FVC, (B): FEV1, (C): FEV1/FVC, and (D): FEF50. Calculations were performed using respective prediction equations with considerations of the aging-dependent and/or aging-independent contributions of explanatory variables to respective SPs (Table 2) under conditions with age varying from 20 to 90 years but a constant height (168.9 cm), body weight (67.1 kg), and fat fraction of body mass (0.22). The constant values of the height, body weight, and fat fraction of body mass used for the calculations were the mean estimates of the male subjects recruited for the study (Table 1).
Effect of height
Although an aging-dependent, positive contribution of the partial regression coefficient (a2) of the Ln(H) was identified for the PEF in the males or the FVC or PEF in the females, the a2 exerted an agingindependent positive impact on the FVC and FEF50 in the males as well as the FEV1 and FEF75 in both genders (Table 2). Collectively, these findings indicate that H acts as the factor augmenting most SPs in an aging-dependent or aging-independent manner irrespective of the gender. However, H exerted an aging-independent, negative contribution to the FEV1/FVC in both genders, which is qualitatively consistent with the findings reported so far [19,20].
The analysis performed under a condition with a varying H but a constant A, BW, and F confirmed that the refence means of most SPs were augmented, but those of the FEV1/FVC decreased with an increasing H in both genders (Figure 4). The FEV1/FVC in the males was simply determined by the aging-independent, negative contribution of A and H, whereas the FEV1/FVC in the females was determined by the aging-dependent contribution of the BW and F in combination with the aging-independent, negative contribution of A and H.
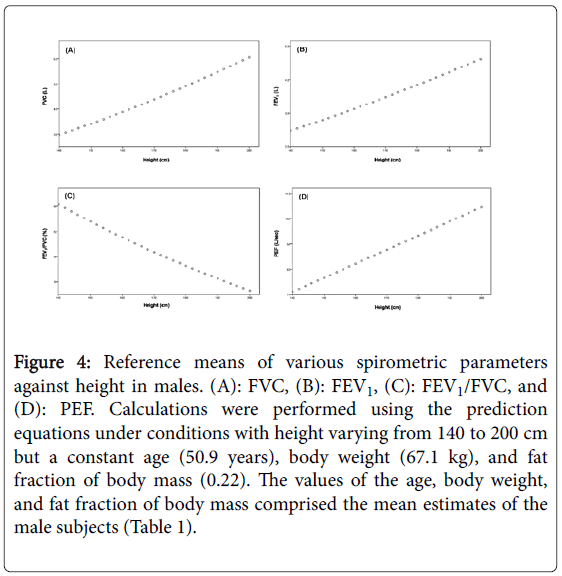
Figure 4: Reference means of various spirometric parameters against height in males. (A): FVC, (B): FEV1, (C): FEV1/FVC, and (D): PEF. Calculations were performed using the prediction equations under conditions with height varying from 140 to 200 cm but a constant age (50.9 years), body weight (67.1 kg), and fat fraction of body mass (0.22). The values of the age, body weight, and fat fraction of body mass comprised the mean estimates of the male subjects (Table 1).
Effect of body weight
In the males, the aging-dependent change in the partial regression coefficient (a3) of the Ln(BW) was only identified for the FVC, in which the positive effect of a3 was weakened as age advanced. The a3 values for the FEV1, FEV1/FVC, and PEF were zero, while the a3 value for the FEF50 was constant in the males (Table 2).
In the females, the a3 exerted aging-dependent, positive effects on all SPs with the exception of the FVC and PEF (Table 2). BW functioned as the factor that augmented the female FVC; however, this positive effect faded with advancing age. The female PEF was enhanced by the BW in an aging-independent fashion. These findings were consistent with the idea that the aging-specific, positive contribution of BW to SPs played a substantial role specifically in the females.
The analysis performed under a condition with a varying BW but a constant A, H, and F certified that BW consistently augmented the reference means of all SPs in the females (Figure 5) as well as those of the FVC and FEF50 in the males.
Effect of fat fraction of body mass
The negative effect of the fat fraction of body mass (F) was only identified for the FVC, FEV1, and FEF75 in the males (Table 2).
The FVC and FEV1 in the males were lowered by an agingdependent, negative impact of F, which was enhanced as age advanced. The male FEF75 was decided by an aging-dependent, negative impact of F, which was weakened as age advanced. There was no contribution of F to the FEV1/FVC, PEF, or FEF50 in the males.
Although F basically had a negative impact on all SPs in the females, its effect qualitatively differed between the SPs (Table 2). The negative effect of F on the FVC and FEF50 was aging-independent, whereas that on the FEV1 and PEF was aging-dependent; thus, the negative impact of F on the FEV1 or PEF was augmented as age advanced. Although F functioned as the factor that reduced the female FEV1/FVC and FEF75, the negative impact of F on these SPs decreased as age advanced. The male and female findings indicated that the effects of F on the SPs were more evident in the females.
The analysis performed under a condition with a varying F but a constant A, H, and BW demonstrated that the F decreased the reference means of many SPs in a curvilinear fashion irrespective of the gender (Figure 6).
Transition points of spirometric parameters
Lung function has been demonstrated to follow the three phases of growth, plateau, and decline with age from childhood to advanced age, which leads to the formation of two transition points between growth and plateau (the 1st transition point) and between plateau and decline (the 2nd transition point) [1-3,12,16,40,41]. In the present study, we targeted the 2nd transition point only, because we enrolled adult subjects over 20 years of age for the current analysis. The age that generates the 2nd transition point is not consistent between studies and ranges from 23 to 39 years in males and from 18 to 40 years in females [16,41,42]. Consistent with previous studies, we identified the 2nd transition point for the FVC at an age of approximately 25-30 years in both genders (Figure 3). We also identified the 2nd transition points in the FEV1 and PEF in both genders, whereas we failed to detect them for the other spirometric parameters. Although the basic mechanism that forms the 2nd transition point has not been conclusively elucidated, we consider that an aging-dependent change in the effects of age, height, body weight, and/or fat fraction of body mass on spirometric parameters may play a role in transition point formation.
Gender-specific difference in the contribution of body weight and fat fraction of body mass
Body weight and fat fraction of body mass had no impact on the FEV1/FVC or PEF in males. Furthermore, there was no influence of body weight on the FEV1 in males and no influence of fat fraction of body mass on the FEF50 in males. These findings suggest that the male SPs are predominantly decided by age and height in an agingdependent and/or aging-independent manner (Figures 3 and 4). In contrast with males, all SPs in females were influenced by body weight, fat fraction of body mass, or both factors in an aging-dependent and/or aging-independent manner (Figures 5 and 6), which indicates that the female SPs are more sensitive to the positive effect of body weight that is the representative of respiratory muscles and/or to the negative effect of fat fraction of body mass that is the representative of fat deposition in the thoracic and abdominal cavities. We certified that the contribution of body weight to the female FVC was decreased, while the contribution of body weight to the female FEV1, FEV1/FVC, FEF50, or FEF75 were increased as age advanced (Table 2). The former phenomenon may be simply explained by the fact that independent of the total muscle mass, the strength and function of body muscles, including respiratory muscles, are decreased as age advances [32-35]. Although it is difficult to convincingly explain the latter phenomenon, we consider that it may reflect a relative increase in the contribution of respiratory muscles to the maintenance of these spirometric parameters in aged women; however, the function of respiratory muscles per se is lowered with aging.
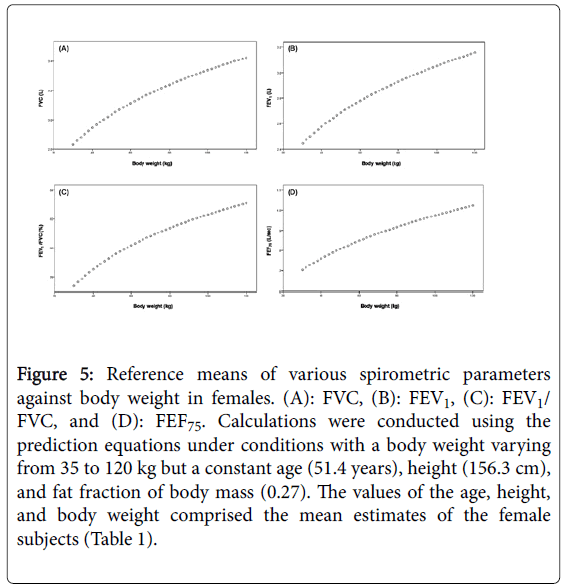
Figure 5: Reference means of various spirometric parameters against body weight in females. (A): FVC, (B): FEV1, (C): FEV1/ FVC, and (D): FEF75. Calculations were conducted using the prediction equations under conditions with a body weight varying from 35 to 120 kg but a constant age (51.4 years), height (156.3 cm), and fat fraction of body mass (0.27). The values of the age, height, and body weight comprised the mean estimates of the female subjects (Table 1).
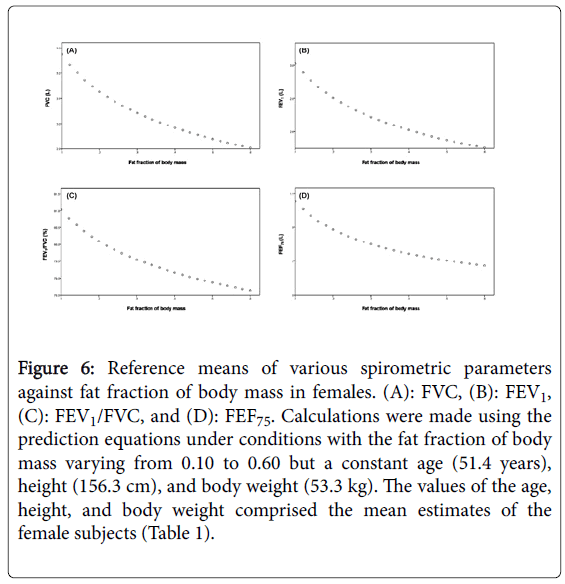
Figure 6: Reference means of various spirometric parameters against fat fraction of body mass in females. (A): FVC, (B): FEV1, (C): FEV1/FVC, and (D): FEF75. Calculations were made using the prediction equations under conditions with the fat fraction of body mass varying from 0.10 to 0.60 but a constant age (51.4 years), height (156.3 cm), and body weight (53.3 kg). The values of the age, height, and body weight comprised the mean estimates of the female subjects (Table 1).
Similarly, we found diverse variations in the negative effects of the fat fraction of body mass on female SPs with aging; the negative impacts of the fat fraction of body mass on the female FEV1 and PEF were enhanced, while those on the FEV1/FVC and FEF75 were inhibited with aging (Table 2). However, the negative impacts of the fat fraction of body mass on the female FVC and FEF50 we’re not related to aging. It is difficult to explain the essential mechanisms that underlie these findings; however, they may indicate that the aging-dependent increase in fat accumulation in the thoracic and/or abdominal cavities elicits a negative effect on the SP in qualitatively different ways [20].
Combined effect of body weight and fat fraction of body mass on spirometric parameters
To evaluate the aging-dependent and/or aging-independent, integrated impacts of body weight and fat fraction of body mass on prescribing the spirometric parameters, we compared the reference means of FVC estimated based on the regression equation established in the present study and those calculated from the simple linear regression equation with two explanatory variables of A and H (i.e., SP = g0 + g1·A + g2·H, in which g1 and g2 comprise agingindependent, constant coefficients) reported by the Japanese Respiratory Society (JRS) [43]. In most of the age range, the reference means of FVC estimated from the present equation were appreciably larger than the values calculated from the simple linear equation with aging-independent contribution of age and height (Figure 7). Furthermore, the simple linear equation failed to yield a transition point in the plot of FVC against age. These findings suggest that the disregard of aging-dependent and/or aging-independent effects of body weight and fat fraction of body mass elicits a significant error in the reference means of SPs, which, in turn, induces a substantial error in the LLNs.
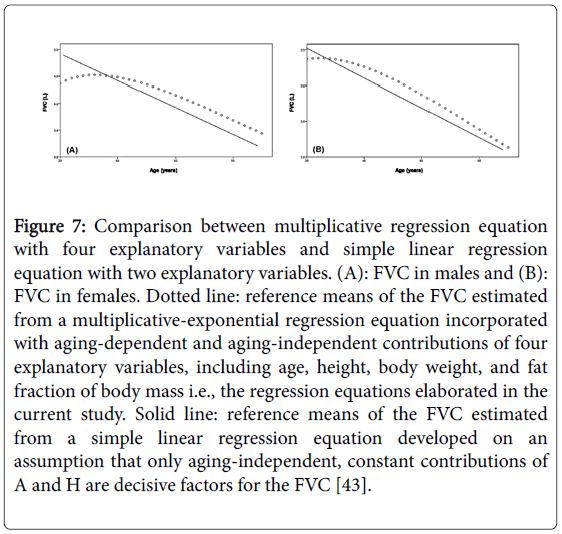
Figure 7: Comparison between multiplicative regression equation with four explanatory variables and simple linear regression equation with two explanatory variables. (A): FVC in males and (B): FVC in females. Dotted line: reference means of the FVC estimated from a multiplicative-exponential regression equation incorporated with aging-dependent and aging-independent contributions of four explanatory variables, including age, height, body weight, and fat fraction of body mass i.e., the regression equations elaborated in the current study. Solid line: reference means of the FVC estimated from a simple linear regression equation developed on an assumption that only aging-independent, constant contributions of A and H are decisive factors for the FVC [43].
Study limitations
We should acknowledge that the cohort of the subjects used for the present analysis was only recruited from the Japanese population. Therefore, it is necessary to verify the general applicability of the regression equations developed in the present study to other races and ethnicities.
We did not confirm the nonsmoking status based on the urinary cotinine measures. However, we showed that the number of selfreported, current and previous smokers was 45.5% of the total number of subjects who underwent the medical checkup (see the method section). Of the subjects with a smoking history, the percentage of the current smokers was 48%, which corresponded to 22% of the total number of subjects undergoing a medical checkup. This value does not differ from the percentage of current smokers reported for a general population in Japan at the time point of 2009 (average percentage of males and females: 25%) [44]. Therefore, we believe that the selfreported smoking status obtained in the present study does not deviate significantly from the veritable value of smoking status.
Although we agree to the rationale that the best statistical strategy for creating the reference equation predicting a specific spirometric measure may be the Lambda-Mu-Sigma (LMS) method, in which the Lambda models the skewness representing the disparity of the variables from normality and the Mu expresses the change in the median of an objective outcome, while the Sigma models the dispersion of measured values around the reference mean [1-3,39,45,46], we did not apply the LMS strategy in the current analysis. Instead, we applied the classical, multiple regression analysis with least squares minimization, in which the component of Mu and that of Sigma in the LMS strategy are approximately assessed from the reference mean and the coefficient of variation, respectively, but that of Lambda (the skewness) is not taken into account. The reason we applied the classical least-squares minimization is due simply to the fact that we tried to predict the aging-dependent changes in the partial regression coefficients of four explanatory variables of age, height, body weight, and fat fraction of body mass and we did not know how the aging-dependently changing partial regression coefficients were correctly evaluated from the LMS method. Since the least-squares minimization does not rectify the skewness (the disparity of the variables from normality), its application needs the approval of normal distributions in the objective variable, explanatory variables, and residuals between measured values and values predicted from the reference equation. Among them, the normality confirmation in the residual distribution, which is closely linked to the distributions of objective variable and explanatory variables, is the critical issue when applying the least-squares minimization [38]. Therefore, we examined the residual distributions of six spirometric parameters in both genders (S-Figures 6 and 7) in the Supplemental Information-3). From this examination, we learned that the residuals of the major spirometric parameters in both genders, including the FVC, FEV1, and FEV1/FVC, nearly follow the normal distributions. However, the residuals of the flow parameters, particularly the female FEF75, deviated from the normal distributions to some extent. These facts suggest that the effect of skewness on regression equations for the major spirometric parameters is minimal but that for the flow parameters may not be ignored. Thus, we concluded that the classical least-squares minimization can be applied for creating the regression equations for the major spirometric parameter, which may have no inferiority compared with those created by the LMS method. However, the reliability of regression equations for the flow parameters constructed by the aid of least-square minimization may be low.
We developed novel regression equations for prescribing the reference means and lower limits of normal of six spirometric parameters in nonsmoking, non-obese, healthy adults, in which the aging-specific corrections of various explanatory variables were comprehensively considered. We demonstrated that in general, age and fat fraction of body mass had negative effects, whereas height and body weight had positive effects on the spirometric parameters in an agingdependent and/or aging-independent manner. If the aging-dependent and/or aging-independent contributions of body weight and/or fat fraction of body mass were ignored, substantial errors would emerge for the reference mean and lower limit of normal of a certain spirometric parameter. Furthermore, we showed that the aging-specific contributions of explanatory variables to spirometric parameters are highly gender-specific, particularly in the effects of body weight and fat fraction of body mass.