Cell & Developmental Biology
Open Access
ISSN: 2168-9296
ISSN: 2168-9296
Research Article - (2013) Volume 2, Issue 3
A clear change in the slope of the declining numbers of neurons in the cerebral cortices and hippocampus could reflect the “critical” mass, where qualitative shifts occur for correlative behaviors. In the present study, numbers of neurons within the layers of different regions of the cerebral cortices and the hippocampus were counted for rats, between the ages of 30 and 940 days. A conspicuous sudden inflection in the gradual decline of neurons occurred for both regions, around 700 days of age. Partial correlation analyses indicated that the cortical decline was dependent upon loss of neurons in the hippocampus. Neurons within layers 5 and 6 of the prefrontal cortices were particularly affected. These results are consistent with human brain data and the clinical course of dementias, and suggest that a subset of less than about 25% of original neurons may drive the geriatric process. Identification of these neurons by biomolecular indicators could lead to effective interventions.
<Although cerebral senescence is a cell-driven process coupled to a variety of metabolic- and replication-derived processes [1,2], the numbers of cells within a volume of tissue, including the cerebrum, show emergent properties that are dependent upon cell density. The cerebral cortices [3-5], and the hippocampal formation [6-9], are two powerfully interconnected volumes of mammalian brains that are the major correlates for memory.
In human beings, these structures are also strongly associated with processes described as consciousness, self-awareness [10], and the types of episodic memory specific to autobiographical memory [8,11]. For example: retrieval of represented experiences about where and within whom memories occurred, involves a disproportional increase in activity within the right prefrontal region [5,12]. Assuming that the numbers of neurons, and their implicit connections in large part determine the amount of information that can be represented, we have been investigating the consequences of normal aging upon neuronal numbers to discern, if loss of neurons to a critical mass is required before qualitative changes in complex cognitive properties occur.
In the following analyses, we had access to brains from rats that occupied a wide ontogenetic range, from weaning to over 940 days of age. We examined the hypothesis that in very old brains, the decline in neuronal numbers would be accelerated at a specific age, and certain regions and layers would be differentially affected. The determination of the quantitative proportions of neuronal loss may lead to more clear understanding of potential subpopulations of neurons that are more vulnerable because of local sensitivity, focal or anistropic aberrant metabolic variations, or genetic influences, in a manner similar to the DNA-determined apoptosis of specific classes of neurons within the basal ganglia, from chromosome 4 anomalies.
That a reduction in the numbers of neurons within the cerebral cortices occurs in human beings, as a function of normal geriatric progression, has been known histologically for over a hundred years [13]. Although the arguments range from minimal loss of actual cells, but instead reduced volume of previously existing magnocellular neurons [14-16], to actual apoptotic or necrotic-induced declines [17], the critical observation is that cerebral cortical neurons are fewer in the very old cerebrum [14,18,19]. The more or less linear decline in averaged numbers of cortical neurons in human brain accelerates precipitously after 75 to 80 years of age [20]. For the hippocampal formation, as inferred by MRI measurements, the age-dependent decline in whole volume (which presumably reflects neuronal numbers and sizes), has been assumed to be more linear [21,22].
A total of 32 cerebrums from Wistar albino rats, primarily female, were selected from our collection of brains. After weaning, the rats had been housed (2 to 3 per cage) at ambient room temperature, with a 12 hour light and dark cycle. Purina rat chow and water were available ad libitum throughout the lifespan of the rats. Selected brains had been fixed in ethanol-formalin acetic acid, as a component of our long-term aging study. Whereas rats less than 400 days had been sacrificed as controls for various studies, all of the rats older than 400 days were sacrificed when they reached the criteria for near terminal conditions, as prescribed by the University’s Animal Care Committee and the policies of the Canadian Council on Animal Care.
After clearing and infiltration, the cerebrums were embedded in paraffin. They were each sectioned at 10 μm and stained with toludine blue O, to include the same or very similar region of the occipital, parietal, temporal, and two frontal cortices, as defined by Paxinos and Watson [25]. Fp1 (M1) and Fp2 (M2) were selected because they were most representative of simple motor (Fp1) vs more “prefrontal” (Fp2) locations.
The numbers of neuronal soma in each of the six layers for each of the three caudal (temporal, parietal, occipital) locations and five layers for the frontal cortices were counted at 400X, using a 6×6 grid as reference. The summed area for the grid at 400X was equivalent to 0.09 mm2. Because there is no discernable layer 4 in the frontal cortices, the numbers of neurons in lower portion of layer three and upper portion of layer 5 were averaged for this layer, for the purposes of statistical analyses. The means of three separate samples within the same region of each layer for each location were computed, and employed as data. Correlation, partial correlation, analyses of variance, regression, factor analyses were completed on PC SPSS 16.
Figure 1 shows the relationship between the mean numbers of neurons (per .09 mm2), in all layers, for all the sampled regions of the cerebral cortices as a function of age. Histological examples from the prefrontal (Fp2) cortices are shown in Figure 2. A similar pattern was noted (Figure 3) for the mean numbers of neurons (per 0.09 mm2), within the CA fields of the hippocampus. Histological examples representing the age effect upon neuronal density is shown in Figure 4.
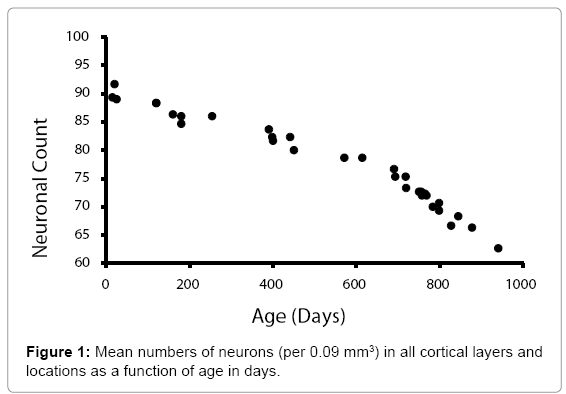
Figure 1: Mean numbers of neurons (per 0.09 mm3) in all cortical layers and locations as a function of age in days.
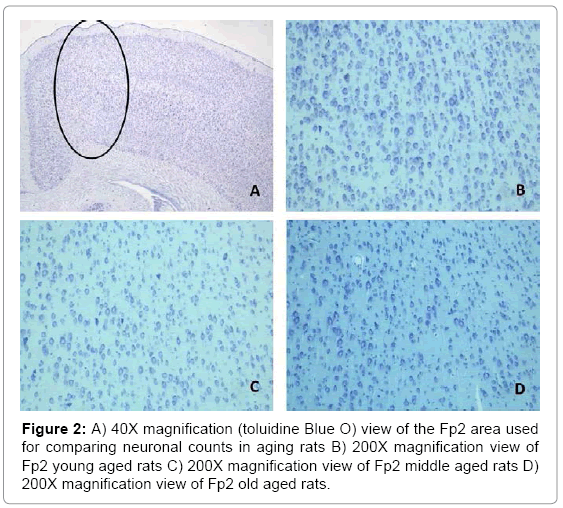
Figure 2: A) 40X magnification (toluidine Blue O) view of the Fp2 area used for comparing neuronal counts in aging rats B) 200X magnification view of Fp2 young aged rats C) 200X magnification view of Fp2 middle aged rats D) 200X magnification view of Fp2 old aged rats.
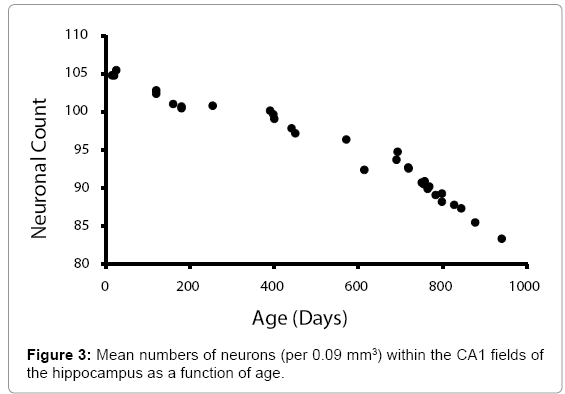
Figure 3: Mean numbers of neurons (per 0.09 mm3) within the CA1 fields of the hippocampus as a function of age.
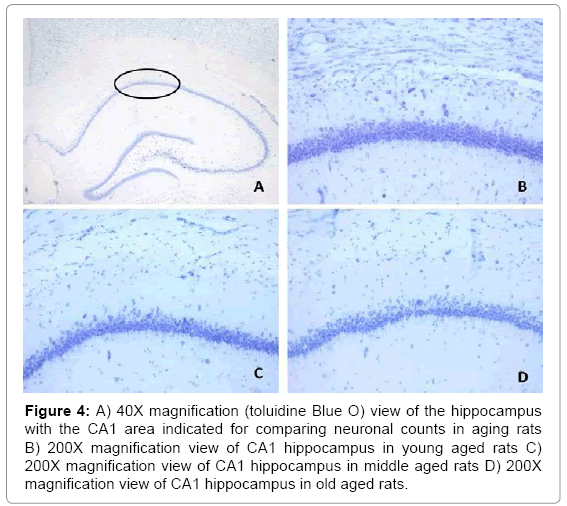
Figure 4: A) 40X magnification (toluidine Blue O) view of the hippocampus with the CA1 area indicated for comparing neuronal counts in aging rats B) 200X magnification view of CA1 hippocampus in young aged rats C) 200X magnification view of CA1 hippocampus in middle aged rats D) 200X magnification view of CA1 hippocampus in old aged rats.
The visible inflection point for accelerated diminishment of numbers of neurons after 700 days of age was assessed by regression analyses, to discern slopes. For the mean numbers cerebral cortical neurons, the slopes before and after the inflection point were -.014 and -.036, respectively (r values 0.97, 0.99, respectively). For the mean numbers of hippocampal neurons, the slopes before and after the inflection point were -0.020 and -0.053, respectively (r values 0.98, 0.98).
Even though the sample size was limited to 32 brains, an exploratory factor analyses was completed for numbers of neurons in all cortical areas and layers, in order to find general relationships. A total of 6 factors emerged with the first factor (Eigen value=15.55; 52% variance explained), along with the second factor (Eigen value=2.39; 8% of variance explained), and third (Eigen value=1.78; 6% of variance explained), accommodating two-thirds of all of the variance. The loading coefficients (correlations) of each variable for the three factors are shown in Table 1. Given the sample size, we accepted only rs>0.7 as significant, statistically. In general, the common theme involved shared variance between neurons in layers 3 through 6 for most layers. Factor analyses for the three hippocampal CA fields (not shown), resulted in one factor.
| Area | Factor 1 | Factor 2 | Factor 3 |
|---|---|---|---|
| F1 L1 | 0.187 | 0.558 | 0.055 |
| F1 L2 | 0.051 | 0.430 | 0.703 |
| F1 L3 | 0.941 | 0.208 | 0.087 |
| F1 L4 | 0.861 | 0.294 | 0.154 |
| F1 L5 | 0.966 | 0.160 | 0.067 |
| F1 L6 | 0.929 | 0.226 | 0.106 |
| F2 L1 | 0.217 | 0.725 | 0.145 |
| F2 L2 | 0.389 | 0.633 | 0.088 |
| F2 L3 | 0.838 | 0.428 | 0.107 |
| F2 L4 | 0.791 | 0.327 | 0.173 |
| F2 L5 | 0.909 | 0.346 | 0.045 |
| F2 L6 | 0.940 | 0.246 | 0.132 |
| T L1 | 0.141 | 0.093 | 0.030 |
| T L2 | 0.518 | -0.130 | 0.535 |
| T L3 | 0.771 | 0.009 | 0.325 |
| T L4 | 0.643 | 0.243 | -0.070 |
| T L5 | 0.923 | 0.226 | -0.011 |
| T L6 | 0.920 | 0.228 | 0.129 |
| P L1 | 0.581 | 0.412 | -0.251 |
| P L2 | 0.212 | 0.062 | 0.832 |
| P L3 | -0.034 | -0.149 | -0.119 |
| P L4 | 0.687 | -0.094 | 0.312 |
| P L5 | 0.764 | 0.473 | 0.138 |
| P L6 | 0.606 | 0.269 | 0.372 |
| O L1 | 0.190 | 0.045 | 0.093 |
| O L2 | 0.519 | 0.594 | 0.273 |
| O L3 | 0.650 | 0.256 | 0.205 |
| O L4 | 0.789 | -0.203 | 0.034 |
| O L5 | -0.037 | 0.137 | -0.039 |
| O L6 | 0.775 | -0.042 | 0.171 |
Table 1: Loading (correlation coefficients) for the various layers and areas for the first three major factors for numbers of neurons.
The relationship between the factor scores for the first factor, for the numbers of neurons in the cerebral cortices, in comparison with the factor score for hippocampal neurons, are compared in Figure 5. Although the initial raw scores for numbers of neurons differed between the hippocampus and the cortices, the best-fit central tendency of the z-scores for the decline of the two populations with age were effectively identical.
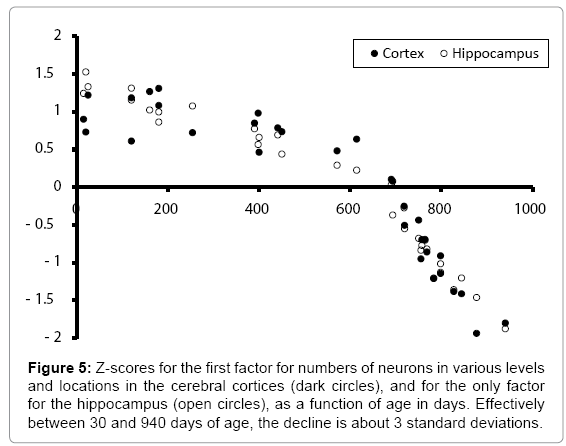
Figure 5: Z-scores for the first factor for numbers of neurons in various levels and locations in the cerebral cortices (dark circles), and for the only factor for the hippocampus (open circles), as a function of age in days. Effectively between 30 and 940 days of age, the decline is about 3 standard deviations.
The intercorrelation coefficients were: age-cortices: -0.98, agehippocampus: -0.97, and hippocampus-cortices: 0.99. To address this “identity” problem, partial correlation analyses (all dfs=29) were completed. After removal of the shared variance with the third variable, the first order partial correlations were: age-cortices: -0.38 (p<.05), hippocampus-cortices: -0.27 (n.s.), and age-hippocampus: 0.77 (p<.001).
Figure 6 shows a comparison of the mean numbers of neurons within the five locations, as a function of aging. The Fp2 and temporal cortices displayed the most congruent decrease (in slope), while the occipital cortices displayed the least decrease, although the negative drift was still apparent.
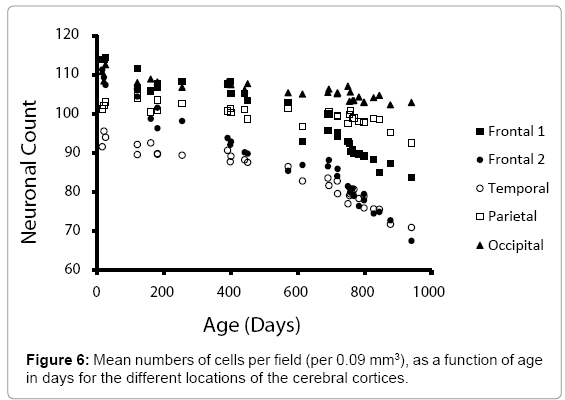
Figure 6: Mean numbers of cells per field (per 0.09 mm3), as a function of age in days for the different locations of the cerebral cortices.
In order to discern recondite interactions between numbers of neurons within cerebral layers and locations as a function of age, the brains were designated to 4 groups: adolescent, young (3) adult (6), middle aged adult (6), and very old adult (17). The mean numbers of cells per layer (for all regions) and mean numbers of cells per region (layers combined), were analyzed by analyses of variance. Because group differences (all dfs=3,28) were highly significant statistically (all Fs>8.00), omega-squared estimates (effect sizes) were obtained for comparison. The results are shown in Table 2.
| Area | Omega2% | Pups | Young | Middle-Age | Old | ||||
|---|---|---|---|---|---|---|---|---|---|
| M | SD | M | SD | M | SD | M | SD | ||
| Layer 1 | 62 | 18 | 1 | 14 | 2 | 12 | 1 | 12 | 2 |
| Layer 2 | 47 | 75 | 1 | 70 | 2 | 69 | 1 | 67 | 4 |
| Layer 3 | 79 | 151 | 2 | 156 | 1 | 142 | 1 | 135 | 4 |
| Layer 4 | 67 | 112 | 2 | 109 | 1 | 107 | 1 | 102 | 3 |
| Layer 5 | 87 | 135 | 1 | 133 | 2 | 126 | 3 | 113 | 5 |
| Layer 6 | 85 | 145 | 1 | 143 | 1 | 133 | 4 | 114 | 7 |
| Frontal 1 | 89 | 114 | 1 | 108 | 2 | 105 | 2 | 91 | 4 |
| Frontal 2 | 85 | 109 | 2 | 101 | 4 | 91 | 3 | 80 | 6 |
| Temporal | 83 | 94 | 2 | 91 | 1 | 88 | 1 | 78 | 4 |
| Parietal | 56 | 102 | 1 | 103 | 2 | 101 | 1 | 98 | 2 |
| Occipital | 74 | 111 | 2 | 108 | 1 | 107 | 1 | 104 | 1 |
Table 2: Descriptive values for the average number of neurons (per 0.09 mm3) per layer and per region (all layers combined).
A three way analyses of variance, with two levels repeated (layers and locations), and one between subject level (age), showed a significant (F(3,28)=61.83, p<.001; eta-squared=0.87) main effect for age differences. All of the two way and the three way interactions were statistically significant; for example: the interaction between age, location and layer was quite strong (F(60,560)=22.17, p<.001).
The aging cell, including the neuron, undergoes a variety of biochemical modifications from internal (molecular pathways) and external (vascular availability) sources that result in diminished metabolic capacity [26,27]. The consequences are the classic “die back” of more distal dendrites, and general reduction of soma volume. The removal of dendritic connections, the presumed major correlate of information storage within the cerebral volume, has been considered to be the major cause of the loss of behavioral capacity and cognitive abilities [28,29]. These changes in the human being become very conspicuous after 75 years of age, and increase at an accelerated rate compared to previous decades.
The results of our quantitative analyses for geriatric rat brain are remarkably consistent with the gross clinical observations noted in human populations [30]. The mean numbers of neurons as a function of age, within both the cerebral cortices and the hippocampal formation, displayed a clear inflection downwards at around 700 days of age. The slopes were similar for both populations of neurons. Quantitatively after the age of 700 days, the loss increased by a factor of about 2.5 (250%), in both the cerebral cortices, in general, and the hippocampal formation. Comparisons of the factor scores that removed the individual differences in values for neurons in these two locations indicated the intrinsic age-related processes were effectively identical (Figure 3).
The decline in factor scores, representing the shared variance in numbers of neurons within the CA hippocampal fields and the cerebral cortices, was equivalent to 3 standard deviations over the age span of the youngest brain (30 days of age) to the oldest brain (940 days). This translated into the quantitative equivalent of a loss of about 25% of total mean numbers of neurons in the cerebral cortices and the hippocampus. In other words, the majority of neuronal numbers compared to very young brains were still present, despite the loss of capacity in these very old rats. This quantitative proportion would be consistent with the contention, there is a “critical” mass or essential number of neurons required for the emergent properties that define the qualitative aspects of a species.
Although the marked congruence of the non-linear decline in factor scores for both the cerebral cortices and hippocampus were similar, the results of the partial correlation analyses were revealing. When three or more variables are strongly intercorrelated, there is often one intercorrelation whose presence is epiphenomenal, because of its recondite relation to other variables. For example: the bivariately obvious association between cholesterol and certain pathologies of the lumen of arteries was found to be actually more related to triglycerides. The cholesterol connection was because these levels were primarily determined by the triglycerides, which were (at the time) less discernable.
In the present study, the residuals from covarying for the other locus of neurons, before either the hippocampal formation or cerebral cortices, was correlated with age, showed that association between age and neurons in the latter was no longer significant. However, when the shared variance with neurons within the cortices was first removed, the hippocampal-age connection remained strongly correlated and statistically significant.
Classical interpretation of such a relationship suggests that the decline of neurons in the hippocampal formation is primarily responsible for the similarly proportional decline of neurons within the cerebral cortices. Such an interpretation would be consistent with the general models, that the cerebral cortices evolved as an additional volume that allows “storage” of information [3,15], first represented and then accessed from the hippocampal formation [31], following the transient electrical lability of about 20 min, during which time, spine emergence occurs in those regions affected by the experience [23]. It would also be consistent with the fact that the cortical thickness has not changed appreciably in the evolution of mammals, and that the increased volume of the hippocampal formation and cerebral volume are strongly associated [1,8,12].
The dependence of neuronal density or a subpopulation of neurons, within the cerebral cortices upon hippocampal neurons, could accommodate the general patterns of degenerative activity that occurs during multiple forms of senile dementia. Denuding of the hippocampal formation from other brain regions is the first major stage of senility, particularly presenile dementias [32]. Indeed, the loss of neurons within the basal nucleus of Meynert, and the diminished cholinergic input to the cerebral cortices, particularly the prefrontal regions, are strong parallel occurrences. Our results suggest that loss of neurons within the hippocampal formation would be the initiating process that affected the subcortical telenencephalic-cerebral cortical network. We predict that the neurochemical identification of the neurons most lost in the aging brain would be those related to cholinergic- dominated neurons.
The other major change we observed in very old rats is that the prefrontal cortices and the temporal cortices were disproportionately affected by the latter stages of aging. The slope of the decline in neurons was visually obvious compared to other areas, such as the occipital cortices, after 700 days of age. If analogous changes occur in the human brain, then one would expect the greater loss of accuracy and potency of autobiographical memory, because of its strong reliance upon the left prefrontal region for encoding, and the right prefrontal region for organization of the reconstruction of memory [33].
The layers of the cortices that were most affected were 5 and 6. They contain the neurons that are intimately associated with the feedback loops from the thalamic nuclei, and to the caudate-putamen [34]. These loops are important for stimulus-response association for various sensory modalities [34]. From some perspectives, they might also be considered the base information from which the upper cortical layers and their greater interhemispheric interactivity access information that contributes to higher cognitive and behavioural function.
Enhanced loss of neurons within the lower cortical layers could also be associated with general diminishment of activation to sensory stimuli [34]. This effect would be congruent with the fMRI studies that showed older individuals show less activation to stimuli [32]. With less activation to “novel” stimuli, more complex and sensitive pathways could be more prone to a type of “transneuronal” degeneration from diminished input. Decline in prefrontal neurons in the lower layers would affect the intrinsic circuitry of the basal ganglia.
Quantitative studies of neurons within the layers of the cerebral cortices from different regions are labour-intensive and time consuming. Although chemical indicators are attractive, and molecular pathways within aging cells populations are critical to understanding the biochemistry of senescence, the absolute numbers of neurons and how they reflect normal aging, might contain sufficient macroscopic information and patterns that reflect the details within the bimolecular pathways, for which some interventions could be developed.
We thank the Laurentian University Neuroscience Research Group, whose dedication for maintaining the health and longevity of the rats, despite pressures from external bodies, cost many of them their careers and opportunities.
Mr. Lukasz M Karbowski completed the histology and cytometry. Dr. Michael A Persinger and Robert M Lafrenie were involved with the design of the experiment, the data analyses, and the composition of the manuscript.