Journal of Proteomics & Bioinformatics
Open Access
ISSN: 0974-276X
ISSN: 0974-276X
Research - (2023)Volume 16, Issue 4
Antibiotic resistance increasingly has become a threat to global health as it hampers the efficacy of current antibiotics and the development of new antibiotic drugs. Appropriate identification of Antibiotic Resistance Genes (ARGs) is fundamental to the administration of the right antibiotics and for epidemiological purposes. However, mechanisms for identifying antimicrobial resistance such as minimum inhibitory concentration are tedious and time consuming. Also, using sequence similarity-based models have also not been able to identify novel ARGs which are highly diverse compared to known genes. To explore ARGs among genomic sequences, we comparatively applied three-word embedding techniques, Global Vectors (GloVe), Skip-Gram (SG) and Continuous Bag of Words (CBOW) to bacterial sequences and subsequently using the word vectors as embedding layers in Bidirectional Recurrent Neural Networks (BiRNNs) to classify bacterial sequences as ARGs or not. Among our three models, BiRNN with GloVe embedding layer achieved the highest accuracy of >97% on test dataset. Our models were able to identify novel resistance genes with high recalls >0.99% and precision >91%. Our models outperformed commonly used bioinformatics baseline models, Basic Local Alignment Search Tool (BLAST), Resistant Gene Identifier (RGI), Fragmented Antibiotic Resistance Gene (fARGene) and HMMER. Deep learning models with word embedding layers provide efficient tools for identifying diverse and novel resistance genes.
Antibiotic resistance; Antibiotic Resistance Genes (ARGs); Genomic sequences; Global Vectors (GloVe)
Antimicrobial resistance has markedly gained international attention and recently been tiered by the World Health Organization as one of the three most critical threats to public health in the 21st century [1]. It has thwarted efforts to treat infectious diseases and has subsequently led to increasing health care costs. About $55 billion is estimated to be the associated annual cost of antibiotic resistance [2]. Aside from the economic and clinical burden it impinges, estimated annual deaths causally linked with antimicrobial resistance infection in both the United State and Europe is more than 35,000 [3]. With unfavorable projections pointing to about 10 million deaths in the next thirty years [2]. The advent of this adaptive mechanism developed by bacteria to counter toxic effects from their environments has also presented a persistent challenge to the development of new antibiotics due to the potential economic losses involved in developing new antibiotics [4]. The conventional approach to detecting antimicrobial susceptibility in bacteria has been culturing bacteria from an infected patient in the lab. However, this process for non-fastidious bacteria may require 16 to 18 hours whereas as others may take more than 24 hours to obtain results, leading to high mortality rate for infections resulting from antibiotic resistance [5]. Recent developments in whole genome sequencing rendering them inexpensive and widely used have furnished best-hit tools such as Basic Local Alignment Search Tool (BLAST) to be used in identifying antimicrobial resistance genes in databases [6-7]. However, best-hit and sequence-similarity tools are fraught with difficulty in identifying novel ARGs, thus, producing unacceptable numbers of false negatives [8-10]. Word embeddings have been used as representations of words and have applications in recommender system, semantic, similarity, analogy, etc. tasks in natural language processing [11-14]. The application of word embedding techniques in bioinformatics and medical-related classification problems such as classification of antimicrobial peptides, named entity recognition, chromatin accessibility predictions has yielded satisfactory results [10,15,16]. The two versions of Word2vec, SG and CBOW with GloVe are the commonly used word embedding techniques. However, since the inception of these neural word-embedding models, scholarly discourse has wobbled on the definitive superiority in performance. Evidently, word embedding models have performed at variance in different tasks and downstream processing tasks. In a work involving the identification of substrate specificities of transporters comparing both word2vec models, SG outstripped CBOW [17]. Also, it was found that the SG model yield better results in semantic similarities of health care words than GloVe [18]. However, no study has comparatively exploited the use of these popular word vectors for the identification of ARGs. In this paper, we first developed vectors of trigrams generated from protein sequences using SG, CBOW and GloVe word embedding. In this paper, we generated vectors of protein sequences using CBOW, SG and GloVe vectorization models. We further comparatively assessed the quality of these vector by visualizing the vectors in space and also by measuring the similarity of pairs of trigrams. The vectors were used as embedding layers in a bidirectional Recurrent Neural Network (RNN) to classify ARGs. After the implementation, three RNN models for identifying ARGs were developed, namely, GloVe-based Antibiotic Resistance Neural Network (GARNN), CBOW-based Antibiotic Resistance Neural Network embedding layer (CARNN), SG-based Antibiotic Resistance Neural Network embedding layer (SGARNN). By employing these embedding models, the unique properties of each the models are explored and leveraged to identify ARGs and enabling a comparative analysis of their performance in ARGs prediction as well.
Word2vec and global vector neural embedding models
Word2vec model for learning the vectors of words is a shallow (one-hidden layer) neural network. This shallow neural embedding can be implemented in two different ways, namely SG and CBOW. The Skip-gram model seeks to predict context words (surrounding words) given a target word with a predefined context window, whereas CBOW does the opposite by attempting to predict the target word based on given context words. The word vector distribution in space is such that, words that are contextually common in the corpus are closely represented together in the vector space. For a given sequence of target words, w1, w2, …wT, the objective function of skip-gram is represented in equation 1 as:
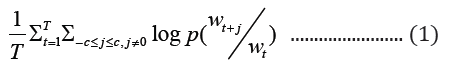
where c is the size of the context window. The aim of skip-gram is to maximize the log probability of the above function. CBOWs on the other hand, predicts the target word based on the context words with objective function as shown below:
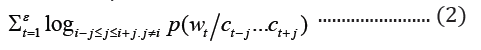
where c1 … ck are the context words, wt is the target word to be predicted and ℇ is the training corpus. In the GloVe word embedding development, first, word-word co-occurrence matrix say X is created from a training corpus, whose Xij indicates the number of times word j occurs in the context of word, i, in the corpus. Also, let Xi=ΣkXik be the total number of times any word co-occurs in the context of word, i, in the corpus. Thus, according to Bayes’ theorem, let Pij=P(i)=Xij/Xi that word j appears in the context of word i, demonstrated that the relatedness of any word k to word i or to word j is distinctively represented by the ratios of the co-occurrence probabilities, rather than the raw probabilities [19]. The resulting model is summarized in the equation below:
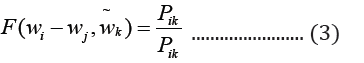
Where wi and wj are word vectors and is the context word vectors. Pik=Xik/Xi is the probability of the word k appearing in the context of the word, i.
The developers of the GloVe word embedding techniques capitalized on two frequently used techniques, global factorization method and local context window method (word2vec). The intuition behind GloVe word embedding is that word vectors are better learnt with the ratios of co-occurrence probabilities rather than the co-occurrence probabilities themselves.
Sequence pre-processing
Protein sequences from UniProt databases were merged to build the word corpus [20]. Overlapping trigrams of the sequences were produced from the corpus and vectorized using SG, CBOW and GloVe models, separately. The three different vectorized corpora; skip-gram, continuous-bag-of-words and Global vectors were saved. A vector dimension for each trigram was set at 200 for the training of each of the three corpora. The context window size and vector dimensions are hyper-parameters that can be tuned in SG, CBOW and GloVe neural word embedding to produce optimal results. Window sizes of ± 3, ± 4, ± 5, were trialed and window size of ± 5 was found apt for all the models and chosen, after their performances on the test dataset (Figure 1).

Figure 1: Prediction mechanisms of the word2vec models. (A): Skip-
gram as demonstrated, predicts the context trigrams given the target
trigram. The target trigram, MSK used as input as one-hot encoding
and the output KSV is predicted also as one-hot encoding; (B):
Continuous-bag-words model predicts the target trigram given context
trigrams. The input trigrams each are input as one-hot, and the
output trigram predicted also as one-hot encoding; 

Preparation of training dataset
Experimentally verified protein sequences of ARGs were obtained from the Comprehensive Antibiotic Resistance Database (CARD) and non-ARGs protein sequences considered as negative dataset were obtained from PathoSystems Resource Integration Center (PATRIC) database [21,22]. Also, Cluster Database at High Identity with Tolerance (CD-HIT) with 90% and 50% identity was used to reduce redundancy in the positive and negative training datasets, respectively [23]. Both ARGs and non-ARGs sequences whose sequence lengths were less than 30 amino acids were also discarded. After the preprocessing, a training set was created consisting of 1000 sequences of ARGs and 1000 Non-ARGs. Protein sequences were sliced as trigrams (3-mers) and each overlapping trigram is considered a word. The vector representations of each resulting trigram were generated separately from the three vectorized corpora using SG, CBOW and GloVe neural embedding models.
Bidirectional long short-term memory recurrent neural network
The embedded-vector representation of each of the trigrams present in the protein sequences considered as a “word” was fed into an RNN as input. To curb the issue of gradient vanishing in recurrent neural networks’ inability to store information over extended temporal distance, we employed nested Long Short- Term Memory (LSTM) in the RNN architecture [24,25]. LSTM RNNs use in genomics has produced good results due to their ability to memorize long sequence information [26]. Nested LSTM cells functions are characterized similarly as of LSTM cells except that the addition operation used in computing the memory cell state, ct is replaced with a learned, stateful function [24].


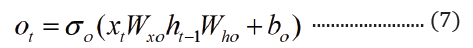
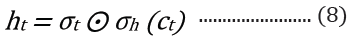
where t is the time step, h is the hidden state vector, xt is the input vector, it is the input gate, ft is the forget gate, ot is the output gate, gt is the input modulation gate, ct is the memory cell state, m is the state of the function at time t, ⊙ is the element-wise multiplication (Figure 2).

Figure 2: A two-layer bidirectional nested Long Short-Term Memory (LSTM) showing the inner and outer LSTM. Note: The output embedding vectors from the inner LSTM are used as input into the outer LSTM.
Models training and evaluation
We explored the context of protein sequences from both backwards and forward states simultaneously by incorporating bidirectional network in the RNN architecture for estimation of the output vector. Summarily, the RNN architecture was made up of two hidden layers of LSTM each fused with 32 LSTM units. The dropout technique was used to randomly remove 50% hidden neurons in both layers. This was done to avoid the problem of overfitting. Adaptive moment estimation optimizer was used in backpropagation to train the rest of the weights. The dataset was trained at 100 epochs and batch size of 32. Both training sequences were padded to lengths of 450. These parameters and techniques were used in training and tuning the hyper-parameters of the models to identify ARGs. Cross-validation approach, where k was set to 10 folds was used in training the models. K-1 folds were used in training and tuning hyper-parameters of the GARNN, SGARNN and CARNN models whereas the remaining fold was used in evaluating the model. The performances of GARNN and SGARNN and CARNN models were evaluated on accuracy, precision, recall and Matthew Correlation Coefficient (MCC). After 10-fold cross validation, the mean values were reported as results ± Standard Deviation (SD). Analysis of Variance ANOVA (SAS, version 16.0, SAS Institute Cary, North Carolina) was used to determine differences in performance at a significance level of p<0.05. The mean differences among the models’ performances were compared using Tukey’s test. Accuracy=(TP+TN)/ (TP+TN+FP+FN), Precision=TP/(TP+FP), Recall=TP/(TP+FN), F1=2*(Precision*Recall)/(Precision+Recall), MCC=(TP × TN-FP× FN)/√((TP+FP)(TP+FN)(TN+FP)(TN+FN)), TP=True Positives, FP=False Positives, TN=True Negatives, FN=False Negatives, MCC= Matthew Correlation Coefficient. The performances of our three models on independent test dataset were compared to four bioinformatic baseline models, namely, BLAST, Resistance Gene Identifier (RGI) and HMMER and fARGene. We also experimented the performance of BLAST using three different percent identity cut-offs of 35%, 50% and 80% (Figure 3).

Figure 3: Diagrammatic illustration of the complete methodology using Bidirectional Long Short-Term Memory (BiLSTM) Recurrent Neural Network (RNN) for the prediction of antibiotic resistance genes. Note: Overlapping trigrams of protein sequences of both antibiotic resistance genes and non-antibiotic resistance genes were created and each trigram was considered as a word. The RNN consists of two layers of bidirectional LSTM each with 32 neurons. Sigmoid activation function was used to predict whether a sequence is a resistance gene or not.
Testing our models and baseline models on independent test set
Known antimicrobial resistance and susceptible genes were obtained from AMRFinder database and PATRIC database, respectively and were used as independent test data set [22,27]. The sequences were aligned against the training samples to make sure the test samples were independent from the training samples using CD-HIT with 90% identity [23]. After processing these sequences, 910 were used as test samples (455 ARGs and 455 non-ARGs). Four baseline models, RGI, HMMER, fARGene and BLAST (BlAST+2.9.0, database version 5) were used as references for the performances of our developed models [21,28- 29]. Antibiotic resistance genes from the CARD database were used to build a local BLAST database and we experimented with three different percent identity cut-offs, 35% (BLAST 35%), 50% (BLAST 50%) and 80% (BLAST 80%) to assign a sequence as an ARG. RGI was also implemented locally and a cut-off of 80% was used to assign a sequence as ARG. HMMER program uses sequences to build profile hidden Markov models to identify sequence homology. With HMMER, we constructed a database from ARGS sequences obtained from the CARD database and subsequently used the pHmmer program to search the database using out test data set as query sequences. An e-value of 0.001 cut-off was used to ascribe a sequence as ARG. We evaluated the performance of all models on the test data set.
Training sequence distribution
The sequence length distribution of both negative and positive training dataset sets is displayed. Protein sequences were sliced as trigrams (3-mers) and each overlapping trigram is considered a word. The vector representations of each resulting trigram were obtained separately from the three vectorized corpora using SG, CBOW and GloVe neural embedding models (Figure 4).

Figure 4: Sequence length distribution of training set. (a): The sequences of the positive training set have a mean, median, mode of 82.28 aa, 295 aa, 210 aa respectively; (b): The negative training set has 82.28 aa, 60 aa, 49 aa as its mean, median and mode respectively.
Intrinsic comparison of SG, CBOW and GloVe word embeddings of protein sequences
The quality of word embeddings is often assessed intrinsically and extrinsically. Word representations are evaluated intrinsically by measuring the semantic or syntactic similarity among words independent of any downstream tasks of the embeddings. Extrinsic evaluation on the other hand tests the quality of the representations using downstream tasks such as sentiment analysis, relation extraction, etc. Here, we intrinsically test the quality of word embeddings developed in this study by measuring the similarity that exists between the vector representations of two trigrams using cosine similarity function. Averagely, trigrams generated by GloVe model exhibited the highest similarity between pairs of trigrams, followed by vectors generated by SG model. The cosine function gives information about the position of the amino acid trigrams in space and was calculated as,
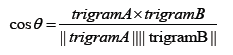
The higher the cosine value, the higher the similarity, and the lower the angle that is between the two trigrams (Table 1). We computationally analyzed the three embeddings using t-distributed Stochastic Neighbor Embedding (t-SNE) [29]. The trigrams of 200 dimensions were projected unto a 2-dimensional space using t-SNE (Figure 5).
| Trigrams (words) | Word2vec | CBOW | GloVe |
|---|---|---|---|
| LLA, LAE | 0.34 | 0.34 | 0.67 |
| DDL, DLL | -0.02 | -0.01 | 0.66 |
| LLA, LLL | 0.51 | 0.52 | 0.74 |
| AED, EDD | 0.29 | 0.27 | 0.53 |
| MRI, RIL | 0.19 | 0.16 | 0.44 |
| ILL, LLL | 0.57 | 0.56 | 0.71 |
| LAE, DLL | 0.31 | 0.27 | 0.38 |
Table 1: Comparison of the cosine similarity of pairs of words from Global Vectors (GloVe), Skip-Gram (SG), Continuous Bag of Words (CBOW) vectors.

Figure 5: T-distributed stochastic neighbor embedding visualization of trigram vectors training set of all three models. (A): Global vectors; (B): Skip-gram; (C): Continuous bag of words. 
Comparison of developed models with baseline models
We compared the performance of the three models we developed on accuracy, recall, precision, F-1 score, MCC scores after 10- fold cross-validation (Figure 6). Among our developed models, GARNN model achieved the highest accuracy, precision, recall, F-1 score, Mathew Correlation Score (MCC). For instance, GARNN achieved an accuracy of 98.55%, followed by SGARNN with an accuracy of 97.8%. It is worth noting that the difference in performance between GARNN and SGARNN is about 1% on all the metrics. Even though GARNN achieved highest performance on all metrics than SGARNN, no significant performance difference (p<0.05) exists among these two models on all metrics, however. CARNN model was the least performing model and its performance was significantly lower than GARNN and SGARNN models on all metrics, except in precision (Figure 6). We further evaluated the performance of our developed models against four baseline models, namely, HMMER, RGI, fARGene and BLAST on the independent test dataset (Table 2). All our developed models outperformed the baseline models, Blast and RGI. Out of the 455 antimicrobial resistance genes, GARNN model was able to identify all except 1 (sensitivity of 99.78%), achieving a probability more than 0.99 on 450 samples. SGARNN was also able to identify 452 (sensitivity of 99.34%) out of the 455. CARNN on the other hand, identified all antimicrobial resistance genes with probabilities more than 0.99, achieving a perfect sensitivity on the test data set. BLAST achieved the lowest sensitivity score among all the models. As the percent identity cut-off decreases, the sensitivity increases, at the expense of precision. At 35% identity cut-off, BLAST could manage 80% sensitivity (364 out of 455) with 70 precisions. At 35% identity cut-off, high false positive rate results were produced by BLAST. BLAST was able to identity all the non-antimicrobial resistance genes at 80% identity cut-off; however, it could only identify less than half of the antimicrobial resistance genes. At the universal cut-off, 50% cut-off, BLAST was able to identify only 54% (246 out of 455) of the resistance genes. RGI was also able to identify about 99% of the non-resistance genes, however, it misclassified about 45 of the antimicrobial resistance genes (10% false negatives). Comparatively, RGI outperformed BLAST on all the metrics. The fARGene model was able to correctly identify all non-antimicrobial resistance genes, i.e., 100% precision [30]. It was able to identify 421 non-antimicrobial resistance genes out of the 455 (recall of 92.53%), which was lower than the recall score of all our models, in terms of recall. It attained an accuracy of 96.26%, only higher than one of our three models, SGARNN model which attained an accuracy of 95.27%. Three different percent identity cut-offs (35, 50, and 80%) in BLAST were experimented with. RGI model was also used at cut-off threshold of 80%, less than the recommended cut-off for clinical surveillance (90%). HMMER with e-value of 0.001 was used to assign a sequence as an antimicrobial resistant. Highest values are in bold for ease of recognition (Table 2).

Figure 6: The mean scores of Global vector-based Antibiotic Resistance Neural Network (GARNN), Continuous bag of words--based Antibiotic
Resistance Neural Network embedding layer (CARNN) and Skip-gram based Antibiotic Resistance Neural Network embedding layer (SGARNN). Note: The Recurrent Neural Network (RNN) with GloVe embedding layer (GARNN) produced the highest accuracy, followed by RNN with Skip-Gram embedding layer (SGARNN) among the models. 
| Accuracy | Recall | Precision | F1-score | Matthew correlation score | |
|---|---|---|---|---|---|
| Models | |||||
| GARNN | 0.9769 | 0.9978 | 0.9578 | 0.9774 | 0.9547 |
| SGARNN | 0.9527 | 0.9934 | 0.915 | 0.9526 | 0.9044 |
| CARNN | 0.9637 | 1 | 0.9324 | 0.965 | 0.9299 |
| BLAST (35%) | 0.73186 | 0.8 | 0.7 | 0.7467 | 0.4681 |
| BLAST (50%) | 0.723 | 0.5429 | 0.8487 | 0.66 | 0.4783 |
| BLAST (80%) | 0.711 | 0.42 | 1 | 0.5815 | 0.5171 |
| RGI | 0.901 | 0.901 | 0.99452 | 0.8903 | 0.8176 |
| HMMER | 0.8945 | 0.7956 | 0.99178 | 0.882927 | 0.8049 |
| fARGene | 0.9626 | 0.9253 | 1 | 0.9612 | 0.9279 |
Table 2: The performance of our models and the four baseline models on independent test set.
Literature does not contain a comparative study of these word vectors as an embedding layer in a recurrent neural network for the prediction of antimicrobial resistance genes. In this paper, three commonly word embedding techniques which are used in diverse areas such as recommender systems, sentimental classifications, etc. were employed as first layers in recurrent neural networks to identify antimicrobial resistance genes. We assessed the quality of the vectors generated by each of the word embedding models, hitherto, using them for the downstream classification of the antimicrobial resistance genes. The quality of the word vectors which were used in the neural network influenced the performance of the models. Also, the embedding models’ hyperparameters such as size of the corpus being trained, vector dimension, context window size in turn influenced the quality of the generated vectors. Contrary to the sterling performance of our three models, the four baseline models performed poorly in their ability to identify antimicrobial resistance gene. Comparatively, the fARGene tool was able to identify antimicrobial resistance genes the most among the baseline models. On the contrary, BLAST produced the worst performance in its ability to predict antimicrobial resistance genes and this result corroborates with an already known evidence [7]. A percent identity cut-off of 80-95 as proposed is appropriate and commonly acceptable to ensure stringency when using best-hit methods [31]. It is important to note that BLAST with 80% identity cut-off and fARGene were able to identify all non-antimicrobial resistance genes (100% precision). CARD’s RGI tool was able to identify more resistance genes than BLAST, but it could not identify as much as our deep learning models. RGI uses homology and single nucleotide polymorphism to predict resistance genes. HMMER like the other baseline models, produced little false positive results (high precision), but could not identify antimicrobial resistance genes much. These models are homology-based models and they are known to misidentify antimicrobial resistance genes and in certain instance produce high false positive rates [27]. It is also hard to build an all-encompassing database since new resistant genes emerge all the time. This may have contributed to the many false negative results produced by all the sequence-similarity models. The three models we developed in this paper were able to correctly identify almost all antimicrobial resistance genes obtained from the AMRFinder database [27]. The performance of the models can be attributed to the use of the embedding layers obtained from vectorization of the protein sequences. Even though all the three models demonstrated comparable performance, deep neural network with Global vectors as an embedding layer produced slightly higher performance on average than the two remaining models. Despite the effort to build a comprehensive corpus, there is the possibility of missing rare vocabularies which could impact the models’ performance on diverse dataset. Additionally, while the bioinformatic tools developed in this paper can contribute to the antimicrobial resistance research, they cannot be used as replacements for formalized laboratory methods. However, they can serve as valuable complementary tools to the traditional methods. The Natural Language Processing Antimicrobial Resistance Gene (NLPARG) tool is a valuable tool addition to the already existing bioinformatics tools for efficiently identifying antimicrobial resistance genes. NLPARG incorporates three diverse models to assist users to compare and evaluate their performance in ARGs prediction. Overall, NLPARG is an easy-to-use tool which can aid in the identification of diverse antimicrobial resistance genes and consequently contribute to the advancement of antimicrobial resistance research.
This paper illustrates the effectiveness of machine learning in identifying ARGs in bacterial sequences. We explored various word embedding techniques to demonstrate the utility and expanding the scope of the usefulness of state-of-the-art technologies in the field bioinformatics. Our findings reveal that our models outperformed the baseline homology-based models used in this paper, even when applied to previously unseen data. The diverse embedding models explored in this study displayed varying levels of performance, with certain of them excelling in specific metrics with some outperforming others some metrics. In particular, the deep learning model with Global vectors embedding layer demonstrated superior overall performance. Among the baseline models, fARGene tool emerged as the best performing method. The result of this study pushed the frontiers of the role that machine learning can play in healthcare, specifically in diagnostics. We also created a user-friendly and publicly available tools for predicting antimicrobial resistance genes based on the three embedding techniques presented in this paper. The tools are intended for academic use and to augment diagnostic processes, not to replace.
Thank you to the computing resources provided by the Computational Molecular Engineering Lab and the ViCAR Center at North Carolina A & T State University.
[Crossref] [Google Scholar] [PubMed]
[Crossref] [Google Scholar] [PubMed]
[Google Scholar] [PubMed]
[Crossref] [Google Scholar] [PubMed]
[Crossref] [Google Scholar] [PubMed]
[Crossref] [Google Scholar] [PubMed]
[Crossref] [Google Scholar] [PubMed]
[Crossref] [Google Scholar] [PubMed]
[Crossref] [Google Scholar] [PubMed]
[Crossref] [Google Scholar] [PubMed]
[Crossref] [Google Scholar] [PubMed]
[Crossref] [Google Scholar] [PubMed]
[Crossref] [Google Scholar] [PubMed]
[Crossref] [Google Scholar] [PubMed]
[Crossref] [Google Scholar] [PubMed]
[Crossref] [Google Scholar] [PubMed]
[Crossref] [Google Scholar] [PubMed]
[Crossref] [Google Scholar] [PubMed]
[Crossref] [Google Scholar] [PubMed]
[Crossref] [Google Scholar] [PubMed]
[Crossref] [Google Scholar] [PubMed]
[Crossref] [Google Scholar] [PubMed]
[Crossref] [Google Scholar] [PubMed]
Citation: Obiri DA, Rhinehardt KL (2023) NLPARG: Comparative Neural Word Embedding Approaches for Antibiotic Resistance Prediction. J Proteomics Bioinform. 16:654.
Received: 06-Nov-2023, Manuscript No. JPB-23-27563; Editor assigned: 08-Nov-2023, Pre QC No. JPB-23-27563 (PQ); Reviewed: 22-Nov-2023, QC No. JPB-23-27563; Revised: 29-Nov-2023, Manuscript No. JPB-23-27563 (R); Published: 06-Dec-2023 , DOI: 10.35248/0974-276X.23.16.654
Copyright: © 2023 Obiri DA et al. This is an open-access article distributed under the terms of the Creative Commons Attribution License, which permits unrestricted use, distribution and reproduction in any medium, provided the original author and source are credited.