Journal of Biomedical Engineering and Medical Devices
Open Access
ISSN: 2475-7586
ISSN: 2475-7586
Research Article - (2017) Volume 2, Issue 2
Keywords: ECG signal; Algorithms; Interference; Suppression
Cardiovascular diseases are the leading cause of death of the population in many developed countries, so the diagnosis and treatment of these diseases is a strategic direction of health care. The most common method of research of the cardiovascular system, is electrocardiography (ECG), widely apply the automatic processing and analysis of ECG signals. The enhance reliability of automatic conclusions in systems ECG diagnostics improve the efficiency and availability of cardiovascular care.
One of the most important requirements to systems ECG diagnostics is to ensure an acceptable quality for their automatic ECG signals interpretation. Retrieving diagnostic information from the ECG signals is a serious scientific problem. This is due to the origin, transformation and analysis of ECG signals. ECG signals are nonstationary signals with repeating structured informative sections. The ECG heart condition is estimated on the basis, focused on these informative sites. The shape and parameters of the informative sections of ECG signals are diverse, variable and not always predictable.
In addition, when registration ECG signals there are many interference is different type and origin, which are particularly strong in a patient free activity. There is no doubt that the interference is the main reason for the decline in the reliability of automatic conclusions systems ECG diagnostics.
The principal feature of the development of systems ECG diagnostics is the fact that the registration and processing of ECG signals do not have the full amount of a priori information about signal and noise properties, i.e., the a priori uncertainty of signal interference environment (SIE). This uncertainty is due to no stationary behavior of the useful signal and noise.
Traditionally, the interference in electrocardiography are divided into the following types:
− high-frequency noise of the electrodes (electrode contact noise) and electronic components (instrumentations noise);
− interference caused by the activity of individual muscles (muscle noise);
− pickup industrial network (power line interference);
− disturbances of motion (motion artifacts),
− related to skin deformation and changes in skin potential;
− drift contour (base line drift)-low-frequency noise associated with the polarization of the electrodes, the influence of breath, change in skin-electrode potentials and inter-electrode impedance.
However, several types of interference can be observed simultaneously and independently distort the ECG signals. The resulting interference, in general, has a random, unknown a priori frequency spectrum overlapping with the spectrum of the useful ECG signals, so its removal without distortion of the desired signal is a serious problem. The use of linear frequency filters leads to significant distortions of useful ECG signals, which is unacceptable for most modern electrocardiographic tasks. These distortions associated with decreasing amplitudes Q, R, S teeth extension QRS complex, ST segment offset.
Consider some of the ways of solving the problem of interference suppression in the ECG signals. We represent the recorded ECG signals in the form of an additive model:
where x(t)-a useful component of the signal, e(t)-the noise component, u(t)-the low-frequency component (base line drift).
High-frequency (HF) and low frequency (LF) interference is advisable to eliminate by the different methods. HF interference is eliminated by the methods of nonlinear robust filtering procedures, and LF interference is eliminated by the methods based on the reconstruction (estimation) interference on the reference points and then subtracting it from the input signal.
Locally adaptive filtering
Variety SIE option requires the use of multiple filters to suppress interference in the ECG signals, as there are no universal procedures effectively suppresses interference in any situation. This raises questions about the choice of specific filters and the way of their union. Most often used series connection of several filters, each designed for specific interference suppression, and this based on the assumption that all kinds of interference are present simultaneously. This assumption is not always justified, as the ECG signals passing through several successive filters greatly distorted. More effective filters connected in parallel, but the combination does not guarantee a minimum useful signal on specific local areas. The solution is to use a locally-adaptive filtering, i.e., adaptive selection of the individual filters and settings on local signal areas in accordance with the SIE on these sites ECG signals [1].
The use of non-linear filters
The prospects of the use of non-linear filters for interference suppression in ECG signals showed in [2,3]. In addition, in recent years, there are works devoted to clarify the interference models, the use for these non-Gaussian distributions, the development of methods to eliminate abnormal samples and impulse interference [4].
One of the requirements to the choice of algorithms for interference suppression in the ECG signals is to use robust procedures, capable of providing an acceptable quality of processing in conditions of variation of signal / interference environment, no stationary characteristics of the information component of ECG signals and interference, as well as in cases of deviation of the assumptions made about the changes in the signal model and interference from the real situation [5]. Nonlinear procedures based on order statistics (rank filters) are of particuar interest for processing ECG signals. Nonlinear procedures based on Ordinal statistics (rank filters) are of particular interest for processing ECG signals. Ranking procedure converts the input ECG signals in the sequence of integers - ranks, depending on the relative level of reference among all the observed set of samples. The ranks have many useful properties for practical use, and the theory of rank procedures developed more deeply in comparison with the non-parametric methods of other classes, and in the best way prepared for the practical implementation [6].
The formation of interference estimate
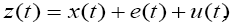
Although of ECG signals have a characteristic structure, a model of the desired signal is usually not known, therefore when creating algorithms of interference suppression are not suitable methods based on the finding of similarity with a reference signal (model). In this situation it is better to build the algorithm so as to obtain information about the properties of the interference, and then use this information to create procedures to ensure effective interference suppression. In other words, the formation of the interference estimate or training (reference) sample interference is a prerequisite for overcoming the SIE priori uncertainty. The interference estimate may be used to select the appropriate filter and / or to change its configuration parameters, as well as to determine the threshold of detection elements of ECG signals. Procedure for forming interference assessment is the most informative and convenient in the absence of the desired signal. The structure of the of ECG signals and advanced signal processing algorithms in most cases allow you to split the signal to informative and uninformative temporary sites even in the presence of intense interference to. Allocation of uninformative sites of ECG signals, in which there is only interference, allows to form an estimate of the interference in the absence of the desired signal and use this assessment to improve the efficiency of interference suppression. Segmentation procedures-division of the signal into time plots with similar characteristics, detection and allocation of informative or, conversely, non-informative sites-have a special place in the temporary processing ECG signals. The basis of segmentation is to identify QRS complexes on the background interference. This procedure is essential for ECG signals analysis algorithms in general. Example segmentation ECG signals fragment shown in Figure 1. Thus, for the implementation of interference cancellation technology ECG signals must develop an algorithm for detection of QRS-complexes segmentation algorithm ECG signals, locally adaptive filtering algorithm, the reconstruction algorithm isoline drift. Consider these algorithms.

Figure 1: The result of segmentation of ECG signals fragment.
QRS complexes detection algorithm: RS complexes detection algorithm is based on the ranking procedure MSM (MaxSubMin), performed in a sliding window. MSM procedure is to perform three sequential steps:
− finding the maximum value of a discrete reference ECG signal in a sliding size 2s+1 window;
− finding the minimum value of the discrete reference ECG signal in a sliding size 2s+1 window;
− subtracting the minimum value from the maximum value.
Formally MSM procedure is written as follows:
MSM procedure has a number of useful properties that allow its use for the detection of QRS complexes of ECG signals:
− at the exit procedures, regardless of QRS complexes are formed only positive impulses;
− the procedure has filtering properties, depending on the size of the window, so the pre-processing ECG signals are not required;
− the integration of the signal in a sliding window to exit MSM procedure provides a single pulse of a positive, corresponding to the QRS complexes ECG signals.
Thus, MSM QRS complex detection algorithm consists in the following steps:
− MSM procedure in a sliding window;
− integration with MSM output signal in a sliding window;
− comparing the result with a threshold and a maximum single pulse search in the area over the limit.
The algorithm detects QRS complexes ECG signals at a sufficiently high intensity of interference of various types and forms of variability QRS complexes.
Segmentation algorithm ECG signals: As a rule, the actual ECG signals are no clear boundaries between the informative elements, variability of informative parameters of ECG signals is very high, so the automatic segmentation of ECG signals in the time domain is difficult [7]. The distorting effect of interference makes the recognition of the informative elements of ECG signals and their borders even more difficult. Applying interference cancellation algorithms in these cases does not always give a positive result. In resulting “inadequate” filtering is formed fuzzier bound between the boundary elements informative signal.
It is advisable go from a one-dimensional signal to a twodimensional signal to improve the accuracy of segmentation ECG signals. One of the variants such a transition is to build along a onedimensional signal, its phase trajectory in the phase plane. The phase space is used in physics and applied mathematics for studying the behavior of a dynamic system. The set of all states of the dynamic system represented in phase space so, that each possible state of a dynamic system corresponds to a point in this space. This space is called the phase space, its coordinates-phase coordinates, and the family of phase trajectories, representing all of the changes, consisting of the system,- phase portrait. If the system is described by two variables, the phase space is the plane on which the axes of the deposited values of these variables.
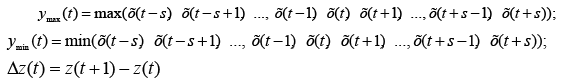
The authors have developed ECG signals segmentation algorithm. It constructs and analyses of the phase trajectory (FT) cardiac cycle in the coordinate’s z(t) and Δz(t), where Δz(t) = z(t +1) − z(t) . Area ECG signal and the corresponding phase trajectory is shown in Figure 2. Detection of QRS complexes allows selecting R-R intervals and cardiac cycle. Plot FT corresponding to QRS complex, is a large-sized loop with long intervals between points (values of adjacent sampled). It is always pronounced, regardless of shape and amplitude QRS complex. This is due to the high rate of change of ECG signals in this area.

Figure 2: Detail of ECG signals with selected elements and the corresponding phase trajectory.
The authors suggest the following steps for analyzing ECG signals FT and selection of samples belonging to the loop of the QRS complex:
1. Each sample is characterized by three features:
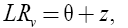
LZ-Euclidean distance from the reference value v by FT to the origin: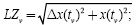 LP-Euclidean distance between the values of adjacent samples in the FT:
LR-the distance from the reference frame v θ (the peak of the R wave in the ECG signals):
if the count of v is to the left of the reference θ, and
if the count of v is to the right of the frame;
where z is the number of discrete samples between the count of θ and the count of v, v=1 ... N (N-number of discrete samples in the study of the cardiac cycle).
For LR and LP features introduced weights kP and kR, respectively. Each sample vL, located to the left of the reference θ (peak wave R), is given by:
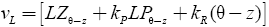 and generates a feature vector SL samples to the left of the reference θ.
Each sample vR, the right of the reference θ (peak wave R), is given by:  and generates a feature vector SR samples θ to the right of reference θ.
Sample of the minimum value of vL corresponds to the beginning of the QRS complex: 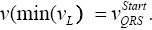
Sample of the minimum value vR corresponds to the end of the QRS complex: 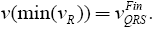
A similar analysis cardiocycle FT plots carried out to the left (to highlight the P-wave) and on the right (to highlight the T-wave) of the selected QRS complex to highlight samples corresponding to waves P and T. Defining the boundaries of waves P, T and QRS complex allows splitting ECG signals on informative and uninformative sites.
Presentation of ECG signals in the form of a phase trajectory can simultaneously evaluate the amplitude and speed parameters of the signal, which gives the possibility of increasing the reliability and accuracy of the segmentation. The algorithm provides a segmentation of ECG signals, regardless of variations in its parameters and QRS form of complexes, as well as the impact of low-frequency noise [8].
Algorithm locally adaptive filtering: Allocation of informative complexes and waves ECG signals allows to select area uninformative ECG signals and to implement the algorithm locally adaptive filtering consists in the formation of the interference estimate, choice of filter for the local area in accordance with a predetermined criterion of efficiency, the filtering of this site, restoring the ECG signals [1]. Formation of interference estimate is to determine the degree of deviation of the distribution of interference samples from a Gaussian distribution. The criterion of deviation of the distribution of interference samples from a Gaussian distribution law chosen robust coefficient (RC) ECG signals, proposed by R. Suoranta in his dissertation [9]:
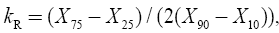
where Xw denotes w-th percentile of the sample.
Percentages may be replaced by the corresponding order statistics samples in the sample to sample interference in 100 samples:

where  the value of w-th point in the ranked list of 100 order statistics samples.
Interference in the selection of 100 samples (at the sample rate of ECG signals fd=500 counts per second) is 200 ms, which is less than the actual duration of the TP segment. The authors have obtained values kR for various models of interference, for example, for the interference samples with a Gaussian distribution, kR equal 0.26. The robust coefficient kR of ECG signals decreases for samples having distribution with «heavy tails» (heavy-tailed distribution). Different values kR for a variety of ECG signals allows relating the studied interference with one of the models of interference. An infinite set SIE divided into several subsets when choosing a filter. The filter is chosen in advance for each of the subsets according to the criterion of efficiency for this local area ECG signals. Restoration of ECG signals is carried out by connection with a new filter treated plot ECG signals to the preceding section, taking into account boundary conditions.
Reconstruction algorithm isoline drift: Reconstruction Algorithm isoline drift is based on the allocation of points TP-segments and the approximation of the reduced area contours using Weibull-Gnedenko:
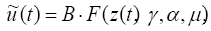
where B-reduction coefficient equal to the observation interval length; 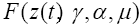 -Distribution of points TP-segments; γ, α, μ-distribution parameters (γ-forms of distribution parameter, α-scale parameter, μ-the offset).
Parameters of the distribution points TP segments are determined based on the choice of forms of distribution from the known value of the entropy potential distribution and evaluation factor [10]. Statistical information and valuation uncertainty distribution of control points TP segment is calculated for it. Evaluation of statistical uncertainty is defined as the standard deviation σTP of the positions of the points TP segment relative to their average values. The authors propose a method for eliminating the drift contours ECG signals, based on the allocation and statistical processing control points on the TP-segment. Drift contours ECG signals is subtracted from the initial ECG signals. The process of eliminating drift contours ECG signals is iterative in the proposed method. Drift contours ECG signals measured after subtraction and, in case of failure terms of eliminating drift contours ECG signals, the action on the allocation, statistical processing of reference points on the TP-segment reconstruction drift contours ECG signals and subtracting it from the original ECG signals are repeated.
Structure of the interference suppression subsystem: Combining the developed algorithms will create interference suppression subsystem for systems ECG Diagnostics. Detection of QRS complexes allows for segmentation, i.e., divide the ECG signals on the area. The interference estimate on the TP segment is considered to be relevant for the assessment of interference cardiocycles. The structure of interference suppression subsystem is shown in Figure 3.

Figure 3: Structure of the interference suppression subsystem.
As follows from the analysis of Figure 3 the filter is selected in accordance with the evaluation and phase interference type ECG signals (P, QRS, ST, T, TP,). Restoration of ECG signals is filtered sequentially joining from local areas of interference with the boundary conditions.
Blocks introduced into the circuit to eliminate the isoline drift. These blocks implement the definition of reference points, estimate isoline drift, and subtracting the drift evaluation from the reconstructed signal. Determination unit allows selecting an array of points on each TP segment. According to the found reference points reconstructed drift; this is subtracted from the signal output from the recovery unit ECG signals. Developed subsystem interference suppression, illustrates the new interference suppression technology in ECG signals. Software implementation of this subsystem has a low computational complexity that allows to process ECG signals in real time.
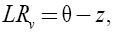
Examples of the formation of MSM procedure of monopoles signal and subsequent integration into the sliding window are shown in Figure 4. The blue line represents the input ECG signals, and the red line represents a monopoles signal. Monopoles signal can uniquely detect the QRS complexes in all four cases (ECG signals with highamplitude T wave, ECG signals with the drift of isoline, ECG signals from motion artifacts, ECG signals with negative QRS complexes).

Figure 4: Formation monopoles signal based on MSM procedure.
In Figure 4 Procedure window size MSM is 11 Counts (s=5), The size of the integration window 21 Countdown (For the sample rate ECG signals fd=500 Counts per second).
Figure 4 procedure MSM window size is 11 samples (s=5), the size of the integration window 21 samples (frequency for sampling ECG signals fd=500 samples per second).
Testing of the developed algorithm to detect signals from the MIT-BIH Arrhythmia Database showed that the probability of correct detection of QRS complexes of ECG SIGNALS (sensitivity), even without pre-filtering is 0,97-0,98. Application of the procedure MSM “hard” filtering with a bandwidth of 2-30 Hz and the introduction of adaptive threshold increases the probability of correct detection of QRS complexes to 0.99 (when tested on the same signal). The use of individual local sections filters ECG signals in accordance with the kind of interference, local area and the type of ECG signals efficiency criterion reduces distortion informative ECG signals portions by 10- 12% compared to the use of any single filter.
The study developed a new technology of interference suppression in the ECG signals based on the locally adaptive filtering ECG signals to suppress RF interference and reconstruction CI by statistical processing of array of points corresponding TP segments of ECG signals.