
Immunotherapy: Open Access
Open Access
ISSN: 2471-9552

ISSN: 2471-9552
Research Article - (2022)Volume 8, Issue 4
Aims: Examine GTSE1 expression and function in renal clear cell carcinoma, as well as the nc-RNA that is upstream of GTSE1 .
Methods: The Cancer Genome Atlas (TCGA) provided clinical and RNA-seq data for ccRCC patients, and the expression of GTSE1 , its connection with clinical data, prognosis and tumor immune infiltration, and prediction of upstream noncoding RNAs (nc-RNAs) of GESE1 were analyzed using R language and public tumor databases.
Results: In ccRCC, GTSE1 is highly expressed and is linked to a high clinical stage and a poor prognosis. In ccRCC, the PVT1/has-mir-23b-3p/ GTSE1 axis has been identified as the most likely upstream ncRNA related route of GTSE1 . Furthermore, GTSE1 expression was linked to tumor immune cell infiltration, immune cell biomarker expression, and immunological checkpoint expression.
Conclusion: Upregulation of GTSE1 by ncRNA is linked to poor prognosis and ccRCC tumor immune infiltration. GTSE1 has the potential to be a useful predictive biomarker as well as a therapeutic target.
GTSE1 ; Prognosis; Non-coding RNA; Gene expression; Cancer
The most frequent kind of renal carcinoma is clear cell Renal Cell Carcinoma (ccRCC), which accounts for almost 90% of all renal cell cancer [1,2]. ccRCC is a cancer that is aggressive and has a high risk of metastasis [3,4]. Approximately one-third of patients had metastasized at the time of diagnosis, and the remaining one-third may do so in the future [5,6]. Because ccRCC is resistant to radiation and chemotherapy [7,8], targeted therapy and immunotherapy are the current therapeutic options. As a result, finding effective treatment targets or promising prognostic indicators for ccRCC is critical.
GTSE1 is mostly found in the cytoplasm and is expressed only during the G2 and S phases of the cell cycle [9], and it is associated with the activity of cytoplasmic tubulin and microtubules during mitosis [10] 10. During mitosis, it is a crucial regulator of chromosomal mobility and spindle integrity [11]. The overexpression of GETE1 has been linked to a variety of malignancies. The introduction of p53 into the cytoplasm and participation in the control of FoxM1/CCNB1 expression, which is positively linked with tumor recurrence and lymph node infiltration, may mediate the overexpression of GTSE1 in bladder cancer [12]. The elevated expression of GTSE1 in Hepato-Cellular Carcinoma (HCC) is directly linked to the migration and invasion produced by the regulation of superior dermal Epithelial-to-Mesenchymal Transition (EMT), and may considerably impair chemotherapy efficacy and decrease the survival rate of HCC patients [13]. In gastric cancer cells, GTSE1 inhibits p53 apoptotic signal transduction, which can interfere with the impact of cisplatin [14]. Furthermore, GTSE1 expression was shown to be considerably higher in triple negative breast cancer and p53 mutant breast cancer cell lines, and was linked to histological grade and a bad prognosis [15].However, detailed study on the expression, prognosis, and regulatory mechanisms of GTSE1 in ccRCC are still lacking. Furthermore, no link between GTSE1 and tumor immune infiltration in ccRCC has been shown.
The administration and mining of a vast number of biological data has become crucial in cancer research due to the rapid development of high-throughput detection technologies and the accumulation of tumor-related data [16]. The TCGA, GPS, ICGC, and other databases include a vast amount of publicly available tumor data, which may be used to find new tumor biology markers and therapeutic targets [17,18]. Using bioinformatics to explore possible treatment targets that will help patients with renal clear cell carcinoma live longer. We investigated the expression and survival of GTSE1 in renal clear cell carcinoma using the public tumor database, as well as the associated regulation of non-coding RNA (ncRNA) and the link between GTSE1 and tumor immunity. Finally, our findings imply that GTSE1 overexpression mediated by ncRNAs is linked to poor prognosis and tumor immune infiltration in patients with ccRCC.
Datasets
The RNA-seq data (HTSeq-FPKM) was obtained from the TCGA database [19] (https://portal.gdc.cancer.gov/). Patients with missing clinicopathological characteristics were eliminated, leaving 530 ccRCC samples and 72 normal samples. For additional investigation, gene expression data from GSE53757 and GSE40435 were also retrieved. GSE53757 [20] is from the GPL570 platform ([HG-U133_ plus_2] Affymetrix human genome U133 plus 2.0 array), while GSE40435 [21] is from the GPL10558 platform (Illumina HumanHT-12 V4.0 expression beadchip). There are 72 and 101 normal samples and 72 and 101 ccRCC samples in each of the two data sets. The R language's "limma" package was used to investigate the differential expression of the target gene in tumor and neighboring normal tissues.
Database analysis
UALCAN: UALCAN (http://ualcan.path.uab.edu/index.html) is a website that provides information on the University of Alabama at It is a network resource that is comprehensive, user-friendly, and interactive. It now offers protein expression analysis choices based on the clinical proteomics tumor analysis Alliance's data (cptac). The ualcan database was used to assess the protein expression level of GTSE1 in ccRCC [22].
cBioPortal for cancer genomics: cBioPortal for Cancer Genomics http://www.cbioportal.org/. It is a multimodal cancer genomics open platform that provides free data on over 5,000 tumor samples from 20 oncology research to far, contains 5 published tumor data to date, 15 TCGA-provided data. Here, the data set of ccRCC (TCGA, firehose Legacy) was selected for further analysis of GTSE1 [23].
Starbase: It's a repository for miRNA, mRNA, lncRNA, and other relevant studies. To predict the miRNA upstream of GTSE1 , applications such as PITA, RNA22, miRmap, microT, miRanda, Pictar, and TargetScan are used, and only the projected miRNA that occurs in the above two or more programs is included for further investigation. The expression correlation of miRNA- GTSE1 was further investigated using these predicted miRNAs as potential miRNAs for GTSE1 . The final study includes potential miRNAs with a negative association. The target miRNA also predicted the parallel expression of upstream lncRNA, and the analysis included lncRNA with a negative association. Starbase also looked at the levels of miRNA expression in ccRCC and normal controls, the relationship between miRNA and prognosis of ccRCC was also studied on this website [24-26].
GEPIA: It's a network tool for analyzing and interactively analyzing cancer and normal gene expression profiles based on TCGA and Genotype Tissue Expression (GTEX) data. The expression correlation between GTSE1 and immunological checkpoints in ccRCC was assessed using the GEPIA database|R|>0.1 and P value 0.05 were used to define statistically significant selection criterion. This website also looked at the expression of lncRNA in ccRCC and the link between GTSE1 , lncRNA, and the prognosis of ccRCC.
TIMER: It is a web server that allows for a thorough examination of tumor-infiltrating immune cells. Timer may be used to examine target gene expression in normal and malignant tissues of various malignancies, as well as the relationship between GTSE1 expression and immune cell infiltration or immune checkpoint expression in ccRCC.
Statistical analysis
The expression level of GTSE1 in ccRCC tissues was compared to that in normal kidney samples using the Wilcoxon signed rank test. To investigate the relationship between clinicopathological characteristics and GTSE1 , the Wilcoxon signed rank test, Kruskal Wallis test, logistic regression, and/or chi square test were utilized. Based on the median value of gene expression, all patients were divided into high and low expression subgroups. The effect of GTSE1 on overall survival of ccRCC patients was assessed using a Kaplan Meier survival analysis and a log rank test. To find independent predictive markers, researchers used univariate Cox regression and multivariate Cox analysis. R 3.6.1 software was used to conduct all statistical analyses. Other information is calculated automatically by the above-mentioned web database. P-value<0.05 or log grade p value<0.05 was considered statistically significant.
GTSE1 is substantially expressed in ccRCC
We discovered that GTSE1 was strongly expressed in most malignancies, including ccRCC, using the timer database (Figure 1A). TCGA, GSE53757, and GSE40435 transcriptome data revealed that GTSE1 in ccRCC tissues was considerably greater than in nearby normal tissues (Figures 1B-1D). Furthermore, as compared to normal controls, the UALCAN database revealed that GTSE1 was substantially expressed in ccRCC samples at the protein level (Figure 1E).
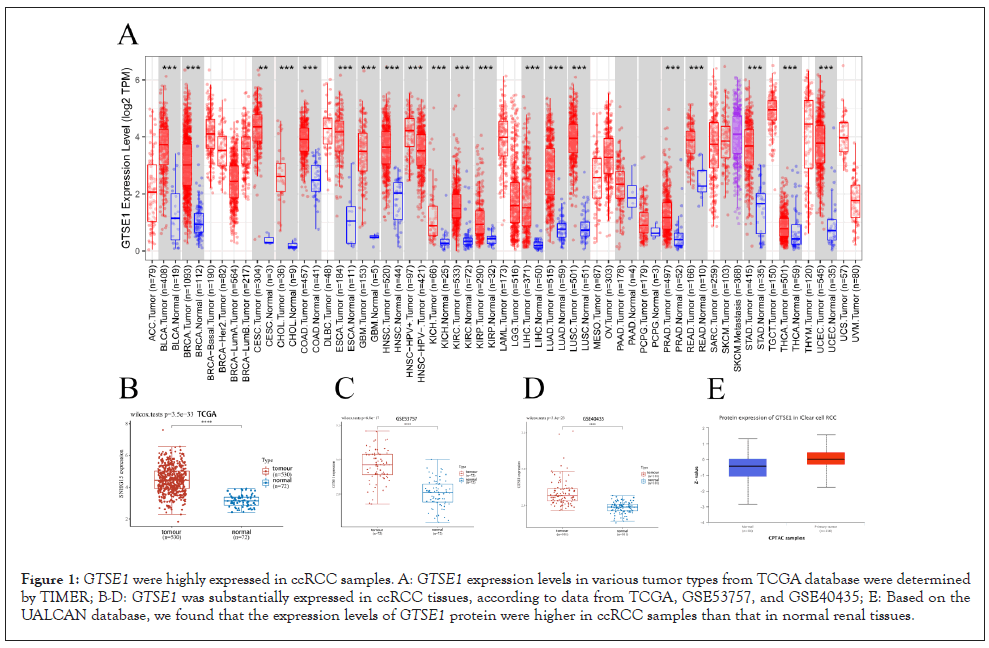
Figure 1: GTSE1 were highly expressed in ccRCC samples. A: GTSE1 expression levels in various tumor types from TCGA database were determined by TIMER; B-D: GTSE1 was substantially expressed in ccRCC tissues, according to data from TCGA, GSE53757, and GSE40435; E: Based on the UALCAN database, we found that the expression levels of GTSE1 protein were higher in ccRCC samples than that in normal renal tissues.
Overexpression of GTSE1 was shown to be associated with advanced clinicopathological characteristics
We discovered no statistically significant difference in GTSE1 expression in patients with different ages (Figure 2A), but there were significant difference in different gender and high TNM, histological grade, or clinical stage of ccRCC (Figures 2B-2G). GTSE1 overexpression was found to be significantly associated with pathologic stage (stage III vs stage I OR=1.95, P<0.01; stage IV vs stage I OR=4.896, P<0.001), histologic Grade (Grade 4 vs Grade 1=7.368, P 0.01); T classification (T3 vs. T1 OR=2.875, P<0.001; T4 vs. T1 OR=2.788, P=0.011); N classification (N1 vs. N0 OR=15.126 P<0.001); and M classification (M1 vs. M0 OR=2.436, p<0.001) (Table 1). The high expression of GTSE1 was connected to histological grade (p<0.001), TNM stage (p<0.01), and pathologic stage (p<0.001), according to chi square test analysis (Table 2).
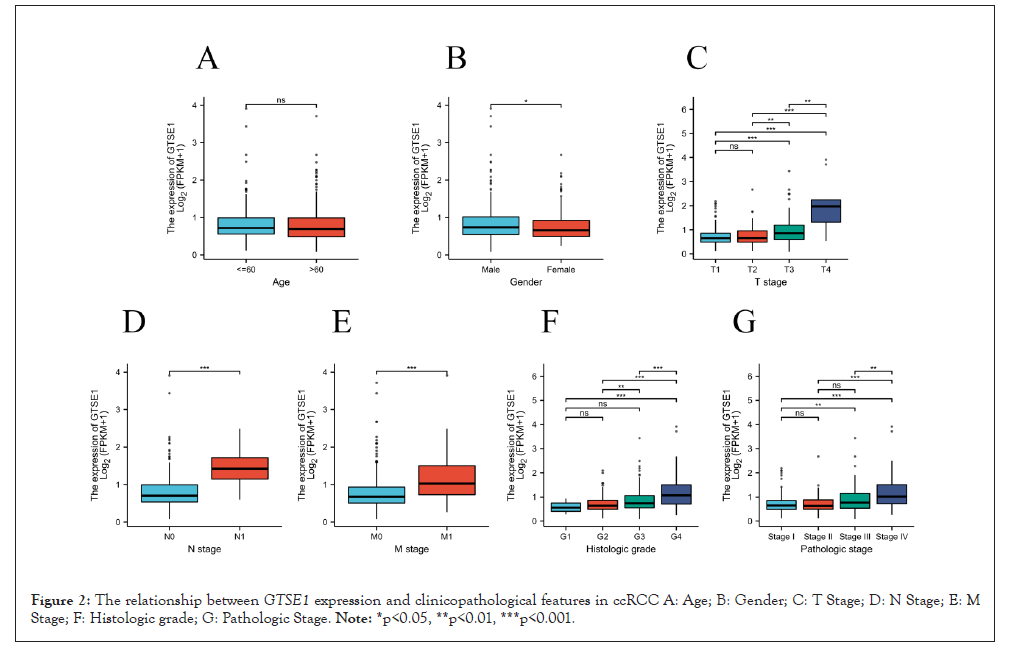
Figure 2: The relationship between GTSE1 expression and clinicopathological features in ccRCC A: Age; B: Gender; C: T Stage; D: N Stage; E: M Stage; F: Histologic grade; G: Pathologic Stage. Note: *p<0.05, **p<0.01, ***p<0.001.
| Clinical parameters | Odds ratio in GTSE1 | OR.95L | OR.95H | P-value |
|---|---|---|---|---|
| Age | ||||
| <60 vs. ≥ 60 | 0.941 | 0.669 | 1.323 | 0.728 |
| Gender | ||||
| Gender (Male vs Female) | 1.442 | 1.008 | 2.067 | 0.046 |
| pathologic_stage | ||||
| Stage2 vs stage1 | 0.928 | 0.51 | 1.659 | 0.803 |
| Stage3 vs stage1 | 1.95 | 1.267 | 3.017 | 0.003 |
| Stage4 vs stage1 | 4.896 | 2.821 | 8.841 | <0.001 |
| Histologic grade | ||||
| Grade2 vs Grade1 | 1.642 | 0.532 | 6.132 | 0.414 |
| Grade3 vs Grade1 | 2.979 | 0.962 | 11.14 | 0.073 |
| Grade4 vs Grade1 | 7.368 | 2.193 | 29.483 | 0.002 |
| T | ||||
| T2 vs. T1 | 1.015 | 0.588 | 1.732 | 0.957 |
| T3 vs. T1 | 2.875 | 1.947 | 4.278 | <0.001 |
| T4 vs. T1 | 14.862 | 2.788 | 274.722 | 0.011 |
| M | ||||
| M1 vs. M0 | 4.22 | 2.436 | 7.678 | <0.001 |
| N | ||||
| N1 vs. NO | 15.126 | 2.993 | 275.691 | 0.009 |
Table 1: The relationship between GTSE1 expression and clinicopathological features in ccRCC (Logistic Regression Analysis).
| Characteristics | Type | Total | High expression | Low expression | Chi square | p-value |
|---|---|---|---|---|---|---|
| Age | >60 | 266(50.19%) | 130 (24.5%) | 134 (25.3%) | 0.07 | 0.794 |
| ≤ 60 | 264(49.81%) | 135 (25.5%) | 131 (24.7%) | |||
| Gender | female | 186(35.09%) | 104 (19.6%) | 82 (15.5%) | 3.65 | 0.056 |
| male | 344(64.91%) | 161 (30.4%) | 183 (34.5%) | |||
| Histologic grade | G1 | 14(2.68%) | 10 (1.9%) | 4 (0.8%) | 32.12 | <0.001 |
| G2 | 227(43.49%) | 137 (26.2%) | 90 (17.2%) | - | ||
| G3 | 206(39.46%) | 94 (18%) | 112 (21.5%) | |||
| G4 | 75(14.37%) | 19 (3.6%) | 56 (10.7%) | |||
| Pathologic stage | Stage1 | 265(50.28%) | 158 (30%) | 107 (20.3%) | 38.72 | <0.001 |
| Stage2 | 57(10.82%) | 35 (6.6%) | 22 (4.2%) | - | ||
| Stage3 | 123(23.34%) | 53 (10.1%) | 70 (13.3%) | |||
| Stage4 | 82(15.56%) | 19 (3.6%) | 63 (12%) | |||
| T | T1 | 271(51.13%) | 162 (30.6%) | 109 (20.6%) | 38.33 | <0.001 |
| T2 | 69(13.02%) | 41 (7.7%) | 28 (5.3%) | - | ||
| T3 | 179(33.77%) | 61 (11.5%) | 118 (22.3%) | |||
| T4 | 11(2.08%) | 1 (0.2%) | 10 (1.9%) | |||
| N | N0 | 239(93.73%) | 120 (47.1%) | 119 (46.7%) | 9.93 | 0.002 |
| N1 | 16(6.27%) | 1 (0.4%) | 15 (5.9%) | - | ||
| M | M0 | 420(84.34%) | 227 (45.6%) | 193 (38.8%) | 26.11 | <0.001 |
| M1 | 78(15.66%) | 17 (3.4%) | 61 (12.2%) | - | ||
Table 2: The relationship between GTSE1 expression and clinicopathological features in ccRCC (Chi-Square Test).
Survival outcome and Cox regression analysis
All patients were split into low and high subgroups based on the median expression value of GTSE1 . The predictive value of GTSE1 in patients with ccRCC was evaluated using Kaplan- Meier survival analysis, and a ROC curve was created. The results revealed that patients in the GTSE1 high expression subgroup had a worse overall survival rate than those in the low expression subgroup (P<0.001) (Figures 3A and 3B). Because of the significant number of patients with missing N stage and M stage data in the database, we omitted N stage patients from the analysis and deleted patients with missing M stage data to minimize statistical bias. GTSE1 overexpression was strongly related with poor prognosis (HR=2.027, p0.001), according to the findings of cox regression analysis. Other clinical characteristics, such as age, histological grade, clinical stage, T stage, and M stage, were also shown to be associated with a poor prognosis (all P<0.001). GTSE1 expression (p=0.014), age (P=0.001), histological grade (P=0.013), pathologic stage (P<0.05), and distant metastasis (P<0.001) were all shown to be independent variables impacting OS values in multivariate Cox regression analysis (Table 3).
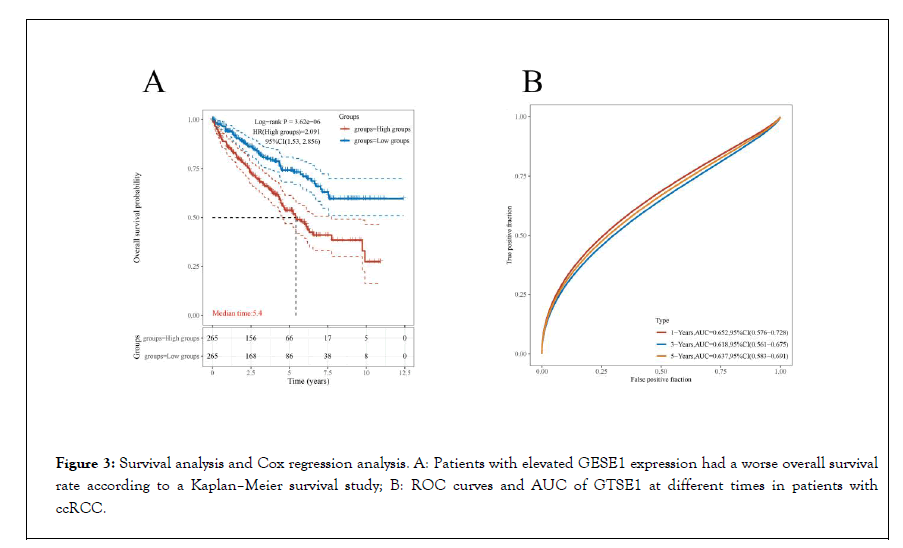
Figure 3: Survival analysis and Cox regression analysis. A: Patients with elevated GESE1 expression had a worse overall survival rate according to a Kaplan–Meier survival study; B: ROC curves and AUC of GTSE1 at different times in patients with ccRCC.
| Variables | Univariate cox regression | Multivariate cox regression | ||||||
|---|---|---|---|---|---|---|---|---|
| HR | HR.95L | HR.95H | p-value | HR | HR.95L | HR.95H | p-value | |
| Age | 1.841 | 1.35 | 2.511 | *** | 1.7 | 1.239 | 2.332 | 0.001 |
| (>60 vs. ≤ 60) | ||||||||
| gender | 1.195 | 0.872 | 1.638 | 0.268 | 1.131 | 0.819 | 1.561 | 0.445 |
| (Male vs female) | ||||||||
| Histologic grade | 2.291 | 1.621 | 3.238 | *** | 1.592 | 1.103 | 2.298 | 0.013 |
| (G3/G4 vs. G1/G2) | ||||||||
| Pathologic stage | 3.226 | 2.329 | 4.468 | *** | 2.148 | 1.042 | 4.424 | 0.038 |
| (III/IV vs. I/II) | ||||||||
| T | 2.689 | 1.967 | 3.676 | *** | 0.868 | 0.462 | 1.63 | 0.648 |
| (T3/T4 vs. T1/T2) | ||||||||
| M | 3.584 | 2.589 | 4.963 | *** | 2.217 | 1.497 | 3.281 | *** |
| (M1 vs. M0) | ||||||||
| GTSE1 | 2.24 | 1.627 | 3.084 | *** | 1.529 | 1.088 | 2.15 | 0.014 |
| (High vs Low) | ||||||||
| Note: ***p<0.001. | ||||||||
Table 3: Univariate and multifactorial cox regression analysis between clinicopathological features and survival in ccRCC (date from TCGA).
MicroRNA prediction
The role of noncoding RNA (ncRNA) in gene expression control is well understood. To see if any ncRNAs influence GTSE1 , we first hypothesized that the upstream miRNA may bind to GTSE1 and then detected 14 miRNAs. miRNA is negatively linked with GTSE1 based on its action mechanism in the control of target gene expression. As a result, an expression correlation analysis was performed. As the Table 4 shown that GTSE1 is strongly negatively linked with hsa-mir-23b-3p, hsa-mir-338-3p, and hsa-mir-532-3p, whereas the other four miRNAs have no statistical expression association (Table 4). Finally, the expression of hsa-mir-23b-3p, hsa- mir-338-3p, and hsa-mir-532-3p in ccRCC was determined, as well as their predictive values (Figures 4A-4E). The same as the number. Only hsa-mir-23b-3p and hsa-mir-532-3p are considerably lowered in ccRCC, and only hsa-mir-23b-3p is up-regulated, suggesting that only hsa-mir-23b-3p is favorably connected with patient prognosis. All of these data point to hsa-mir-23b-3p as the most likely GTSE1 regulatory miRNA in ccRCC.
| mRNA | miRNA | R value | P-value | P-star |
|---|---|---|---|---|
| GTSE1 | hsa-miR-23a-3p | 0.124 | 0.0046 | *** |
| GTSE1 | hsa-miR-181a-5p | -0.018 | 0.688 | - |
| GTSE1 | hsa-miR-181b-5p | 0.095 | 0.03 | * |
| GTSE1 | hsa-miR-181c-5p | -0.066 | 0.1 | - |
| GTSE1 | hsa-miR-23b-3p | -0.238 | 4.08E-08 | *** |
| GTSE1 | hsa-miR-134-5p | 0.282 | 7.10E-11 | *** |
| GTSE1 | hsa-miR-150-5p | 0.246 | 1.53E-08 | *** |
| GTSE1 | hsa-miR-381-3p | 0.224 | 2.81E-07 | *** |
| GTSE1 | hsa-miR-338-3p | -0.051 | 0.025 | * |
| GTSE1 | hsa-miR-181d-5p | 0.082 | 0.06 | - |
| GTSE1 | hsa-miR-671-5p | 0.271 | 3.67E-10 | *** |
| GTSE1 | hsa-miR-296-3p | 0.2 | 4.42E-06 | *** |
| GTSE1 | hsa-miR-532-3p | -0.114 | 0.009 | *** |
| GTSE1 | hsa-miR-543 | 0.151 | 5.96E-04 | *** |
Note: *p<0.05; **<0.01; ***p<0.001.
Table 4: Correlation analysis between mRNA and miRNA in ccRCC (date from StarBase).
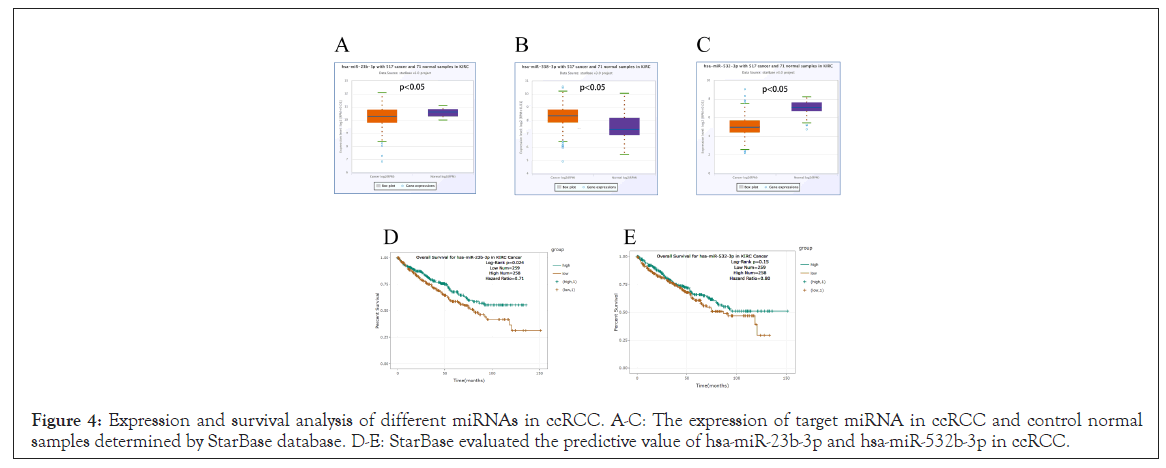
Figure 4: Expression and survival analysis of different miRNAs in ccRCC. A-C: The expression of target miRNA in ccRCC and control normal samples determined by StarBase database. D-E: StarBase evaluated the predictive value of hsa-miR-23b-3p and hsa-miR-532b-3p in ccRCC.
Prediction and analysis of upstream lncRNA of hsa-mir- 23b-3p
Using a SateBase database, the upstream lncRNA of hsa-mir-23b-3p was predicted next. hsa-mir-23b-3p predicted a total of 53 lncRNA. lncRNA may boost mRNA expression by competing with shared miRNA, according to the competing endogenous RNA (ceRNA) theory. As a result, lncRNA and miRNA should have a negative connection, while lncRNA and mRNA should have a positive association. We projected a negative association between lnRNA and hsa-mir-23b-3p based on the preceding parameters (Table 5). PVT1 was discovered to be substantially expressed in ccRCC after further investigation (Figures 5A and 5B). In terms of expression, survival, and association analyses, PVT1/has-mir-23b-3p/ GTSE1 axis appears to be the most promising upstream lncrna in ccRCC.
| miRNA/mRNA | LncRNA | R value | P-value |
|---|---|---|---|
| hsa-miR-23b-3p | PVT1 | -0.242 | 0.0315 |
| GTSE1 | PVT1 | 0.229293 | 1.02E-07 |
Table 5: Correlation analysis between lncRNA and miRNA or lncRNA and miRNA in ccRCC (data from StarBase database).

Figure 5: Expression and survival analysis of lncRNA (PVT1) in ccRCC. A: Analysis of PVT1 expression in ccRCC based on GEPIA website. B: Analysis of PVT1 survival analysis in ccRCC based on GEPIA website.
GTSE1 was positively correlated with immune cell infiltration in ccRCC
We utilized the Timer website to investigate the function of GTSE1 in the immune system. In ccRCC, the infiltration level of CD8+ T, CD4+ T, neutrophil, and dendritic cells reduced when the copy number of GTSE1 was increased, as shown in Figure 6A. Further correlation analysis reveals crucial information for the research of GTSE1 function and mechanism. As a result, the relationship between GTSE1 expression and immune cell penetration was investigated. In ccRCC, expression of GTSE1 was substantially linked with all immune cells studied, including B cells, CD8 T cells, CD4 T cells, macrophages, neutrophils, and dendritic cells (Figures 6B-6G).
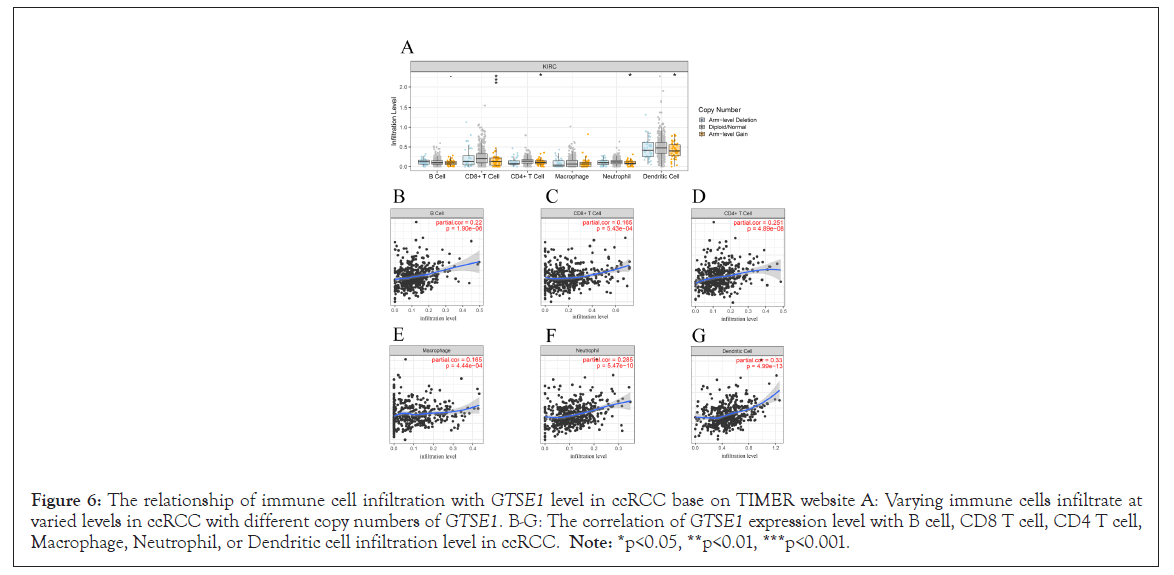
Figure 6: The relationship of immune cell infiltration with GTSE1 level in ccRCC base on TIMER website A: Varying immune cells infiltrate at varied levels in ccRCC with different copy numbers of GTSE1. B-G: The correlation of GTSE1 expression level with B cell, CD8 T cell, CD4 T cell, Macrophage, Neutrophil, or Dendritic cell infiltration level in ccRCC. Note: *p<0.05, **p<0.01, ***p<0.001.
Correlation between the expression of GTSE1 and immune cell biomarkers in ccRCC
We used the GEPIA database to examine the expression connection between GTSE1 and ccRCC immune cell biomarkers in order to further investigate the role of GTSE1 in tumor immunity. Table 4 shows the relationship between GTSE1 and B cell biomarkers (CD19 and CD79a), CD8 T cell biomarkers (CD8a and CD8b), CD4 T cell biomarkers (CD4), M1 macrophage biomarkers (NOS2, IRF5 and PTGS2), M2 macrophage biomarkers (CD163, VSIG4 and MS4A4A), and neutrophil biomarkers (ITGAM and CCR7). The favorable connection between GTSE1 and immune cell penetration is somewhat supported by these data (Table 6).
| Immune cell | Biomarker | R value | P-value | P-star |
|---|---|---|---|---|
| B-cell | CD19 | 0.051 | 0.085 | - |
| CD79A | 0.28 | 0.047 | * | |
| CD8+T | CD8A | 0.21 | 1.50E-06 | *** |
| CD8B | 0.16 | 2.60E-04 | *** | |
| CD4+T | CD4 | 0.22 | 2.40E-07 | *** |
| M1 | NOS2 | -0.017 | 0.7 | - |
| IRF5 | 0.13 | 0.0042 | ** | |
| PTGS2 | 0.021 | 0.64 | ||
| M2 | CD163 | 0.27 | 4.80E-10 | *** |
| VS.IG4 | 0.33 | 8.90E-15 | *** | |
| MS4A4A | 0.17 | 6.80E-05 | *** | |
| Neutrophil | CEACAM8 | 0.024 | 0.58 | - |
| ITGAM | 0.051 | 0.24 | - | |
| Dendritic cell | CCR7 | 0.07 | 0.11 | - |
| HLA-DPB1 | 0.055 | 0.21 | - | |
| HLA-DQB1 | 0.041 | 0.35 | - | |
| HLA-DRA | 0.075 | 0.088 | - | |
| HLA-DPA1 | 0.052 | 0.23 | - | |
| CD1C | 0.012 | 0.78 | - | |
| NRP1 | -0.06 | 0.17 | - | |
| ITGAX | 0.18 | 3.50E-05 | *** |
Note: *p<0.05; **<0.01; ***p<0.001.
Table 6: Correlation analysis between GTSE1 and immune cell biomarkers in ccRCC (date from GEPIA).
Relationship between GTSE1 and ccRCC immune checkpoint
The immune checkpoints PDCD1/PD-L1/PD-L2 and CTLA-4 are curcial in tumor immune escape. The relationship between GTSE1 and PDCD1, PD-L1, PD-L2, or CTLA-4 was investigated in light of GTSE1 's potential carcinogenic effect in ccRCC. In ccRCC, GTSE1 expression was strongly positively linked with PD1, PD-L2, and CTLA-4 after purity correction, but not with PDCD1. Furthermore, we checked the GTPIA database and discovered that in ccRCC, GTSE1 showed a strong positive connection with PDCD1, PD-L1, and CTLA-4, but no significant correlation with PD-L2 (Figures 7A-7H). Other immune cell biomarkers, in addition to neutrophil biomarkers, were found to be more or less favorably linked with GTSE1 , indicating a link between GTSE1 and immune cell infiltration.
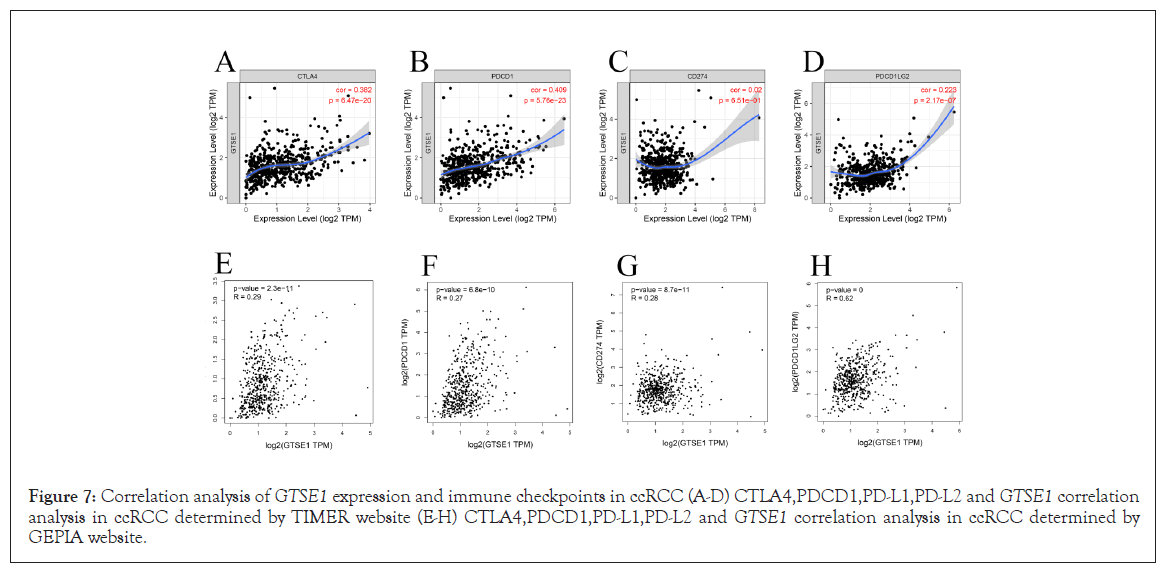
Figure 7: Correlation analysis of GTSE1 expression and immune checkpoints in ccRCC (A-D) CTLA4,PDCD1,PD-L1,PD-L2 and GTSE1 correlation analysis in ccRCC determined by TIMER website (E-H) CTLA4,PDCD1,PD-L1,PD-L2 and GTSE1 correlation analysis in ccRCC determined by GEPIA website.
Advanced ccRCC is still known for having a dismal prognosis [27]. The discovery of the molecular mechanism of ccRCC carcinogenesis might lead to the development of efficient treatment targets or the identification of potential prognostic biomarkers. During mitosis, GTSE1 is linked to the activity of cytoplasmic tubulin and microtubules, and the activity of microtubules has a direct impact on the likelihood of chromosomal distribution abnormalities. Increased GTSE1 levels in normal cells result in a greater cell division error rate [28]. Indeed, more and more data suggests that GTSE1 expression is linked to malignant prognosis. However, our knowledge of GTSE1 in ccRCC is currently incomplete, and more research is needed.
The involvement of GTSE1 in ccRCC was thoroughly studied in this works. To begin, a review of various public tumor databases revealed that GTSE1 expression in ccRCC rose dramatically. GTSE1 overexpression was linked to a higher histological grade, advanced clinical stage, TNM stage, and a poor prognosis. GTSE1 was also found to be an independent risk factor in individuals with ccRCC in both univariate and multivariate Cox regression analyses. As a result, we concluded that GTSE1 is a significant oncogene in ccRCC.
There is enough evidence that ncRNAs, including as miRNA, lncrna, and circular RNA (circular RNA), communicate with one another via the ceRNA mechanism and play a role in gene regulation [29-32]. According to this concept, we used the StarBase online tool to forecast 14 miRNAs and then screened two miRNAs, hsa- miR-23b-3p and hsa-miR-532-3p, that were negatively linked with both mRNA and highly expressed in renal paraneoplastic tissues. Although there have been few studies on the role of hsa-mir-23b- 3p and hsa-mir-532-3p in renal tumors, it has been reported that hsa-mir-23b-3p is important in cervical cancer and intrahepatic cholangiocarcinoma [33,34]; Hsa-mir-532-3p can also be used as a biological marker for lung adenocarcinoma prognosis [35]. Further survival analysis indicates that hsa-mir-23b-3p is very important in predicting the prognosis of ccRCC, although hsa-mir-532-3p is not.
As a result, we believe hsa-mir-23b-3p is the most effective miRNA upstream of GTSE1 .
We also predicted the lncRNAs upstream of hsa-miR-23b-3p, and our study comprised a total of 53 lncRNAs. Only PVT1 was suitable among the final 56 lncRNAs, according to the ceRNA doctrine. The high expression of PVT1 was shown to be substantially linked with the prognosis of ccRCC in a survival study. According to reports, PVT1 plays a part in the incidence and progression of a variety of cancers, influencing tumor proliferation and generating tumor metastasis. For example, PVT1 can promote gallbladder cancer tumor progression through the miR-143/hK2 axis [36], promote angiogenesis in gastric cancer by activating the STAT3/VEGFA axis [37], and promote renal cell carcinoma proliferation, invasion, and epithelial mesenchymal transformation by downregulating mir-16-5p [38]. As a result, we identified PVT1/hsa-mir-23b-3p/ GTSE1 as a possible ccRCC regulatory pathway.
Research has shown that Tumor infiltrating Immune Cells (TIC) play a key role in carcinogenesis and development, as well as influencing cancer patients' treatment outcomes and prognoses [39-41]. In ccRCC, GTSE1 was strongly positively connected with B cells, CD8 T-cells, CD4 T-cells, macrophages, neutrophils, and dendritic cells, according to our findings. In addition to neutrophil biomarkers, GTSE1 was shown to be substantially related with biomarkers that penetrate immune cells. Further analysis revealed that M2 macrophages were most closely associated with GTSE1 . M2 macrophages are known to enhance tumor cell genesis and metastasis, as well as suppress T cell-mediated antitumor immune responses, accelerate tumor angiogenesis, and worsen prognosis [41,42]. Residing in the above findings, tumor immune infiltration may partially explain the oncogenic role and prognosis of GTSE1 in ccRCC.
Clear cell renal carcinoma targeted treatment and immunotherapy is essential therapeutic strategies for advanced renal cell carcinoma, and immune checkpoint expression is a key connection impacting the therapeutic efficacy [43]. As a result, we looked into the connection between GTSE1 and the immunological checkpoint.
The findings revealed that elevated GTSE1 expression in ccRCC was connected to PDCD1, PD-L1, PD-L2, or CTLA-4, implying that targeted GTSE1 can improve immunotherapy effectiveness in ccRCC.
Finally, high GTSE1 expression is associated with poor prognosis, tumor immune cell infiltration, and immune detection sites in ccRCC, and the PVT1/hsa-miR-23b-3p/ GTSE1 axis is an important regulatory mechanism for ccRCC. The above pathway could be a promising therapeutic target for ccRCC. Furthermore, we must not overlook the flaws in tumor databases and the constraints of retrospective research; we must also confirm our findings with more fundamental tests and large-scale clinical trials.
The expression of PVT1/hsa-mir-23b-3p/ GTSE1 axis gene is highly correlated with the clinical characteristics of ccRCC, which can predict its prognosis and guide clinical individualized treatment. Our study provides important evidence for detecting the role of GTSE1 in renal cell carcinoma in the future.
[Crossref] [Google Scholar] [PubMed].
[Google Scholar][PubMed].
[Crossref][Google Scholar][PubMed].
[Crossref][Google Scholar][PubMed].
[Crossref][Google Scholar][PubMed].
[Crossref][Google Scholar][PubMed].
[Crossref][Google Scholar][PubMed].
[Google Scholar][PubMed].
[Crossref][Google Scholar][PubMed].
[Crossref][Google Scholar][PubMed].
[Crossref][Google Scholar][PubMed].
[Crossref][Google Scholar][PubMed].
[Crossref][Google Scholar][PubMed].
[Crossref][Google Scholar][PubMed].
[Crossref][Google Scholar][PubMed].
[Crossref][Google Scholar][PubMed].
[Crossref][Google Scholar][PubMed].
[Crossref][Google Scholar][PubMed].
[Crossref][Google Scholar][PubMed].
[Crossref][Google Scholar][PubMed].
[Crossref][Google Scholar][PubMed].
[Crossref][Google Scholar][PubMed].
[Crossref][Google Scholar][PubMed].
[Crossref][Google Scholar][PubMed].
[Crossref][Google Scholar][PubMed].
[Crossref][Google Scholar][PubMed].
[Crossref] [Google Scholar][PubMed]
[Crossref][Google Scholar][PubMed].
[Crossref][Google Scholar][PubMed].
[Crossref][Google Scholar][PubMed].
[Crossref][Google Scholar][PubMed].
[Google Scholar][PubMed].
[Crossref][Google Scholar][PubMed].
[Crossref][Google Scholar][PubMed].
[Crossref][Google Scholar][PubMed].
[Crossref][Google Scholar][PubMed].
[Crossref][Google Scholar][PubMed].
[Crossref][Google Scholar][PubMed].
[Crossref][Google Scholar][PubMed].
[Crossref][Google Scholar][PubMed].
[Crossref][Google Scholar][PubMed].
Citation: Xiayu K, Guogang C, Canxuan LI. (2022) ncRNAs-mediated Upregulation of GTSE1 is Involved in the Poor Prognosis and Tumor Immune Infiltration of Clear Cell Renal Cell Carcinoma. Immunotherapy (Los Angel). 8:198.
Received: 04-Jul-2022, Manuscript No. IMT-22-18509; Editor assigned: 06-Jul-2022, Pre QC No. IMT-22-18509 (PQ); Reviewed: 21-Jul-2022, QC No. IMT-22-18509; Revised: 28-Jul-2022, Manuscript No. IMT-22-18509 (R); Published: 05-Aug-2022 , DOI: 10.35248/2471-9552.22.8.198
Copyright: © 2022 Xiayu K, et al. This is an open-access article distributed under the terms of the Creative Commons Attribution License, which permits unrestricted use, distribution, and reproduction in any medium, provided the original author and source are credited.