Journal of Biomedical Engineering and Medical Devices
Open Access
ISSN: 2475-7586
ISSN: 2475-7586
Research Article - (2017) Volume 2, Issue 1
Keywords: Blood vessels; MRI; Breast; Center line tracking; Vessel enhancement
The spread of cancer is supported by blood vessels that bring oxygen and nutrients to the tissues. Angiogenesis is one of the tools used by radiologists to diagnose suspicious masses. With this motivation, many algorithms have been developed in the last two decades [1]. Among them are different well-known families of methods, such as active contours or snakes [2], region growing [3] and level sets [4]. One of the best methods for detection of blood vessels is the modelbased algorithm [5], which is based on a 3-D deformable model which consists of a representation of a central vessel axis coupled to a vessel wall surface. The blood vessels, in this method, are determined according to the eigenvalues. It has to be noted that the algorithm was aimed to be processed on MRA (Magnetic Resonance Angiogenesis images). Due to the previous massive investigation, the challenge is not to develop imaging for vessels anymore, but to tackle those vessels which are not clearly seen, are detached, or are clutters that can’t be defined. MRA has been developed to enable clear visualization of blood vessels. Thus, the blood vessels in MRA can be detected more easily. However, Magnetic Resonance Imaging (MRI), which is aimed mainly to explore the anatomy and function of soft tissue, is more challenging for the detection of blood vessels, due to noise and low resolution.
Several methods have been employed to perform blood vessels’ completion in various body tissues, such as the liver, lungs and breasts. One of the prominent studies in this field is a study by Shang and his colleagues [6]. They suggested using a region growing method to be applied inside a tube according to direction of the detached vessel’s end point. However, applying region growing might lead to false positives in such a way that the algorithm will yield areas that are much larger than the desired tubular structure of the blood vessel. Huang and his colleagues [7] suggested using a guidance model, which contains a prior knowledge of the standard vasculature in the liver, for tracking blood vessels. Although their method appears to be efficient and fast, it probably cannot be applicable to breast tissues, since we don’t have a guidance model or standard vasculature for different breasts of various women. Wink and his colleagues [8] suggested a different approach of minimum cost path in multiple vessel tracking. The method succeeded in coping with difficult image conditions such as stenosis and noise. The line completion is done without any knowledge or usage of the actual blood vessels’ directions. Even though it is an elegant method, its application to breast tissue might be problematic, due to the complexity of the calculus of variation method in the case of numerous blood vessels. Moreover, this method will have difficulty in coping with situations where blood vessels are curved (especially in the vicinity of suspicious masses). The challenge to perform blood vessel segmentation in the breast is amplified due to the existence of connective and fat tissues, the structure of which sometimes resembles the elongated structures of the blood vessels.
In recent studies [9,10] algorithms were developed to perform segmentation in breast MRIs. Both groups performed the algorithm in 2D. Lin and his colleagues [9] applied morphological operations. Glotos and his colleagues [10] applied a region growing algorithm. Both groups performed the algorithm in 2D, and therefore the method can lead to results with false positives. Since the calculations in both studies have been done in 2D, it is almost impossible to connect the detached blood vessels that exist in 3D. In addition, it can also lead to false blood vessels being identified, such as the contours of the breast. In light of the current research, the question of how to complete broken vessel structures is left an open question. The aim of this study is to reconstruct blood vessels with 3D facility window, while correcting the difficult image conditions such as: noise, fat tissues and blurry-edged conditions.
ROI generation
We used a common method to generate a Region of Interest (ROI) (Dogan et al. [11]) using T2 images, due to their anatomical properties. The application of Dogan et al. [11] allowed us to distinguish between three main zones: the posterior (the heart zone), the breast area, and a dark zone which is part of the image background. A closing operation [12] was used to complete the segmentation.
Texture enhancement
In order to enable better segmentation of the blood vessels, we applied a unique method for multi-scale texture enhancement, which is derived from a model of the visual system adaptation mechanism described by Barkan et al. [13]). We had to apply new measures for texture contrast, in accordance with the requirements for breast MRI. Using certain components from the model created for post-retinal receptive fields, we were able to retrieve an enhancement for this texture contrast. These multi-scale components consist of contrast elements (DOG (Difference of Gaussian) or Gabor functions), while applying a power low to each scale separately to enhance the relevant scale.
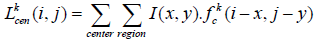
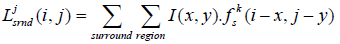
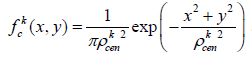
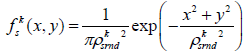
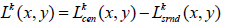
The DOG function was determined through center and surround weight functions. The center and surround signals are defined by:
 (1)
(1)
 (2)
(2)
 (3) and
 (4)
(4)
The response of each resolution level, k, is calculated by the difference in the center and the surround responses:
 (5)
(5)
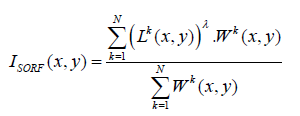
The total sum of the responses generated by feeding the image to the SORF is then calculated using the average power (λ), with consideration of their weight, such that the responses of dominant resolution will more contribute to the response, Isorf:
 (6)
(6)
Multi-scale model-based blood vessel detection-Frangi’s filter
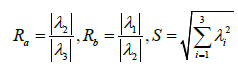
At this stage, we need to perform an enhancement for the tubular structures in the image in order to capture the blood vessels. We use a Hessian method that enhances the blood vessels and supplies its direction [5] according to Frangi et al. Due to this method the 3×3 Hessian matrix is calculated separately for each pixel, at a chosen Gaussian resolution. Later the eigenvalues and eigenvectors are derived, and we obtain three vectors, while 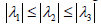
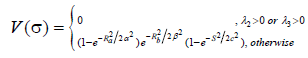
According to the study of Frangi et al. [5], a structure similar to a blood vessel will be detected, due to the fact that only one direction is expected to be with a low eigenvalue, while the other two are expected to be with high values. The rationale for this is derived from the fact that in elongated structures the differences along this axis obtain a lower value than the differences along the other two directions. Frangi and his colleagues [5] suggested detecting vascular structure (bright vessel) according to the vessel’s likelihood function, V(σ) in Eq. 7.
 (7)
(7)
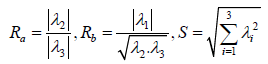
(α,β,c are constants.) Ra and Rb are the criteria to determine symmetry in the Hessian matrix or determine how blobby the shape is, respectively. The above calculations of V(σ) is done across different scales and the output of the discrimination function is determined by maximum of all V(σ).
Blood vessels completion
Up until now, we detected and enhanced the blood vessels in the given 3D images. However, there is no guarantee that we detected the whole vascular tree, due to factors such as noise, for example. In order to connect the ‘broken’ blood vessels, we were required to first identify the end points. Next, we reconnected the end points, drawing inspiration from a phenomenon in the visual system termed lateral facilitation [14]. The procedure we used to fulfil this completion of elongated structures was done in the following way:
Skeletonizing
In order to fulfil the above completion of blood vessels, we need to refer to their elongated structural nature regardless of their width, their scale, etc. For this we applied a skeletonizing algorithm. There are several possible methods, and we chose here to apply the most simple and efficient one [15].
Find end points
The process of finding end points is a simple task, due to the skeletonizing procedure, since the edges of the detached blood vessels are the starting point and ending point of each elongated structure [12].
Center line tracking
To establish a more accurate vascular tree, we employ the work of Stephen et al. [16]. This method makes use of the eigenvectors found in the prior step. We take the eigenvector with the lowest eigenvalue, which is in the direction of the elongated structure, and iteratively follow it by using Eq. 8. The seed points are the end points found in previous step.
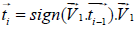 (8)
(8)
In the case that the calculation does not find additional end point, or made a self-loop, we disqualify it. Otherwise, it is valid and is added to the results.
Mass detection
After developing the image representation of the vascular tree, it is clinically required to diagnose and present the suspicious mass within the same image at the appropriate location. For this purpose we applied a modification of the Frangi et al. [5] method, in order to detect the mass, but with “opposite” logic that was required for the elongated structure, as following:
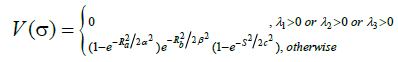 (9)
(9)
In this case we changed the discrimination function to enable detection of blob-like structures, so that all the three eigenvalues are supposed to get high values (Table 1). Consequently, and Rbis changed to behave similarly to Ra.
| Case | Sensitivity (Voxels) |
Specificity (Voxels) |
|---|---|---|
| 1 | 0.877 | 0.881 |
| 2 | 0.886 | 0.92 |
| 3 | 0.888 | 0.891 |
| 4 | 0.829 | 0.859 |
| 5 | 0.854 | 0.873 |
| 6 | 0.894 | 0.91 |
| 7 | 0.884 | 0.861 |
| 8 | 0.874 | 0.909 |
| 9 | 0.847 | 0.852 |
| 10 | 0.856 | 0.869 |
| 11 | 0.869 | 0.869 |
| 12 | 0.835 | 0.868 |
| 13 | 0.835 | 0.891 |
| 14 | 0.838 | 0.875 |
| 15 | 0.835 | 0.848 |
| 16 | 0.844 | 0.859 |
| 17 | 0.879 | 0.912 |
| 18 | 0.85 | 0.886 |
| 19 | 0.868 | 0.854 |
| 20 | 0.87 | 0.933 |
| 21 | 0.869 | 0.917 |
| 22 | 0.876 | 0.888 |
| 23 | 0.845 | 0.902 |
| 24 | 0.843 | 0.874 |
| Total | 0.86 | 0.883 |
| Variance | 0.00039 | 0.00058 |
Table 1: The results from all the cases with Sensitivity and Specificity. The results are calculated by number of True positives and False Negatives of Voxels.
The challenge of our algorithm was to supply the large variety of blood vessels that can be seen in the 3D reconstruction breast MRI. The suggested algorithm was tested on 24 different patients, and the results were compared to the MIP (Maximum Intensity Projection) images and the ground truth images, which the radiologists segmented manually. Figure 1 presents an example of these results. This figure demonstrates the ability of our algorithm to expose much more information compared to the MIP image, and shows it is closer to the ground truth (Figure 1b). In order to visually expose all of the blood vessels in this specific organ, we need a 3D image. Figures 2 and 3 demonstrate the algorithm’s abilities to show the vasculature in comparison to the manual gold standard result and the MIP that succeeds in showing it only in 2D (Figures 4 and 5). We can see that a lot of the blood vessels are not seen in the there are a lot of blood vessels hidden in the tissues in the middle and upper section of the breast.

Figure 1: Demonstration of Maximum Intensity Projection images of the ground truth with comparison with the algorithm and the original results. It can be seen clearly that the hidden blood vessels can't be seen through ordinary MIP. (a) Ground truth result projected in 2D. (b) Algorithm result projected in 2D. (c) Maximum intensity projection of all the slices in the MRI.

Figure 2: Typical breast MRI. A comparison of the 3D reconstruction algorithm to the ground truth and the MIP. (a) Ground truth result in 3D. (b) Algorithm’s result in 3D. (c) Maximum intensity projection of the case.
Figure 2 succeeds in reconstructing the blood vessels’ general structure and connecting some of the detached blood vessels that were not necessarily segmented by the doctors. A question is raised whether this additional information that the algorithm depicted, even though it is not depicted by the radiologist, is really required. The radiologist thought that, after observing our results casually and her manual diagnosis, there is a promise that the algorithm performed equally to the manual diagnosis in the majority of cases. However, this issue must be addressed specifically and statistically in a future study.
The trend of significant better performance over the MIP is general across all the sample images that we analyzed. Furthermore, the algorithm’s performance shows high similarity to the ground truth 3D image (Figure 2a) created by the radiologists. A similar trend of results can also be seen when the algorithm is tested on dense breast tissue (Figure 3). Again, we can view the vessels clearly (Figure 3b) exposed, while in this case of dense breast, the MIP image is not able to distinguish any vessels (Figure 3c).

Figure 3: Dense breast MRI. A Comparison of the 3D reconstruction algorithm to the ground truth and the MIP. (a) Ground truth result in 3D. (b) Algorithm’s result in 3D. (c) Maximum intensity projection of the case.
The last example shows clearly that the degree of information contained in our algorithm shows many more blood vessels (Figure 4) than the manually segmented blood vessels that the radiologist delineated, (Figure 4a). Such a result yielded significant false positive statistical results (Table 1) and it raises the question of how we should account for such a result. This issue is mainly relevant due to the fact that our algorithm succeeded in detecting the malignant mass that could not be detected easily, if at all, in both the original and the delineated radiologist segmentation it. Table 1 presents all the results from all 24 patients. The statistical results of the sensitivity and specificity showed respectively 86.04% ± 2% (mean ± STD) and 88.3% ± 2.5% (mean ± STD)

Figure 4: A Comparison of the 3D reconstruction algorithm to the ground truth and the MIP. (a) Ground truth result in 3D. (b) Algorithm’s result in 3D. (c) Maximum intensity projection of the case.

Figure 5: Dense breast MRI. A Comparison of the 3D reconstruction algorithm to the ground truth and the MIP. (a) Ground truth result in 3D. (b) Algorithm’s result in 3D. (c) Maximum intensity projection of the case.
Our algorithm is the first to perform blood vessel 3D segmentation in breast MRIs. This specific body tissue is challenging due to its nature, which is characterized by blood vessels without sharp edges, and by vasculature that is not fully defined. The algorithm succeeded in performing segmentation, which yielded good results that were expressed by high sensitivity and specificity, in comparison to the gold standard result segmented manually by the radiologist. The gold standard might suffer from a structural problem since the radiologist marks the detached blood vessels as they appear, even though their perception might lead to understanding that these vessels are not truly detached. It can be seen that in many cases (Figure 2), the radiologist marked detached vessels, but the algorithm marked them as intact (the arrows in Figures 2a and 2b). Consequently, it seems the algorithm yielded better results due to the line completion that the algorithm performs. Support for this suggestion is given by the radiologist that approved that most of the algorithm-completed cures are reasonable; she accepted the algorithm’s suggestion. The challenge of blood vessels completion that the algorithm copes with is a process done in the visual system termed lateral facilitation [14,17]. It is possible, thus, that the radiologists themselves base their diagnosis on such visual perception mechanisms.
The only study that compared the algorithm’s results to the radiologist’s gold standard diagnosis was the study of Lin et al. They showed 84.9% ± 7.8% true positives and 21.3% ± 12.8% false positives. They obtained their results on their algorithm’s performance with only 2D breast images. Our algorithm yielded better results on the 3D images. It has to mentioned that all other previous studies that performed segmentation of blood vessels in MRI breast images did not evaluate their algorithm’s performance using a radiologist’s manual segmentation [6,7,10].
Other works that we compared on breast MRI had worst results than the algorithm achieved because of a lot of false positives. As we can see in Figure 6c, when applying directional region growing by Shang et al. [6], it is a difficult task, to only follow the vessels and not the fat tissues. The algorithm results in 37.3% false positive. In The same way minimum cost path in multiple vessel tracking [8], can fail to detect the difference between tissues and blood vessels and complete them where they shouldn’t be completed, and results in 44.02%. false positives, as can be seen in Figure 6d. The suggested method can be applied to additional medical applications, and other types of tissues such as: segmentation of vessels in the liver or airways in the lungs. It must be tested on images with blood vessels gone through stenosis or contrast agents that have a poor demonstration.

Figure 6: Comparison between 3D methods applied on breast MRI (a) Ground truth result in 3D (b) Algorithm’s result in 3D (c) Directional region growing in 3D [6] (d) minimum cost path in multiple vessel tracking [8].
This work was supported in part by the Israel Office of the Chief Scientist under Grant BS123456”.