Journal of Geology & Geophysics
Open Access
ISSN: 2381-8719
ISSN: 2381-8719
Research Article - (2013) Volume 2, Issue 1
Snowmelt runoff is a significant water resource in the western United States. However this resource is extremely sensitive to changes in the local or regional climate. In this paper the potential changes in snowmelt runoff volume in response to changes in the local climate for the Animas River basin, Colorado were studied. A set of statistically downscaled general circulation model scenarios encompassing generally warmer and drier future climates were used to drive the Snowmelt Runoff Model (SRM) to investigate how snowmelt season basinwide runoff would respond to these conditions. Results suggest a shift in the timing and size of the snowmelt relative to historical measurements, with increases in April-May runoff volume offset by decreases in June-July runoff. The success of the SRM in modeling these climate change impacts could provide valuable data for water resource planners of similar snowmelt dominated river basins across the western United States.
Keywords: Snowmelt, Snowmelt Runoff Model (SRM), Streamflow timing, Climate change
The process of snowmelt is crucial in controlling the streamflow response of any mountain watershed dominated by snowfall in the winter months. As much as 75-80% of annual streamflow across the western United States (US) originates from this snowmelt source [1-3]. Historical studies across this region have recorded multiple instances of warming air temperatures and declines in the ratio of snow-to-rain precipitation during the winter snowpack or spring snowmelt months for these watersheds leading to earlier snowmelt runoff in the snowmelt season [2,4-7]. The Snow Water Equivalent (SWE) of many of these western US watershed snowpacks has also exhibited a downward trend since the mid-twentieth century [3,8-9]. With an increase in evidence suggesting that these mountain watersheds are currently undergoing significant snowmelt regime changes in response to a warming climate, research has shifted towards modeling and forecasting potential future impacts of climate change on these systems [10-13]. The Snowmelt Runoff Model (SRM), in particular, has been used in over 100 river basin studies where snowmelt is a major factor in runoff [14]. This semi-distributed model uses the degree-day or temperature index method to calculate and calibrate daily snowmelt runoff volume, and includes a total of six parameters:
 (1)
(1)
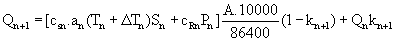
where Q is the average daily runoff, and are the runoff coefficients for snowmelt and rain respectively, a is the degree day coefficient which equates to snowmelt depth, T is the number of degree days, ΔT is the adjustment to the air temperature lapse rate, S is the ratio of snow cover area to total basin area, P is the total precipitation that contributes to runoff based on a critical temperature threshold, A is the area of the basin, k is the recession coefficient equating to the decline of runoff following snowmelt or rainfall, and n indicates the number of days in the model run sequence. Historical snowmelt and resultant streamflow may be simulated in the SRM, while a climate change scenario function further allows the forecasting of future snowmelt runoff and streamflow response for multiple river basins [15,16]. With historical analysis of snowmelt dominated river basins suggesting that warming temperatures are leading to a shift in the timing of streamflow in the snowmelt season, this paper will analyze how snowmelt and the resulting runoff volume may change in response to changes in the local climate for a typical small snowmelt dominated basin, the Animas River Basin at Durango, Colorado in the western US (Figure 1).
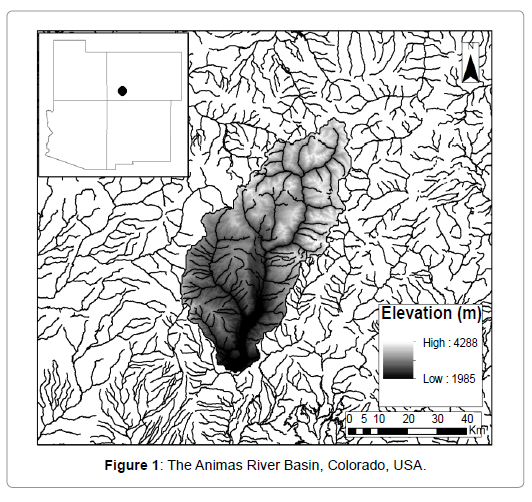
Figure 1: The Animas River Basin, Colorado, USA.
The SRM requires daily historical climate data for one year to first calibrate the model, but may then be forced using seasonal climate projections spread across each day of the snowpack and snowmelt seasons. In order to calculate the snow cover depletion within the basin during the snowmelt period, the National Snow and Ice Data Center (NSIDC) provided Moderate Resolution Imaging Spectroradiometer (MODIS) snow cover imagery covering the basin at are solution of 500 m for a historical normal year (a year on record with minimal departures from average monthly temperature and precipitation levels) (Figure 2). The 2003 water year was chosen for calibration purposes as this year had the closest climatological match, in terms of basinwide air temperature and precipitation, with the historical mean values taken from 1950-2007. Following this, daily climate station mean temperature for the snowpack and snowmelt season months (Dec-Mar and Apr- Jul) and total precipitation for the snowpack season months, available from the National Climate Data Center (NCDC) for the same historical year, provided the initial input data for the SRM. Three climate stations provided the necessary basinwide coverage which divided the basin up into three different elevation zones. A further benefit of the SRM is that climate stations outside of the basin may be used through extrapolation of their measurements by elevation, as in this case (Table 1 and Figure 3). Calibration of the SRM took place by adjusting each of the model parameters until the modeled streamflow output fit the historical normal year output, based on the daily streamflow at the Durango stream gauge located at the basin outlet for the 2003 water year. The most crucial parameters requiring calibration included the runoff and recession coefficients, estimated by first calculating the ratio of daily precipitation to streamflow for the runoff coefficient, and then the streamflow from day n compared to day n+1 respectively for the recession coefficient. The extent of the snowpack at each time step estimated the rainfall contributing area parameter which assumed that all rainfall falling on the snowpack would add to the snowmelt runoff. Comparing the daily loss of SWE with daily air temperature at the Red Mountain Pass Snowpack Telemetry (SNOTEL) gauge provided initial estimations of the degree-day coefficient. Adjustments of these parameters then took place as necessary in order to account for over or under-prediction of snowmelt runoff during initial SRM runs. The lapse rate and critical temperature constants were initially left at their default settings of 0.65°C/100 m and 0°C respectively, while a 14 hour time lag provided the initial lag time based on the historical streamflow at Durango. Martinec and Rango [17] further provided a range of parameter values for subsequent calibration and adjustment. The SRM was calibrated using the Nash-Sutcliff (R2) and percentage difference (DV) values for determining model fit with the historical data:
| Station | Zone | Lat. (N) | Long. (W) | Area (sq.km) | Elev. (m) |
|---|---|---|---|---|---|
| Durango | 1 | 37°, 17’ | -107°, 53’ | 307 | 1984 |
| Telluride | 2 | 37°, 57’ | -107°, 49’ | 196 | 2643 |
| Silverton | 3 | 37°, 48’ | -107°, 40’ | 1328 | 2825 |
Table 1: Climate stations included in the SRM.
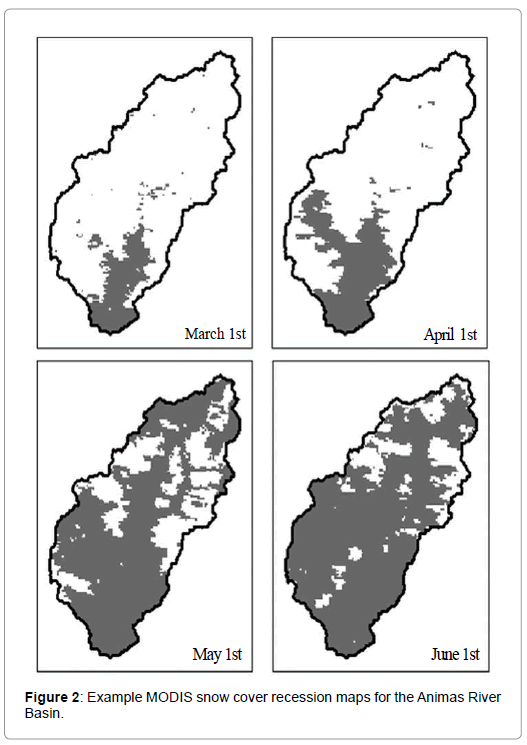
Figure 2: Example MODIS snow cover recession maps for the Animas River Basin.
Figure 3: Climate stations and elevation zones used in the SRM.
 (2)
(2)
 (3)
(3)
Where is the measure of model efficiency, is the observed daily runoff, is the simulated daily runoff, Q’i is the mean daily runoff for the simulated time period, n is the total number of daily runoff values, simulated runoff, is the percentage difference between the observed and is the simulated runoff volume is the observed runoff volume, and future climate change scenarios of temperature and precipitation were applied from two gridded General Circulation Model (GCM) projections that had been downscaled to the Animas River Basin. These projections included the Climate Community System Model version 3 (CCSM3) and the Max Planck Institute for Meteorology version 5 model (ECHAM5) along with three Intergovernmental Panel on Climate Change (IPCC) greenhouse gas emissions scenarios A2 (high), A1B (medium) and B1 (low) (Table 2) [18]. The snowmelt runoff projections to 2050 and 2080 based on these downscaled GCM scenarios were then compared to the historical normal snowmelt runoff determined in the calibration process.
| Snowpack Season Precip. (%) | Snowpack Season Temp. (°C) | Snowmelt Season Temp. (°C) | |||||||
| A2 | A1B | B1 | A2 | A1B | B1 | A2 | A1B | B1 | |
| CCSM3 (2050) | -4 | -12 | -9 | 1.1 | 1.0 | 0.8 | 3.8 | 3.8 | 3.2 |
| ECHAM5 (2050) | -6 | -7 | -1 | 1.6 | 1.6 | 1.7 | 2.5 | 2.8 | 2.4 |
| CCSM3 (2080) | -20 | -20 | -6 | 2.9 | 2.0 | 1.0 | 5.6 | 4.4 | 2.8 |
| ECHAM5 (2080) | -13 | -10 | -11 | 3.2 | 3.0 | 2.2 | 4.2 | 4.2 | 3.4 |
Table 2: Downscaled GCM climate change scenarios included in the SRM.
Figures 4,5 show the observed versus simulated snowmelt runoff based on the 2003 water year calibration. The modeled snowmelt runoff volume registered an R2 fit of 0.93 and a volume difference of -5.8% to mirror the rise in runoff volume responding to the depletion of the snowpack as air temperatures increased into the snowmelt season. The snowmelt runoff responded accordingly following the introduction of changes in the basinwide air temperature and precipitation via the climate change module. Rising air temperatures across both the snowpack and snowmelt season and decreasing precipitation led to a drastic change in the snowmelt runoff volume by 2050, which generally intensified by 2080 for both GCM models (Figures 6-9). Total snowmelt season runoff decreased across all scenarios for both models, and usually decreased in severity from the A2 to B1 scenarios at both time periods with a couple of exceptions. Notably, the ECHAM5 model projected the same gains and losses between the A2 and A1B scenarios by 2080 and very similar values between the same two scenarios by 2050, reflecting the similarity in these particular climate projections. With regards to the entire snowmelt season, by 2050 total snowmelt season runoff projected to reduce between 10.7-23% for the CCSM3 model, and between 7.8- 15.8% for the ECHAM5 model. The scale of these decreases intensified by 2080 to between 9-39.7% based on the CCSM3 model and between 11.2-21.2% based on the ECHAM5 model. When examining the response of individual snowmelt season months to the climate changes it could be seen that, with the exception of April, all months projected a decrease in snowmelt runoff with reductions increasing in severity moving towards the latter stages of the snowmelt season (June and July). July projected the greatest decreases in snowmelt runoff across all model scenarios, ranging from 48.2-87% and 41.4-63.7% reductions by 2050 for the CCSM3 and ECHAM5 models respectively. By 2080, however, the July projections did not worsen, instead providing a similar range in reductions. June also projected severe decreases in snowmelt runoff to 2050, this time increasing in severity further along to 2080. However, the decrease in snowmelt runoff volume tended to be more severe for the less severe B1 climate change scenario for the month of June for the ECHAM5 model. For example, June B1 snowmelt runoff projected to decrease by 52.3% and 61% by 2050 and 2080, but only by 29% and 49.7% for the A2 scenario. The month of May projected smaller decreases in snowmelt runoff across all scenarios, and differed from the months of June and July further by projecting an increase in snowmelt runoff for the B1 scenario, ranging from 22-24% increase across both models. Apart from the month of July, May also sometimes projected a smaller or similar decrease in snowmelt runoff by 2080 compared to 2050 for either of the models. April was the only snowmelt season month which projected increases in snowmelt runoff by 2050 and 2080 across all scenarios due to a shift in the timing of snowmelt to earlier in the season. For the CCSM3 model, April snowmelt runoff projected increases between 47.7-58.6% by 2050 and 50.9-62.6% by 2080. Similar projections occurred for the ECHAM5 model, ranging from 52-60.7% increases by 2050 and 52.3-57.3% increases by 2080. By analyzing changes in snowmelt runoff volume in response to basinwide climate changes, it appears that a shift in the timing of the snowmelt is projected to take place within the Animas River Basin into the 21st century. Projected increases in basinwide air temperature and decreases in basinwide precipitation would effectively reduce the amount of precipitation occurring as snow, and speed up the timing of snowmelt from the traditional late May to early June peak towards the earlier month of April. This is apparent when analyzing the projected overall monthly gains and losses in snowmelt runoff volume across the entire snowmelt season. April is the only month to experience an increase in snowmelt runoff volume across all GCM scenarios by mid and late century, which explains this shift in melt timing and volume. Similarly, the smaller gains in snowmelt runoff volume for the B1 scenario for May for both models further suggests this shift is occurring, with the weaker climatic changes projected by this scenario dampening the otherwise expected losses in snowmelt runoff volume projected by the more severe climatic change scenarios for the same month. June provided a seemingly anomalous result by projecting greater losses in snowmelt for the B1 scenario than the A2 scenario. This may be an unexpected result of the shift in the snowmelt runoff pulse across the boundary of the middle snowmelt season months of June and May, with weaker climate changes displacing the snowmelt hydrograph just enough to disproportionately reduce the runoff of June alone, without gaining any further runoff displaced from July. Furthermore, the decrease in snowmelt runoff volume losses moving back in the snowmelt season from July to May highlights this shift in snowmelt runoff timing, so that the later months of July and June project drier conditions with less snowmelt produced in comparison to normal climatic conditions. Also, July sometimes projected less severe losses in snowmelt runoff volume between 2050 and 2080. As the lattermost snowmelt season month and the furthest chronologically from the snowpack season, this month would be expected to be the most sensitive to change regarding losses and a shift in snowmelt timing to earlier in the snowmelt season, and so any changes in the basinwide climate may well have the propensity to affect the snowmelt hydrology of this particular month in the same way, regardless of severity. The month of May also partially behaved this way, particularly for the ECHAM5 model with the A2 and A1B 2080 scenarios snowmelt reductions being slightly smaller than, or similar to 2050, although the snowmelt losses involved proved much smaller than for those occurring in July. Despite some of the more complex patterns regarding the shift in snowmelt runoff volume across the individual snowmelt season months, the overall effect of early seasonal gains and later seasonal losses in snowmelt runoff volume effectively lead to a smaller reduction in total snowmelt season runoff, again corresponding to a shift in the timing of the basinwide snowmelt process. Despite large losses in snowmelt runoff volume projected for the later snowmelt season months, the gains in the early season months, especially in April, serve to somewhat negate the overall snowmelt season losses in snowmelt runoff volume.
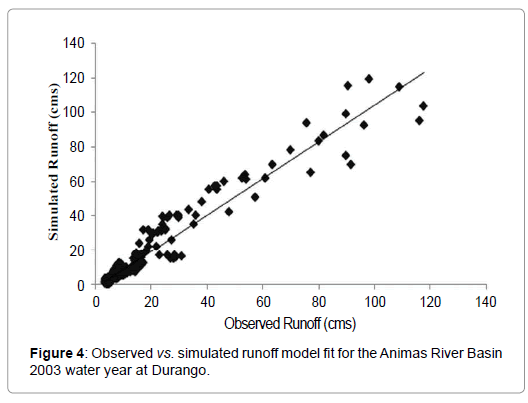
Figure 4: Observed vs. simulated runoff model fit for the Animas River Basin 2003 water year at Durango.
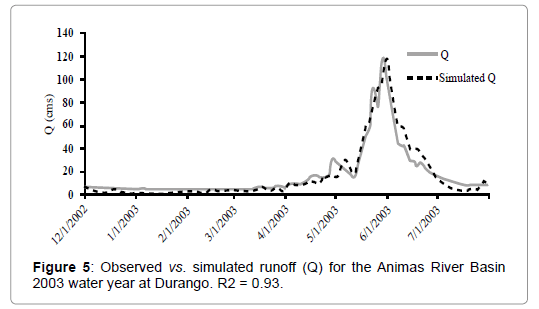
Figure 5: Observed vs. simulated runoff (Q) for the Animas River Basin 2003 water year at Durango. R2 = 0.93.
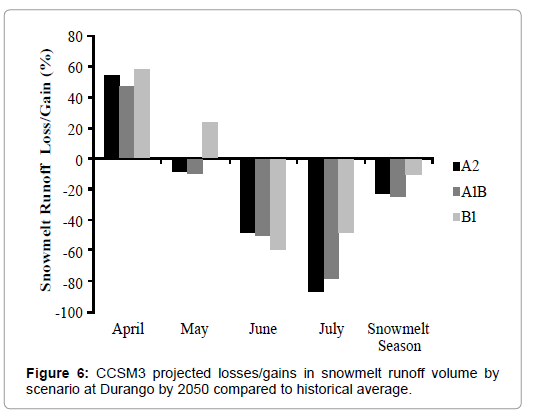
Figure 6: CCSM3 projected losses/gains in snowmelt runoff volume by scenario at Durango by 2050 compared to historical average.
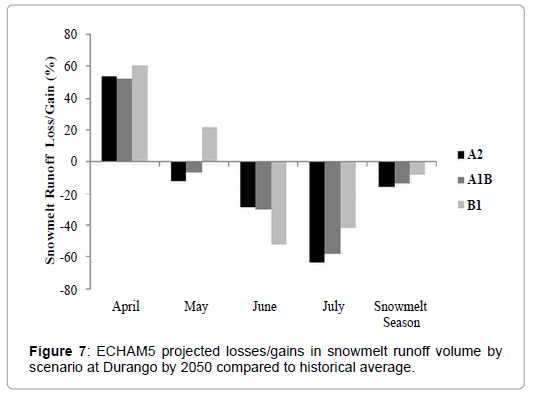
Figure 7: ECHAM5 projected losses/gains in snowmelt runoff volume by scenario at Durango by 2050 compared to historical average.
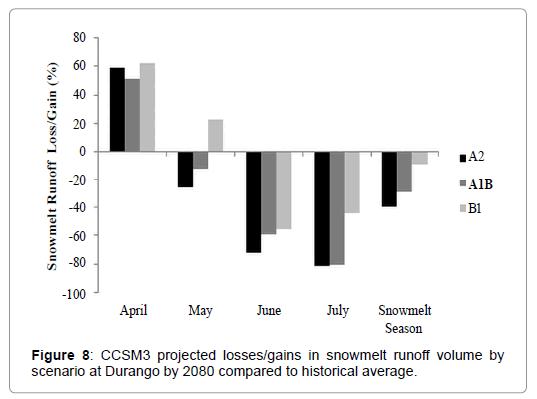
Figure 8: CCSM3 projected losses/gains in snowmelt runoff volume by scenario at Durango by 2080 compared to historical average.
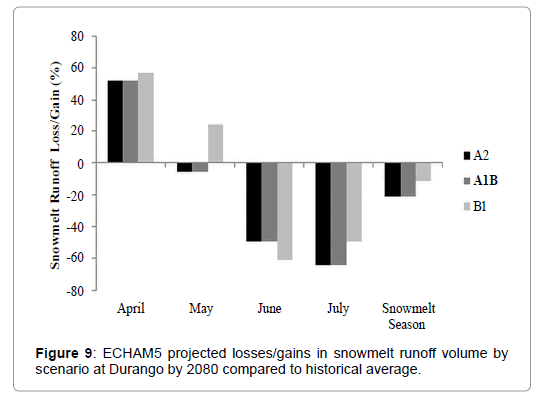
Figure 9: ECHAM5 projected losses/gains in snowmelt runoff volume by scenario at Durango by 2080 compared to historical average.
Using the snowmelt runoff model, SRM, it may be concluded that projected climate changes have the potential to drastically alter the timing and volume of basinwide snowmelt runoff over the course of the century. Regardless of scenario, warming temperatures and decreasing levels of precipitation will cause the snowmelt runoff to shift to earlier in the snowmelt season and reduce in volume overall. As air temperatures increase across the snowpack and snowmelt seasons, less precipitation falls as snow to be stored in the snowpack. This reduced snowpack then begins to melt earlier causing a shift in melt water production to earlier in the season from the historical late May to early June period forwards to April. The severity of these changes depends largely on the severity of the climate change scenario. Snowmelt runoff models coupled to GCMs have the potential to provide the best tools for monitoring and projecting the hydrological impacts of basinwide climate change for snowmelt dominated catchments. However, choosing the right tools for such an undertaking will be crucial in planning for future changes, and great care will need to be taken based on the availability of the data and the physical characteristics of each catchment in question. The SRM model has the ability to project changes in snowmelt runoff for basins of varying sizes, but may only be applied to basins that have the necessary historical physical data: climate data in the form of air temperature, precipitation and SWE; hydrological data in the form of streamflow and snowpack cover data in the form of basinwide satellite imagery. With the wider availability of these types of data for many snowmelt dominated catchments, especially across the western US, snowmelt runoff models like SRM may play a significant role in water resources management and planning towards climate change over the next few decades.