Journal of Geology & Geophysics
Open Access
ISSN: 2381-8719
ISSN: 2381-8719
Research Article - (2014) Volume 3, Issue 3
Woodchip bioreactors have proven effective in removing nitrate-nitrogen (NO3-N) from agriculturally drained water in the Midwest USA region. Both NO3-N and phosphorus can lead to algal bloom and hypoxia in the receiving surface waters and degrade the water quality. This study explored the effectiveness of bioreactor technology in removing NO3-N and orthophosphate. Three types of media were examined in a pilot-scale lab experiment: deciduous mixed hardwood chips, biochar chips (created from the same type of woodchip) and corn cobs. Chemically formulated water was fed through each system using a residence time of 24 hours. NO3-N reduction occurred in all three media, although biochar showed a relatively longer lag time. An average of 90% NO3-N reduction was observed from the 24 hours retention time. An average of 80% of the orthophosphate was sequestered, with the biochar media providing the most reduction in outflow orthophosphate concentration. Given the recent development of state-wide nutrient management plans to reduce nutrient concentrations in surface water, study results of these technologies will help the row-crop producer community manage nutrient export to surface water.
Keywords: Nitrate, Orthophosphate, Bioreactor, Denitrification
Nitrate and phosphorus export from agricultural fields have drawn a lot of environmental attention. Fertilizer application enhances overall crop production, but often adds more nutrients to the soil than what the crops actually need. Excessive nutrients that end up in groundwater, streams, lakes, and other surface water bodies substantially threaten the ecosystem health [1]. Specifically for the Midwest region, the receiving water is the Mississippi River which delivers excess nutrients to the Gulf of Mexico resulting hypoxic conditions more frequently [2]. Excess nitrate in drinking water causes health problem; a number of municipalities draw domestic water supply from the Mississippi River and selected tributaries (DNR). In order to “enhance the health of aquatic life, improve public health and safety, and increase the recreational potential of” Minnesota’s water resource, Minnesota Pollution Control Agency (MPCA) proposed a nutrient management plan to guide the state-level nutrient reduction programs (The Minnesota Nutrient Reduction Strategy). This work specifically sought to provide information regarding nutrient reduction from agricultural drainage. Treatment strategies including cover crops, denitrifying bioreactors, treatment wetlands, drainage water management, saturated buffer zones have been studied and implemented to reduce nitrate load leaving rowcrop land. Among which, the bioreactor is simple, effective, and cost. The basic idea is a trench of solid carbon source, such as woodchips [1]. Over the years, researchers have tested a variety of solid carbon sources [3] as well as noncarbon source like pyrite [4]. Woodchips are economically used in the field-scale bioreactors. In Minnesota, corn is the major agricultural commodity products. Labile carbon sources such as corn cobs are readily available under certain management scenarios. Another carbon options that is drawing attention is biochar. Biochar is more known as a soil amendment substrate to retain nitrogen and enhance production [5]. Keeping lowcost and feasibility in mind, the procedure of making biochar in this particular study was made simple by caramelizing woodchip near the wood source.
Two pilot-scale bioreactors (0.98 m*0.2 m*0.75 m with 0.08 m soil on top, see Figure 1 were constructed in the lab to test the effectiveness of two different wood-based media. The two bioreactors simulated horizontal water flow in the field with a length to width ratio of 14:7. Each bioreactor had three chambers as shown in Figure 1. There were 2 baffles in each chamber that helped to guide the flow in order to minimize the dead space under horizontal flow condition. Water entered from the bottom of each chamber and was pushed upwards. One of the bioreactors had transparent sides to provide view of the inside. Both sides were covered with tarp during the experiment period to prevent light effect on microbial growth. At each outlet, a soda bottleshaped container was placed to catch effluent for daily nitrate probe uses. Nutrient water was prepared in the storage tank and pumped into the overhead tank. Six flow meters were used to control the flow rate in each chamber. Soil from a proposed field site (Clarion-Storden loam- clay loams) was used to cap the top. When water was running, the soil on top was always saturated providing anaerobic reaction condition inside. Each chamber was filled with a type of media with one bioreactor being the replica. During the filling process, baffles were sealed and secured after each layer was filled. All media were pre-soaked prior to use. The bioreactors were tilted towards the opening of the baffles each time to make sure all the air was pushed out. Chemicals were mixed with tap water in a 120-gallon tank to simulate typical southern Minnesota drainage water. The water was left in the lab over night before pumped into a 325-gallon tank to ensure a room temperature starting point. The artificial drainage water was pumped into each chamber at the same rate of 50ml/min, equal to a residence time of 24 hours, for three months.
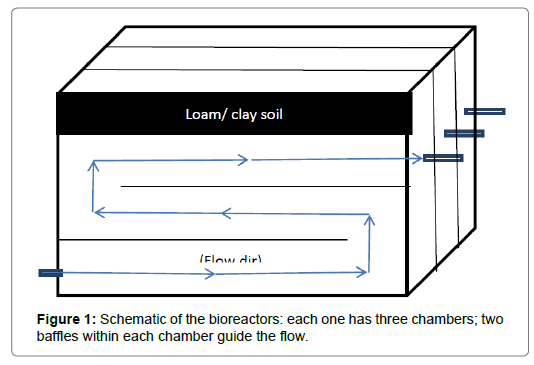
Figure 1: Schematic of the bioreactors: each one has three chambers; two baffles within each chamber guide the flow.
Primary porosity
When woodchips were submerged in the bioreactor, only primary porosity matters in terms of hydraulic property and microbial activity. The primary porosity of each media was measured using Ima and Mann [6]. Woodchips were submerged in a jar of water for 48 hours to become completely saturated; then packed into a beaker at the same packing density as in the bioreactor. A perforated metal baffle sat slightly on top of the woodchips to prevent material floating when adding water. Water was filled right to the top of woodchip pack and the level was marked on the beaker for total volume determination. The whole system was turned upside-down onto a sieve-covered bucket to collect water. It was drained overnight to make sure all the water in between individual woodchip was drained out. The volume of the water represents the primary pore space. Primary porosity was calculated by dividing the volume of water drained out by the total volume. Each media had two replicas. The average porosity was used for calculation. The porosity of woodchip was calculated to be 55%; that of biochar was 53%, and corn cobs’ porosity was 57%.
Experiment preparation
Three media were used for the experiment: woodchip (mixed hardwood), biochar created from the same type of woodchip (caramelized woodchip), and corn cobs. Caramelization occurred at a proposed field site by heating the woodchip underneath burning logs. The idea was to create a high temperature and low oxygen condition for pyrolysis. The media were pre-soaked overnight in the water to minimize volume change when filling up the chambers. Each baffle was installed by hot glue gun in place after filling up each layer. After all layers were filled, loamy soil from the proposed field site was used (Flow dir) to seal the top. The moisture content and organic content of the soil were pre-measured. The moisture content was measured to be 2.47%. The total organic content was 1.52%, and the total nitrogen was 0.117%. The system was then flushed with tap water for a week and drained due to the turbidity of the outflow that affected the nitrate probe reading.
Major nutrients
The water recipe was determined using measured ditch water chemistry. The sample was collected from a drain tile outlet on Elm Creek [7] in May of 2013. The study used a nitrate-nitrogen concentration of 21 mg/l (±1 mg/l). To simulate the groundwater characteristic in southern Minnesota, the calcium concentration was at 80 mg/l. Another nutrient of interest was phosphorus, which was kept around 0.3 mg/l. Other than the nutrients mentioned above, macro nutrients were also added to more precisely simulate the ditch environment for microbial growth.
Water tank volume calibration
A 120-gallon tank was used for water mixing and storage. The usable volume was calibrated before running the experiment. The tank was filled to maximum capacity first. Then the time it took to pump the water all out was recorded, during which, a flow rate was taken every 10 minutes by filling up an 8-L bucket. A rate vs. time curve was plotted and the area underneath the curve was calculated. The total volume was determined by adding up the total area and the volume of the rest of the water that was pumped out after the last rate measurement. The volume available was 117 gallons.
Date collection
Nitrate going in and coming out of each chamber was measured based on a daily time step; while orthophosphate from the same locations was measured every three days. Nitrate and nitrate-nitrogen in and out was measured using HACH nitrate probe sc clear with a sc100 meter. The orthophosphate data was collected by the HACH D890 kit using standard method 79. The type of phosphorus type examined was orthophosphate. Little organic phosphorus (particulate P) is transported by subsurface tile drain; polyphosphate is unstable in water and will be converted to orthophosphate. Other than nitrate and phosphorus, influent temperature was measured everyday using a soil/water thermometer; pH of the inflow and outflow was taken periodically to observe reaction consistency.
Nitrate reduction
The experiment continued for a total of 89 days. The replica treatment for each media matched the results as shown in Figure 2. Average reductions from each media were used in the remaining graphs. A few missing data were included in the analysis by Excel “NA” function and in the statistical software R. Over the three months period, the water temperature fluctuated between 16.07°C to 24.06°C. Temperature in the lab started dropping relatively significantly entering the month of December. The input NO3-N varied from 19.9 mg/l to 21.9 mg/l. Significant reduction (well above 50%) was observed from all three media as indicated in Figures 3 and 4. The raw woodchips showed the highest nitrate reduction rate among all three media. The reduction percentage ranged from 70% to 99% within that temperature range provide above. Initially reduced the nitrate loading really fast compared to the other media. The only major spike observed in both woodchip chambers was after a power outage of nearly 40 minutes. At the very end of the experiment, power was cut for another 40 minute to test the observation. The data showed an upward trend. On average, woodchips provided a 96% nitrate reduction. During the power outage both biochar chambers showed an upward nitrate. Apart from the power disruption, the biochar N removal was less consistent than other media. When comparing the biochar N removal curve with the temperature fluctuation, it appeared to have a tighter relationship than the other two media with temperature. Therefore, a correlation chart was made using R (Chart 1). Woodchip denitrification had almost no correlation with temperature (Table 1). Corn cobs denitrification had a moderate correlation and biochar denitrification showed a correlation of -0.5 with temperature. Within the recorded initial water temperature range, temperature was critical in the amount of reduction by biochar. There was not enough evidence to confirm the correlation outside of the temperature range. The average nitrate reduction from biochar was 72%. Corn cobs denitrification was the most stable observed over the study period. The percentage reduction over time displayed a slope of 0.012 with only one outlier. The average was 92% reduction; and the data ranged from 87% to 99%. Corn cobs also did not spike after the power outage. The current data suggests that corn cob media denitrification is the most resilient to environment changes.
| T | wc1 | wc2 | b1 | b2 | cc1 | cc2 | |
|---|---|---|---|---|---|---|---|
| T | 1 | ||||||
| wc1 | -0.09 | 1 | |||||
| wc2 | -0.05 | 0.79 | 1 | ||||
| b1 | -0.51 | 0.53 | 0.38 | 1 | |||
| b2 | -0.55 | 0.52 | 0.41 | 0.86 | 1 | ||
| cc1 | 0.32 | 0.15 | 0.14 | 0.04 | -0.05 | 1 | |
| cc2 | -0.25 | 0.09 | -0.12 | 0.18 | 0.13 | 0.23 | 1 |
Table 1: Correlation between temperature and outflow.
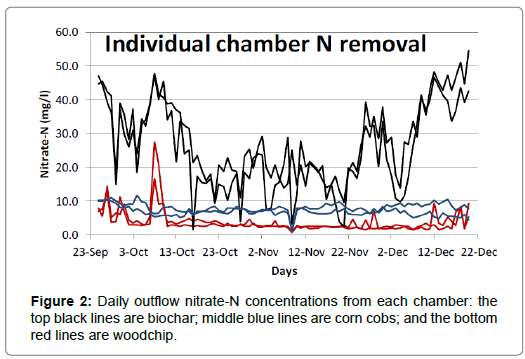
Figure 2: Daily outflow nitrate-N concentrations from each chamber: the top black lines are biochar; middle blue lines are corn cobs; and the bottom red lines are woodchip.
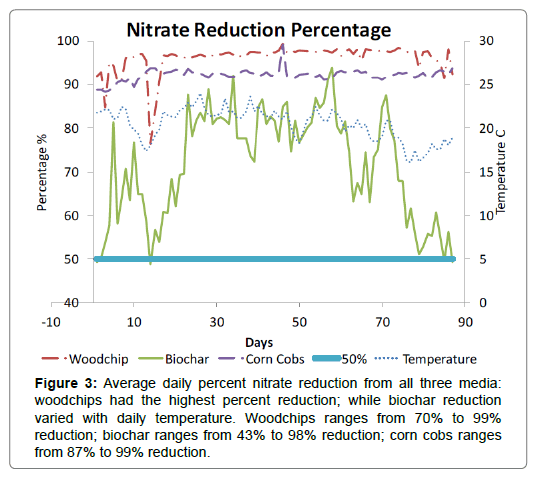
Figure 3: Average daily percent nitrate reduction from all three media: woodchips had the highest percent reduction; while biochar reduction varied with daily temperature. Woodchips ranges from 70% to 99% reduction; biochar ranges from 43% to 98% reduction; corn cobs ranges from 87% to 99% reduction.
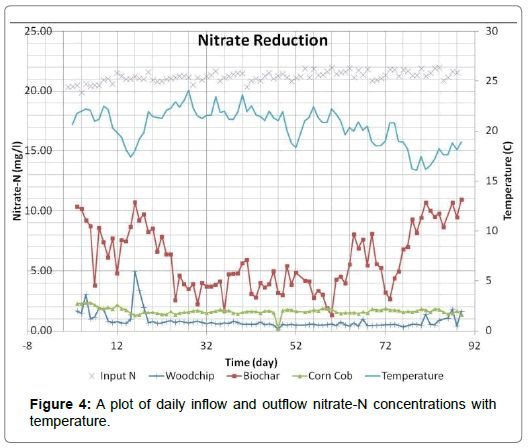
Figure 4: A plot of daily inflow and outflow nitrate-N concentrations with temperature.
Phosphorus reduction
Phosphorus data was collected every 3 days from day 8 to day 89. A HACH colorimeter was used designed for orthophosphate measurement. On average, the woodchips reduced phosphorus by 70% daily, biochar by 80% and corn cobs by 65%. Biochar showed the most promising reduction potential. The outflow phosphate-P concentration from both biochar chambers after day 30 was below the other 4 chambers (Figures 5 and 6). Phosphorus reduction did not have significant correlation with temperature during this experiment. Transformation processes of nitrogen are reasonably well understood; what is less clear where did the sequestered phosphorus go? A surface ion analysis by a Scanning Electron Microscope (SEM) for each media type pre- and post-experiment will be performed to try to detect major ions residing on the surface. If phosphorus is detected, perhaps it could be a way to harvest phosphorus for future reuse. What is unknown at this time is if phosphorus could be either used by microbes or it could be precipitated on different spot. Because there will be a second experiment period right after this, sample collection was highly biased. Only the surface carbon samples were gathered. There is a chance that phosphorus is deposited on the bottom of the In both N and P reductions, biochar showed a similar lag time. It took longer for biochar to reach a desired reduction equilibrium; suggesting that microbes took a longer time to establish colonies on biochar. At the same time, a lower reduction rate, while still meeting the water standard, could possibly be interpreted as slower depletion of the carbon source. If this assumption is true, then this particular type of biochar could be used to increase the life span of the bioreactor [8-20].
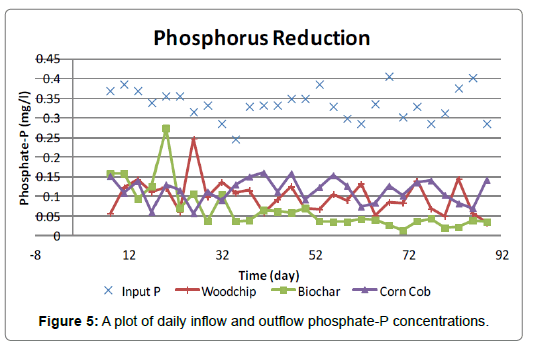
Figure 5: A plot of daily inflow and outflow phosphate-P concentrations.
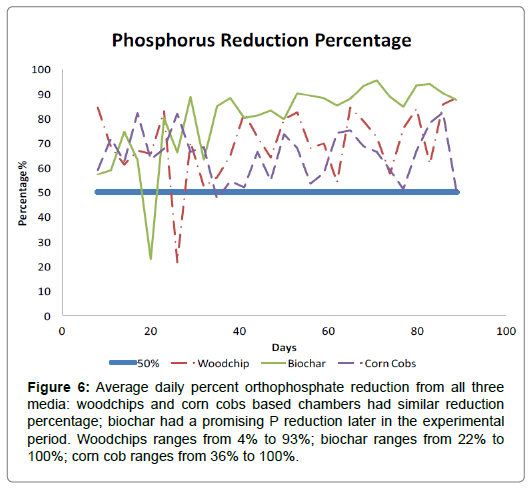
Figure 6: Average daily percent orthophosphate reduction from all three media: woodchips and corn cobs based chambers had similar reduction percentage; biochar had a promising P reduction later in the experimental period. Woodchips ranges from 4% to 93%; biochar ranges from 22% to 100%; corn cob ranges from 36% to 100%.
A bioreactor is an effective way to manage nutrients from leaky row-crop terrain. Data measured in this study showed good potential for N and P reductions from all three media (woodchips, biochar, and corn cobs). In general, woodchips showed the largest denitrification potential; whereas biochar was more favorable for phosphorus removal and may add to system longevity. Corn cobs had the most stable nitrate removal percentage in spite of temperature change and unexpected power disruption. The consistent reduction rate disregarding environmental change demonstrated better environmental resilience among all three of them. This experiment only tested each media individually. The effectiveness of a mixed media may produce a value added synergy. During the experiment, we lacked microbial insight; thus exploring the microbiology aspect of this study could move the science toward better understanding of the hot spot and/or hot moment mechanisms occurring in the bioreactors.
This study was funded by the Minnesota Corn Growers Association. The author would also like to recognize Dr. Rodney Venterea and Dr. Gary Feyereisen for providing advice and instrumentation help