Drug Designing: Open Access
Open Access
ISSN: 2169-0138
ISSN: 2169-0138
Research Article - (2020)Volume 9, Issue 3
The present research aims to microemulsion of anticancer drug specially Imiquimod. Our intention is to design and develop anticancer microemulsion and characterizes the same by applicable and critical parameters. In this research work, Imiquimod is a synthetic anticancer drug which is used to formulate the microemulsion formulation. Imiquimod drug was evaluated by the preliminary tests as color, appearance, nature, melting point, solubility, infrared spectra, determination of λ max, determination of calibration curve, XRD, DSC. The λ max of Imiquimod was found to be at 257 nm. Prepared microemulsion characterized by color, odor, appearance, pH, Viscosity (cp), Staining test, Droplet size (nm), Drug content (%), zeta potential, UV spectroscopy, in vitro drug release study, Thermodynamic stability, surface morphology, NMR study, in vitro anticancer study, Accelerated stability study according to ICH Q1 a guidelines. Then the microemulsions were prepared by factorial design i.e., Design-Expert 12 software (Stat-Ease Inc., USA) was used for designing of experiment, to study interaction between independent variables and dependent variables and deriving optimum formulation. Microemulsion is prepared by water titration method. pH Values of Optimized batch F3 shows 6.00 ± 0. 020 pH. The viscosity Optimized microemulsion F3 batch shows 192 ± 0.024 cp viscosity. Droplet size of Optimized F3 batch shows 222.3 ± 0.23 nm droplet size. Zeta potential values of Optimized batch of F3 shows -32.9 ± 0.018 mV for good stability. The drug content of Batch F3 shows maximum drug content 82.51 ± 0.020%. Staining test is carried out to check type of microemulsion it was observed that all batches of microemulsion is O/W type. Optimized batch F3 shows drug release rate was found to be 91.85 ± 0.018 after 8 hr. Thermodynamic stability study, F3 showed good results with better stability. In vitro anti-cancer activity studies prove that the developed microemulsion formulation can be a promising product in the treatment of cancer. The final product is well acceptable, suitable, easy for applicable and elegant.
Microemulsion; Imiquimod; Anticancer activity; Drug; Batch; Water titration method; Optimization.
Cancer is the leading cause of morbidity and death. It is a group of illnesses that happens as a result of uncontrolled development and abnormal cell proliferation that can even lead to death if it is not controlled. Cancer is a significant society health problem in India with 1.01 million fresh incidences of cancer per year, suggesting that India contributes 7.8% of the worldwide cancer burden as a single country [1]. Skin cancer is cancer of the skin. They are caused by the growth of abnormal cells capable of invading or spreading to other areas of the body. Every year, more than one million fresh incidences are recorded worldwide. Skin cancer treated through topical therapy, radiation therapy, immunotherapy, and surgery. Drug application to the skin as a topical route of administration has improved treatment ability because it exhibits wide surface area. Topical skin cancer treatments include 5-fluorouracil, cobimetinib, dacarbazine and Imiquimod formulations [2].
Microemulsions can be described as stable and isotropic oil, water, surfactant and co-surfactant mixtures. These delivery systems can be used for the application of medicinal agent topical, percutaneous, transdermal, oral, parenteral, and ocular. Generally, microemulsion is within 5-200 nm. In the dispersed phase, the droplet size is very tiny, generally less than 140 nm in diameter. Because of the existence of both lipophilic and hydrophilic domains, these systems can incorporate a broad variety of lipophilic and hydrophilic drugs. Microemulsion have the ability to deliver larger amounts of water and topically applied agents to the skin than water alone or other traditional vehicles such as lotions or creams because they act as a better reservoir for a poorly soluble drug by enhancing its solubilization capacity [3].
Imiquimod is used as a modifier of the immune response. Imiquimod is a synthetic Toll-like receptor 7 (TLR7) agonist that stimulates antitumor-induced innate and cell mediated immunity. Imiquimod doesn't fight wart viruses, it doesn't cure warts. It relieves the production of warts and Controls them. Imiquimod is used for actinic keratosis, basal cell carcinoma. Imiquimod impact on immunity has suggested its possible use in treating a broad range of dermatological conditions where the immune system is believed to play a part in disease regression [4].
Microemulsion can be prepared by Water Titration Method (Phase Titration Method) and Phase Inversion Method. Microemulsion is very hard to characterize, in comparison to their ease of manufacturing, mainly due to their broad variety of structures. Therefore, it is often necessary to use several methods to characterize microemulsion systems. Understanding the vehicle characteristics is a significant necessity to optimize the formulation. Varity of methods such as visual inspection, thermodynamic stability, pH, viscosity measurement, electrical conductivity, stain test, zeta potential is used [5].
Imiquimod (Glenmark Pharmaceuticals, Goa), Tween 60 (Research-Lab Fine Chem. Pvt. Ltd. Mumbai, India), Soya Lecithin (Research-Lab Fine Chem. Pvt. Ltd. Mumbai, India), Coconut oil (Research-Lab Fine Chem. Pvt. Ltd. Mumbai, India).
Characterization of pure drug Imiquimod
Organoleptic properties: The sample of Imiquimod was analyzed for its color, solubility and physical appearance.
Determination of melting point: Melting Point of Imiquimod was determined by open capillary method using Thiele’s tube by direct heating with liquid paraffin with the burner. Minimum three times melting point was taken and average of three readings was taken.
Determination of λ max: 100 mg of pure Imiquimod was dissolved in 100 ml of solvent methanol. Thus 1000 μg/ml (Stock solution) solution was formed. In that 10 ml of stock solution was taken and suitably diluted with 100 ml of methanol solvent. Thus 100 μg/ml (Solution 1) solution was formed. From that (Solution 1) 10 ml was taken and suitably diluted with 100 ml of methanol solvent. Thus 10 μg/ml (Solution 2) solution was formed. This concentration of 10 μg/ml was selected for the analytical wavelength. Then solution was filtered and its UV spectrum was recorded in the wavelength range 400-200 nm.
Preparation of calibration curve of Imiquimod: In the stock solution of 10 μg/ml, 0.2 ml solution was taken and diluted in 10 ml Methanol. Respectively 0.2, 0.4, 0.6, 0.8, 1 ml solution was taken and diluted in 10 ml solvent, and 2 μg/ml-10 μg/ml solutions was prepared respectively. The solutions were then filtered and analyzed spectrophotometrically using UV-spectrophotometer and standard curve was plotted and values of slope, intercept and coefficient of correlation were calculated as shown in Table 1.
| Independent | Levels | ||
|---|---|---|---|
| Low (-1) | Medium (0) | High (+1) | |
| Oil (%) | 17.5 | 20.62 | 23.75 |
| S.mix (%) | 35 | 40 | 45 |
*Indicates: -1=low level, 0=middle level, +1=high level
Table 1: Variable levels of central composite design for microemulsion.
Compatibility studies between drug and excipients
In this study, we examined infrared analysis to detect any interaction (chemical or physical) or formation of bonds between drug and excipients.
Fourier Transforms Infrared Spectrometry (FTIR): To determine and interpret functional groups in drug and excipient was studied by directly taking on the ATR disk and proceed for the next step to monitoring data which was shows the peaks on particular wavelengths. After taking of graphs peaks was found and taken the results for it. The analysis of IR peaks was done by JASCO 4600, Japan spectrometer. From the results data were interpreted with the standard values.
Differrential Scanning Colorimetry (DSC): DSC was performed in order to assess the thermotropic properties and thermal behavior of imiquimod. Samples were sealed in an aluminum crucible and heated then degree celcius/min from 30°C to 300°C in a ten ml/min flow rate nitrogen environment. Thermogram of pure Imiquimod drug was recorded using TAWS Thermal analyzer (Shimadzu).
X-Ray Diffraction (XRD): X-Ray powder diffraction patterns were achieved at room temperature Philips × Pert MPD diffractometer. The system parameters used were laid to the scanning stage size of 0.0170.
Experimental work
Design-Expert software (Design-Expert® version 11. Minneapolis, MN) for the design and optimization of required formulation was used to correlate the responses over required experimental area with less testing technique. Response surface methodology includes different kinds of experimental models. Two factors have been assessed at three different levels in this design and experimental batches have been taken at all 9 possibilities. This study investigated the utility of a 2-factor, 3-level factorial design and optimization process for anticancer microemulsion by water titration method. Amount of Oil (%) X1 and S. mix (%) X2 were selected as the independent variables whereas viscosity (Y1) and % drug release (Y2) selected as dependent variables as shown in Table 2.
| Batches | Drug (%) | Oil (%) | S.mix (%) | Water (%) |
|---|---|---|---|---|
| F1 | 5 | 23.75 | 45 | 27.61 |
| F2 | 5 | 23.75 | 35 | 37.61 |
| F3 | 5 | 17.5 | 35 | 43.86 |
| F4 | 5 | 17.5 | 45 | 33.86 |
| F5 | 5 | 20.62 | 40 | 35.74 |
| F6 | 5 | 20.62 | 35 | 38.74 |
| F7 | 5 | 17.5 | 40 | 40.86 |
| F8 | 5 | 20.62 | 45 | 30.74 |
| F9 | 5 | 23.75 | 40 | 32.61 |
Table 2: Batches of microemulsion.
Formulation of microemulsion
The microemulsion is prepared using component Imiuimod drug, coconut oil as oil phase, Tween 60 as co-surfactant, Lecithin as surfactant, and pH 7.4 as the aqueous phase. Batches were designed using Design-Expert software (Design-Expert® version 11. Minneapolis, MN), for design and optimization is required formulation. The microemulsion containing Imiquimod were prepared by water titration method 49.
1. The weighed amount of imiquimod drug is added in coconut oil this mixture is sonicated for a 30 min.
2. The mixture of imiquimod drug and coconut oil were taken in mortara and these mixtures were triturate for a 5 min.
3. Weighed amount of lecithin is incorporated in drug and oil mixture with continuous trituration after the homogenous mixture was form then Tween 60 added.
4. Trituration was carried out for 30 min till the lecithin fully swell and consistency of the mixture should be smooth and nice. Depending on the nature and origin of lecithin, color might be slightly dark creamy color.
5. After trituration mixture becomes a smooth and homogeneous then addition of water drop by drop with continuous trituration. Due to addition of water mixture get separated in different phases. Then after continuous trituration with a very slow addition of water for about 30 min till the homogenous mixture form.
6. The above homogeneous mixture is then continuously stirred with magnetic stirrer at 250 rpm with continuously addition of water till the Microemulsion form and appearance observed creamy in nature.
Characterization of microemulsion
Organoleptic characteristics: The samples of microemulsion were analyzed for color, odor and physical appearance the tests carried out for the quality purpose.
pH: The pH measurement of the microemulsion were determined by using a pH meter which immersing the electrode directly into the microemulsion.
Viscosity measurement: The viscosity of the prepared microemulsion measured using Brook field DV-II +pro digital viscometer using spindle No. 64 at 62 rpm.
Staining test: Water soluble dye, methylene blue solution of 10 μl was added to the microemulsion. If the continuous phase is water (o/w emulsion), the dye will dissolve uniformly throughout the system. If the continuous phase is oil (w/o emulsion), the dye will remain as cluster on the surface of the system [6].
Fourier Transforms Infrared Spectrometry (FTIR): Infrared spectrum of formulation and physical mixture was recorded using Jasco FTIR 4600, Japan. The scanning range was 650-4000 cm-1 and the sample IR spectrum was achieved with ATR [7].
Globule size: Microemulsions were analyzed for droplet size. The prepared microemulsion diluted with Water with proper dilution. After ensuring complete dispersion of the formulation the droplet size of resultant me was determined by photon correlation spectroscopy that analyzes the fluctuation in light scattering due to the Brownian motion of the droplets as a function of time using a DLS spectrophotometer (Model DLS 700, Malvern Electronics Company Ltd., Japan). The average diameter (Z-AVE) me were determined by using a Malvern (Model DLS 700, Malvern Electronics Company Ltd., Japan) at a fixed angle of 90°C and at 25°C [8].
Zeta potential: Zeta potential of formulations ME was analyzed by using DLS spectrophotometer (Model DLS ±). Drug content: The drug content in each formulation was determined spectrophotometrically at 257 nm, 5 mL of ME formulation was diluted up to 25 mL with phosphate buffer solution 7.4 and centrifuged at 4000 rpm at 25 ± 0.01°C for 60 minutes using REMI Centrifuge. Supernatant was separated and filtered; 1 mL of the supernatant was taken from that solution and diluted to 25 mL of phosphate buffer pH 7.4 [9].
In vitro drug release study
In vitro drug release studies were performed by using Franz diffusion cell. Cell fabricated from borosilicate glass and consisted of two compartments i.e., receptor and donor. The cell and effective receptor surface area is 3.14 cm2. The two halves of the cell was secured in place with the help of strong metallic clips. The temperature of the cell contents was maintained at 37°C ± 1°C with the help of thermostat attached to the magnetic stirrer. The receptor compartment was filled with 23 ml of PBS pH 7.4. The amount of drug released into the receptor solution was determined by 5 ml of sample withdrawal at specific interval. The withdraw volume was replaced of fresh buffer solution. The drug diffuse was determined by analyzing the sample at 257 nm [10,11].
NMR study: The Nuclear Magnetic Resonance (NMR) study was performed out by in DMSO solution using Brucker 300 MHz.
Surface morphological study: Surface morphology of microemulsion was studied by using SEM (VEGA 3 TESTSCAN). Globules were mounted into different, adhesive coated aluminum stubs. Additional particles have been eliminated via tapping the stubs sharply and then slowly spraying a jet of pressurized gas free of particles through all. The SEM was worked with accelerated voltage at high vacuum with accelerate voltage of 1.0 kv.
In vitro anticancer activity
In vitro anticancer study carried on using colon cell line. In vitro study is performed using MTT assay.
Thermodynamic stability: To overcome the problem of metastable formulation, thermodynamic stability tests were performed [12].
a. Centrifugation
The formulation was centrifuged at 3500 rpm for 30 min to ensure physical stability.
b. Stress test
These tests were done to optimize the best microemulsion formulation under extreme conditions. Stress was carried out at 4°C and 45°C for 48 h each for a period of six cycles, followed by 25°C and 21°C for 48 hr for about three cycles. The samples were checked for coalescence, cracking or phase separation.
Accelerated stability study according to ICH Q1 a guidelines
The aim Stabilization testing shall be taken out proof of substance or medicinal product differs over time impact of a multitude Variables of the environment such as temperature, moisture and light, allowing recommended storage circumstances, re-test periods and shelf life. Generally, it takes a long time to observe the rate at which the item degrades at ordinary room temperature. The principles of accelerated stability research are adopted in order to prevent this undesirable delay. For Accelerated stability study optimized batch selected microemulsions were taken in glass vials and were kept at a temperature of 30°C, 40°C and 60°C at ambient humidity condition of 75% RH ± 5% RH. This study is carried out for the three months and evaluation was done for Physical appearance, pH, Viscosity [13].
Pre-formulation study
Characterization of pure drug Imiquimod
Organoleptic properties: Organoleptic tests were carried out to check the quality of drug. The procured sample of pure Imiquimod was analyzed for its color, odor and Nature. The procured drug color was found to be white and crystalline nature. Table 3 shows results of organoleptic properties of Imiquimod.
| Sr no. | Test | Results |
|---|---|---|
| 1 | Color | White |
| 2 | Nature | Crystalline |
Table 3: Organoleptic characters for procured Imiquimod drug.
Determination of drug solubility: The procured drug Imiquimod solubility in coconut oil was found to be 0.045 ± 0.024 mg/ml and solubility in pH 7.4 was found to be 0.0023 ± 0.014 mg/ml. The solubility of procured drug Imiquimod was found as per Table 4.
| Solvents | Solubility mg/ml |
|---|---|
| Coconut oil | 0.045+0.024 |
| Rose oil | 0.0056+0.012 |
| Eucalyptus oil | 0.0042+0.021 |
| pH 7.4 | 0.0023+0.014 |
| Water | 0.0002+0.0011 |
Table 4: Solubility of Imiquimod.
Determination of melting point: The melting point of procured Imiquimod was determined by capillary method. By direct heating with liquid paraffin. The melting point was found to be 295°C-300°C.
Determination of λ max: The Imiquimod solution in methanol having concentration 10 μg/ml was prepared. The prepared concentration was transferred to cuvettes and scanned in the range 400-200 nm by using UV-spectroscopy (Systronics). The λ max of Imiquimod was found to be 257 nm. Figure 1 shows λ max of pure drug Imiquimod.
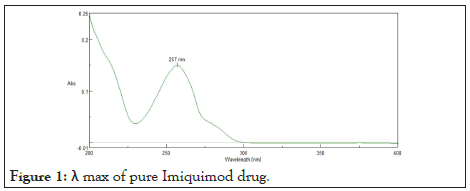
Figure 1: λ max of pure Imiquimod drug.
Calibration curve of Imiquimod
The ranges found in the calibration were obeyed Beer’s lamberts law. Table 5 shows absorbance of Imiquimod by UV spectroscopy at their respective concentration. Figure 2 shows Calibration curve of Imiquimod.
| Concentration (µg/ml) | Absorbance |
|---|---|
| 10 | 0.198 |
| 20 | 0.332 |
| 30 | 0.491 |
| 40 | 0.692 |
| 50 | 0.821 |
Table 5: Absorbance of drug.
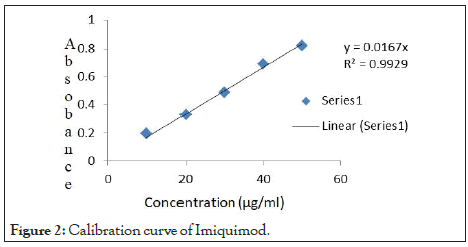
Figure 2: Calibration curve of Imiquimod.
The regression coefficient of above equation was found to be.
y=mx+c
m (Slope)=0.016, c (Intercept)=0
Compatibility study of drug and excipients
Infra-red spectra of drug and excipients
Infra-red spectra of Imiquimod: The IR spectra of pure drug Imiquimod shows strong peak at 725.104 cm-1 stands for cyclic derivatives. Sharp peak at 919.879 cm-1 was found to be for C=C alkenes bending. Medium peak 1372.35 cm-1 shows presence of stretching C=N amine. There is presence of C-N stretch of aliphatic amine at 1413.57 cm-1. Figure 3 shows the sharp peak at 1675.84 cm-1 which shows presence of N-H Bend of a secondary amine group. Medium peak at 1793.47 cm-1 shows the presence of stretching C=C Cyclic alkene group. IR spectra for procured Imiquimod drug in Table 6.
| Sr no. | Wave number (cm-1) |
Type of vibration | Functional group |
|---|---|---|---|
| 1 | 725.104 | - | Cyclic derivatives |
| 2 | 919.879 | Bending | C=C Alkene |
| 3 | 1372.35 | Stretching | C=N Amino |
| 4 | 1413.57 | Stretching | C-N |
| 5 | 1675.84 | Bending | N-H |
| 6 | 1793.47 | Stretching | C=C Cyclic alkene |
| 7 | 3046.98 | Stretching | C-H |
Table 6: IR Interpretation data of procured imiquimod drug.
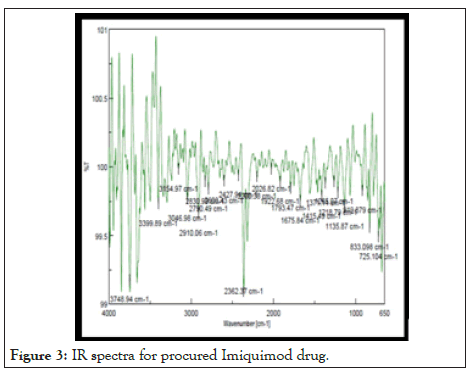
Figure 3: IR spectra for procured Imiquimod drug.
Infra-red spectra of combination: The IR spectra of pure drug+Oil+S.lecithin+Tween 60 in Figure 4 shows strong peak at 698.10 cm-1 and 844.66 cm-1 stands for C=C bending. Sharp peak at 1085.73 cm-1 was found to be for C-N stretching. Medium peak 1224.58 cm-1 shows presence of stretching C-O. There is presence of O-H bending at 1353.78 cm-1. Peak at 1457.92 cm-1 which shows presence of C-H Bend. Medium peak at 1731.76 cm-1 shows the presence of stretching C=O. Sharp peak at 2850.27 cm-1 and 2919.7 stands for stretching C-H group in Table 7. Peak at 3014.19 cm-1 and 3268.75 cm-1 stand for O-H stretching.
| Sr no | Wave number (cm-1) | Type of vibration | Functional group |
|---|---|---|---|
| 1 | 698.1 | Bending | C=C |
| 2 | 844.66 | Bending | C=C |
| 3 | 1085.73 | Stretching | C-N |
| 4 | 1224.58 | Stretching | C-O |
| 5 | 1353.78 | Bending | O-H |
| 6 | 1457.92 | Bending | C-H |
| 7 | 1731.76 | Stretching | C=O |
| 8 | 2850.27 | Stretching | C-H Aldehyde |
| 9 | 2919.7 | Stretching | O-H |
| 10 | 3014.19 | Stretching | O-H |
| 11 | 3268.75 | Stretching | O-H |
Table 7: IR Interpretation data of procured combination.
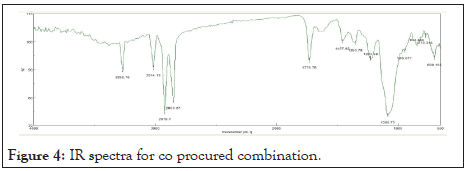
Figure 4: IR spectra for co procured combination.
Differential Scanning Calorimetry (DSC): Differential Scanning Calorimetry (DSC) is the most frequently used thermal analysis technique. DSC is used to measure enthalpy changes due to changes in the physical and chemical properties of a material as a function of temperature or time. DSC shows sharp peak at 301.6°C. DSC thermogram of Imiquimod in Figure 5.
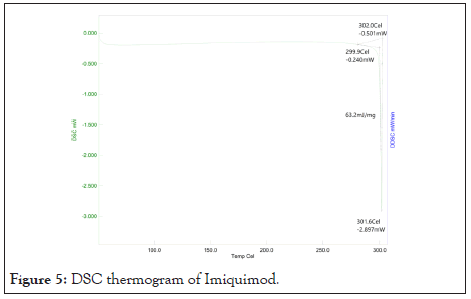
Figure 5: DSC thermogram of Imiquimod.
X-ray diffractometry: Distinct less diffused peaks in the X-ray diffraction spectrum indicates that Imiquimod present a crystalline material. Sharper diffraction peaks indicate more crystalline drug. The XRD of Imiquimod in Figure 6.
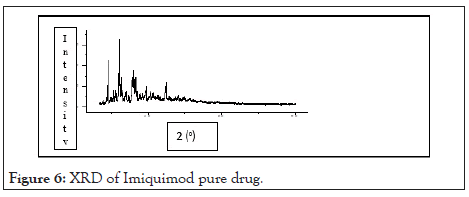
Figure 6: XRD of Imiquimod pure drug.
Characterization of microemulsion
Organoleptic characters:The batches of microemulsion were analyzed for quality checking as color, odor, melting point and physical appearance in Table 8. The color of nine batches of microemulsion shows creamy with pleasant odor and thick form. Batches of microemulsion in Figure 7.
| Sr no. | Test | Result |
|---|---|---|
| 1 | Color | Creamy reddish white |
| 2 | Odor | Pleasant |
| 3 | Nature | Thick |
Table 8: Properties of all batches of microemulsion.
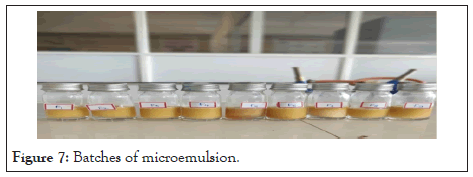
Figure 7: Batches of microemulsion.
pH: Table 9 shows the resultant pH Values of microemulsion in the range of 6.00 ± 0. 020 to 7.02 ± 0.034. This range is suitable for the topical formulation. From the result, it was found that formulations showed increased pH with increased S/Cos ratio. Batch F3 shows lower pH value because of less S/Cos concentration. pH of Microemulsion batches in Figure 8.
| Batches | pH |
|---|---|
| F1 | 7.02+0.034 |
| F2 | 6.69+ 0.023 |
| F3 | 6.00+0. 020 |
| F4 | 6.04+0.012 |
| F5 | 6.65+0.011 |
| F6 | 6.53+0.021 |
| F7 | 6.02+0.022 |
| F8 | 6.68+0.026 |
| F9 | 6.76+0.014 |
Table 9: pH of microemulsion batches.
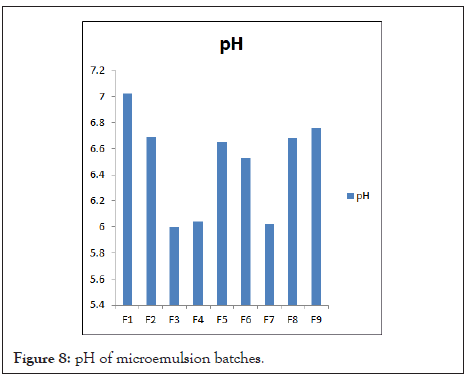
Figure 8: pH of microemulsion batches.
Viscosity measurement: The structure and type of microemulsion characterized by viscosity measurement. The viscosity of microemulsion was ranged between 192 ± 0.024 cp to 290 ± 0.014 cp was shown in Table 10. High content of S/Cos ratio and oil Shows high viscosity of formulations. F3 formulation showed more water quantity with less surfactant having large microemulsion region with low viscosity. Viscosity of microemulsion batches in Figure 9.
| Batches | Viscosity (cp) |
|---|---|
| F1 | 290+0.014 |
| F2 | 280+0.023 |
| F3 | 192+0.024 |
| F4 | 220+0.021 |
| F5 | 257+0.012 |
| F6 | 225+0.014 |
| F7 | 212+0.016 |
| F8 | 275+0.011 |
| F9 | 282+0.017 |
Table 10: Viscosity of microemulsion batches.
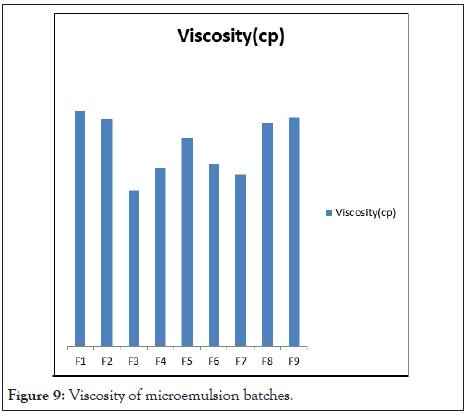
Figure 9: Viscosity of microemulsion batches.
Staining test: Water soluble dye, methylene blue solution was added in all batches of microemulsion, the dye will dissolve uniformly throughout the all batches, so the continuous phase was water. Formulations F3 show a good result compare to other formulation.
FT-IR spectra of imiquimod microemulsion: Table 11 shows the IR spectra of imiquimod microemulsion shows strong peak at 698.10 cm-1 and 838.88 cm-1 stands for C=C bending. Sharp peak at 1087.663 cm-1 was found to be for C-N stretching. There is presence of O-H bending at 1353.78 cm-1. Peak at 1457.92 cm-1 which shows presence of C-H Bending of methyl group. Medium peak at 1652.7 cm-1 for C=C Stretching. Peak at 1733.69 cm-1 shows the presence of stretching C=O. Sharp peak at 2850.27 cm-1 and 2902.34 stands for stretching C-H of alkane group. Peak at 3031.55 cm-1 and 3288.04 cm-1 stand for O-H stretching. IR spectra of microemulsion in Figure 10.
| Sr no | Wave number (cm-1) | Type of vibration | Functional group |
|---|---|---|---|
| 1 | 698.1 | Bending | C=C |
| 2 | 838.88 | Bending | C=C |
| 3 | 1087.66 | Stretching | C-N |
| 5 | 1359.57 | Bending | O-H |
| 6 | 1457.92 | Bending | C-H |
| 7 | 1733.59 | Stretching | C=O |
| 8 | 2850.27 | Stretching | C-H Aldehyde |
| 9 | 2902.34 | Stretching | C-H |
| 10 | 3031.55 | Stretching | O-H |
| 11 | 3288.04 | Stretching | O-H |
Table 11: IR spectra of microemulsion.
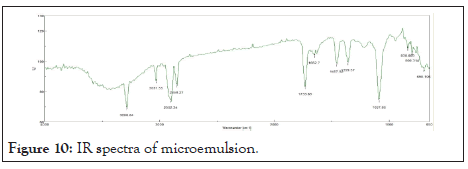
Figure 10: IR spectra of microemulsion.
Globule size: Resultant globule size analysis showed with maximum intensity in Table 12. Droplet size of prepared microemulsion is between 222.3 ± 0.23 nm to 398.2 ± 0.12 nm. F3 batch shows 222.3 ± 0.23 nm because of less S. mix contain. Globule size spectra of microemulsion formulation in Figures 11 and 12.
| Batches | Globule size (nm) |
|---|---|
| F1 | 398.2+0.12 |
| F2 | 357.4+0.15 |
| F3 | 222.3+0.23 |
| F4 | 325.8+0.11 |
| F5 | 348.6+0.14 |
| F6 | 336.2+0.12 |
| F7 | 319.4+0.18 |
| F8 | 356.2+0.14 |
| F9 | 360.6+0.21 |
Table 12: Globule size of microemulsion batches.
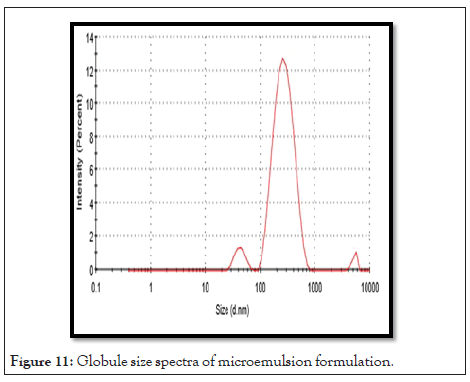
Figure 11: Globule size spectra of microemulsion formulation.
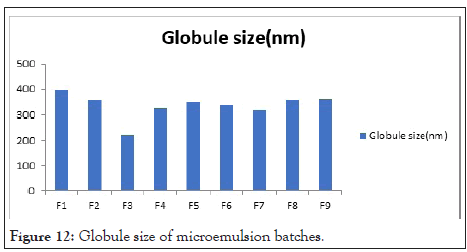
Figure 12: Globule size of microemulsion batches.
Zeta potential: Zeta potential values of microemulsion ranges from -21.3 ± 0.012 mV to -32.9 ± 0.018 mV was shown in Table 13. Indication negative charge on the droplet surface which prevents aggregation of droplet. Zeta potential of F3 batch is -32.9 ± 0.018 mV shows good stability. Zeta potential spectra of microemulsion formulation in Figure 13.
| Batches | Zeta potential (mV) |
|---|---|
| F1 | -21.288 |
| F2 | -25.185 |
| F3 | -39.882 |
| F4 | 28.9+0.021 |
| F5 | -26.683 |
| F6 | -29.788 |
| F7 | -30.081 |
| F8 | -25.475 |
| F9 | -23.284 |
Table 13: Zeta potential of microemulsion batches.
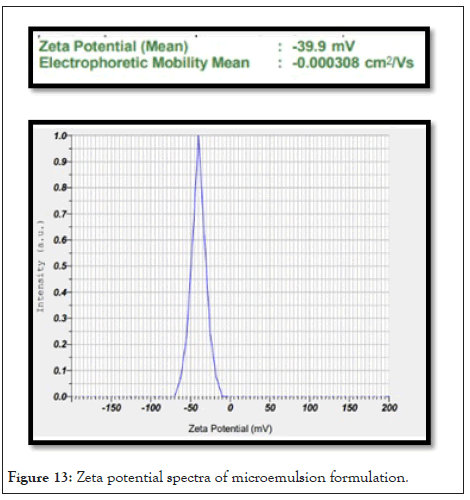
Figure 13: Zeta potential spectra of microemulsion formulation.
Drug content: The drug content of microemulsion formulation was 52.10 ± 0.021% to 82.51 ± 0.020% was shown in Table 14. Batch F3 shows maximum drug content 82.51 ± 0.020%. It was observed that, as the conc. of S. mix decreased, the drug content is increased. F1 batch shows minimum drug content 52.10 ± 0.02 1% because of increased S. mix concentration. F3 batch shows 82.51 ± 0.020% high drug content. Drug content of microemulsion batches in Figure 14.
| Batches | Drug content (%) |
|---|---|
| F1 | 52.10+0.021 |
| F2 | 60.32+0.024 |
| F3 | 82.51+0.020 |
| F4 | 75.61+0.015 |
| F5 | 68.75+0.022 |
| F6 | 72.81+0.015 |
| F7 | 79.89+0.016 |
| F8 | 64.82+0.027 |
| F9 | 56.12+0.021 |
Table 14: Drug content of microemulsion batches.
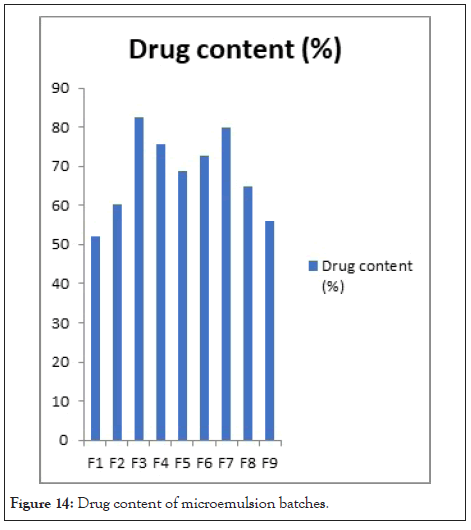
Figure 14: Drug content of microemulsion batches.
In vitro drug release study: The diffusion of the Imiquimod from the microemulsion was depending on the concentration of oil: S. mix. Amounts of drug release after 8 hr were ranged between 91.85 ± 0.018% to 69.23 ± 0.03% respectively was shown in Table 15. Amount of the drug released from the formulation through the diffusion membrane was completely related to the amounts of oil and S. mix. F3 had high drug release compared to other microemulsion. It indicated that if the increase in the concentration of oil, the release of the drug decreases. Among all nine Batches, F3 showed highest drug release after 8 hrs. % In-vitro drug release for microemulsion batches in Figure 15.
| Time (Hr) | Drug release (%) | ||||||||
|---|---|---|---|---|---|---|---|---|---|
| F1 | F2 | F3 | F4 | F5 | F6 | F7 | F8 | F9 | |
| 0 | 0 | 0 | 0 | 0 | 0 | 0 | 0 | 0 | 0 |
| 1 | 10.23+0.021 | 11.57+0.025 | 19.54+0.022 | 15.34+0.024 | 12.53+0.022 | 11.65+0.021 | 18.75+0.01 | 14.23+0.013 | 10.88+0.012 |
| 2 | 15.75+0.032 | 21.76+0.026 | 31.54+0.021 | 23.47+0.026 | 22.34+0.029 | 20.23+0.02 | 29.43+0.014 | 24.54+0.019 | 18.76+0.013 |
| 3 | 22.35+0.021 | 32.98+0.028 | 46.87+0.019 | 36.64+0.027 | 35.45+0.02 | 34.41+0.021 | 48.88+0.017 | 37.84+0.014 | 29.52+0.015 |
| 4 | 34.56+0.025 | 43.58+0.029 | 54.76+0.026 | 48.53+0.021 | 45.76+0.023 | 47.52+0.025 | 59.64+0.011 | 44.43+0.016 | 39.47+0.017 |
| 5 | 48.96+0.027 | 56.78+0.032 | 62.98+0.018 | 60.74+0.022 | 57.65+0.025 | 59.31+0.022 | 65.83+0.015 | 54.45+0.018 | 48.65+0.014 |
| 6 | 53.87+0.026 | 69.54+0.028 | 76.45+0.012 | 71.43+0.028 | 70.82+0.021 | 72.42+0.021 | 78.42+0.018 | 61.11+0.011 | 56.45+0.013 |
| 7 | 60.45+0.028 | 72.56+0.024 | 82.56+0.011 | 77.64+0.023 | 73.45+0.021 | 75.32+0.023 | 81.37+0.016 | 69.31+0.013 | 68.54+0.018 |
| 8 | 69.23+0.032 | 76.14+0.012 | 91.85+0.018 | 85.34+0.021 | 81.16+0.022 | 82.12+0.026 | 90.25+0.014 | 78.12+0.018 | 74.18+0.014 |
Table 15: In-vitro drug release of microemulsion batches.
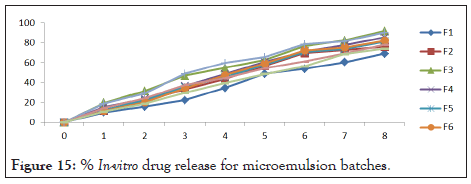
Figure 15: % In-vitro drug release for microemulsion batches.
NMR: Optimized microemulsion batch F3 was analyzed for NMR was shown in Table 16. Prominent peaks were observed for 1 H NMR of Imiquimod in Figure 16. The presence of molecular fragments indicated that the formulation retained active nucleus and functional groups of drug Imiquimod in the composite after the preparation.
| Sr no | Chemical shift ( δ ) | Assignment |
|---|---|---|
| 1 | 6.899 | 2=NH2 |
| 2 | 7.057 | 4=H near benzene Ring |
| 3 | 7.385 | |
| 4 | 7.426 | |
| 5 | 7.457 | |
| 6 | 0.849 | 4=near cyclopentane ring |
| 7 | 1.253 | |
| 8 | 2.289 | |
| 9 | 3.749 |
Table 16: NMR of microemulsion.
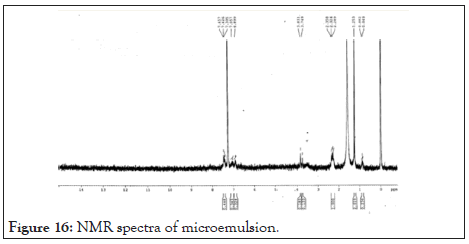
Figure 16: NMR spectra of microemulsion.
Surface morphological study: Optimized microemulsion batch F3 was analyzed for surface characterization using Scanning Electron Microscopy was shown in Table 17. The drug is present in a completely dissolved state in the microemulsion. Figure 17 concludes that particles are globular with globule size in the nanometer scale.
| Sr no | Compounds | ABS | Percentage of cell inhibition | IC50 (µg/ml) |
|---|---|---|---|---|
| 1. | Control | 0.075 | - | 837.22 |
| 2. | Std 5FU (20 µg/ml) | 0.023 | 69.33 | |
| 3. | Sample 1 (100 µg/ml) | 0.051 | 32 | |
| 4. | Sample 1 (200 µg/ml) | 0.045 | 40 | |
| 5. | Sample 1 (400 µg/ml) | 0.039 | 48 | |
| 6. | Sample 1 (800 µg/ml) | 0.038 | 49.33 | |
| 7. | Sample 1 (1000 µg/ml) | 0.036 | 52 |
Table 17: Effects of drug against colon 205 cell line by MTT assay.
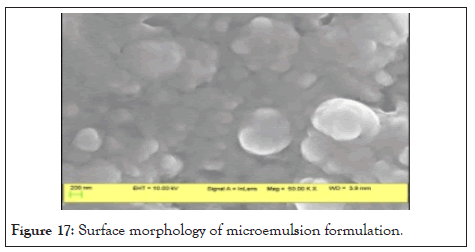
Figure 17: Surface morphology of microemulsion formulation.
In vitro anticancer activity: At the Concentration 1000 μl/ml and Sample showed good activity against COLO 205 cell line.
Thermodynamic stability: Thermodynamic stability Thermodynamic stability tests were performed by,
a) Centrifugation
Formulations F1, F2 and F9 clearly separated into two phases after centrifugation, which was separated, and rejected. The centrifugation tests revealed that microemulsion formulations F4, F7, F3, F5, F6 and F8 were remained homogenous without any phase separation throughout the test indicates good physical stability and taken for further study.
b) Stress test
As per following data, only five formulations passed through different stress conditions as shown in Table 18. Formulation F4, F7, F3, F6 was passed the centrifugation and stress test. Microemulsion formulations F3 and F7 showed good results with better stability as shown in Figure 18.
| Batch | Centrifugation | 25°C to 30°C | 45°C | 4°C |
|---|---|---|---|---|
| F1 | × | ü | × | × |
| F2 | × | ü | ü | × |
| F3 | ü | ü | ü | ü |
| F4 | ü | ü | ü | ü |
| F5 | ü | ü | ü | × |
| F6 | ü | ü | ü | ü |
| F7 | ü | ü | ü | ü |
| F8 | ü | ü | ü | × |
Table 18: Centrifugation and stress study of microemulsion batches.
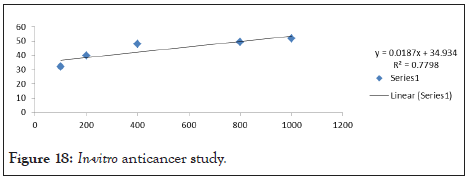
Figure 18: In-vitro anticancer study.
Accelerated stability study: Optimized F3 batch is analyzed for the accelerated stability study. For accelerated stability studies, samples were withdrawn at an interval of 0,1,2,3 months. The accelerated stability study was as follows in Table 19.
| Temperature | 75%RH ± 5%RH | |||
|---|---|---|---|---|
| Month | Physical appearance | pH | Viscosity | |
| 30 ± 0.5°C | 0 | Creamy reddish white colour | 7.02+0.034 | 290+0.014 |
| 1 | Creamy reddish white colour | 7.02+0.034 | 290+0.014 | |
| 2 | Creamy reddish white colour | 7.02+0.034 | 290+0.014 | |
| 3 | Creamy reddish white colour | 7.07+0.032 | 295+0.019 | |
| 40 ± 0.5°C | 0 | Creamy reddish white colour | 7.02+0.034 | 290+0.014 |
| 1 | Creamy reddish white colour | 6.70+0.021 | 280+0.011 | |
| 2 | Creamy reddish white colour | 6.56+0.013 | 278+0.010 | |
| 3 | Creamy reddish white colour | 6.04+0.034 | 260+0.012 | |
| 60 ± 0.5°C | 0 | Creamy reddish white colour | 6.02+0.021 | 190+0.018 |
| 1 | Creamy reddish white colour | 5.59+0.024 | 189+0.014 | |
| 2 | Creamy reddish white colour | 5.40+0.031 | 178+0.011 | |
| 3 | Creamy reddish white colour | 5.02+0.010 | 154+0.013 | |
Table 19: Stability study of microemulsion.
Statistical analysis of data by design expert software: Effect of 2 variables, each at 3 levels and the possible 9 combinations of microemulsion. The conc. of oil (X1) and conc. of S.mix (X2) are used as independent variables. The viscosity (Y1), % DR (Y2) used as dependent variables. The data obtained by experiment work were analyzed statistically using Design-Expert 11 software (Stat- Ease Inc., USA) was shown in Table 20.
| Batches | Independent variables | |||
|---|---|---|---|---|
| X1 | X2 | Y1 | Y2 | |
| F1 | 23.75 | 45 | 290 | 69.23 |
| F2 | 23.75 | 35 | 280 | 76.14 |
| F3 | 17.5 | 35 | 192 | 91.85 |
| F4 | 17.5 | 45 | 220 | 85.34 |
| F5 | 20.625 | 40 | 257 | 81.16 |
| F6 | 20.625 | 35 | 225 | 82.12 |
| F7 | 17.5 | 40 | 212 | 90.25 |
| F8 | 20.625 | 45 | 275 | 78.12 |
| F9 | 23.75 | 40 | 282 | 74.18 |
Table 20: Summary of experimental design.
Effect of X1 and X2 on Y1 (Viscosity)
Counter plot and 3-D response surface plot of viscosity: Counter plot (Figure 19) and 3-D response surface plot Figure 20 indicates regions where oil and S.mix in the microemulsion formulation influence viscosity of microemulsion. It was determined from counter plot that viscosity of microemulsion incresed with incresed conc of s.mix and oil. S.mix and oil increased with viscosity increased.
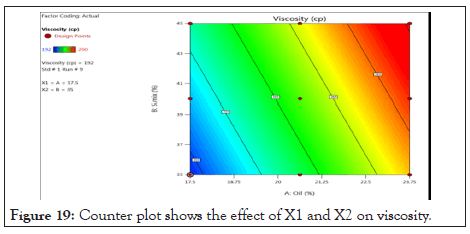
Figure 19: Counter plot shows the effect of X1 and X2 on viscosity.
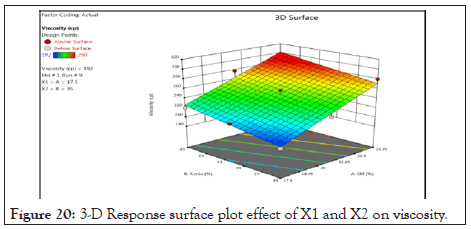
Figure 20: 3-D Response surface plot effect of X1 and X2 on viscosity.
Normal probability graph and perturbation plot of viscosity: In following Figure 21, points follow a straight line which shows residual follow normal distribution. From this observation it can concluded that the normal probability distribution indicates non- significant effect on variable distributed around the straight line. In Figure 22 for response (Y1) viscosity the graph indicates that steep line is observed for factor A (Oil) and for factor B (S.mix) which indicates that factor A and factor B influence the viscosity.
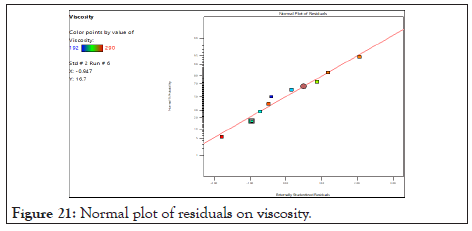
Figure 21: Normal plot of residuals on viscosity.
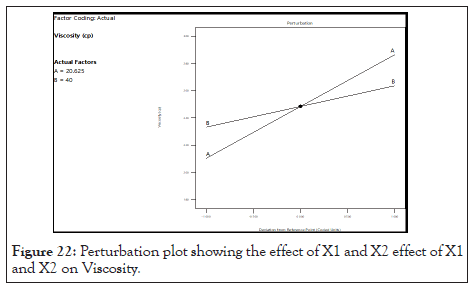
Figure 22: Perturbation plot showing the effect of X1 and X2 effect of X1 and X2 on Viscosity.
Analysis of variance for viscosity: Table 21 showed the ANOVA for the Viscosity.
| Source | Sum of Squares | Df | Mean Square | F-value | p-value | Significant |
| Model | 10044.17 | 2 | 5022.08 | 48.28 | 0.0002 | |
| A-Oil | 8664 | 1 | 8664 | 83.3 | <0.0001 | |
| B-S.mix | 1380.17 | 1 | 1380.17 | 13.27 | 0.0108 | |
| Residual | 624.06 | 6 | 104.01 | |||
| Cor Total | 10668.22 | 8 |
| Std dev | 10.2 | R2 | 0.9415 |
| Mean | 248.44 | Adjusted R2 | 0.922 |
| C.V.% | 4.1 | Predicted R2 | 0.8609 |
| Adeq Precision | 18.059 |
Table 21: Analysis of variance of viscosity.
The final equation in terms of actual factors generated for response Y1 (Viscosity) is given in equation
Y1 (Viscosity)=+138.855+12.160X1+3.033X2
The polynomial equation indicates the quantitative effect of all two formulation variables (X1, X2) represents the main effects. Positive sign and negative sign indicate the synergistic and antagonistic effect, respectively on the response Y1. Response Y1 shows positive relationship with X1, X2. Which indicate that as the concentration of Oil and S.mix increase, the Viscosity also increases?
Effect of X1 and X2 on Y2 (% Drug release)
Counter plot and 3D Response surface plot of % drug release: Counter plot as Figure 23 and 3-D Response surface plot as Figure 24 indicates regions were the oil and S.mix in microemulsion formulation influences the drug release. It was observed that as the concentration of oil and S.mix increases the % DR decreases.
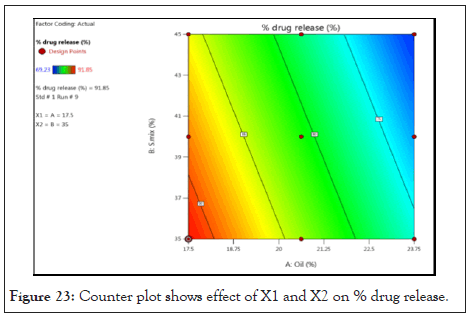
Figure 23: Counter plot shows effect of X1 and X2 on % drug release.
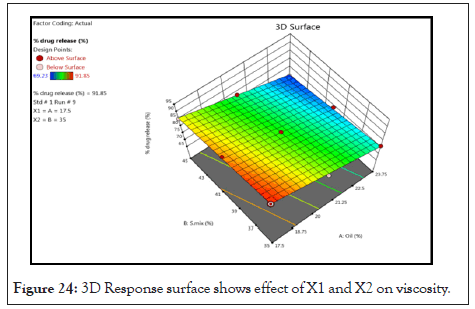
Figure 24: 3D Response surface shows effect of X1 and X2 on viscosity.
Normal probability graph and pertubation graph of % drug release: In following Figure 25 points follow the straight line which shows residual follow normal distribution. From this we can concluded that the normal probability distribution indicates nonsignificant effect on variable distributed around the straight line. In Figure 26 for response (Y2) drug release the graph indicates that steep line is observed for factor A (oil) and for factor B (S.mix) which indicate that factor A and factor B influence the drug release.
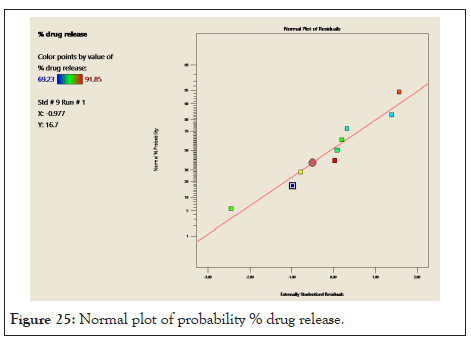
Figure 25: Normal plot of probability % drug release.
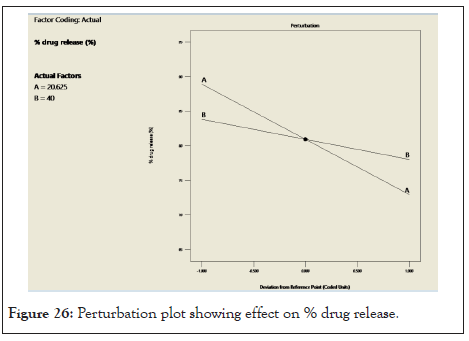
Figure 26: Perturbation plot showing effect on % drug release.
Analysis of variance for drug release
The Final Equation in Terms of Actual Factors generated for response Y2 (% drug release) is given in equation, Y2 (% drug release)=-89.678+2.554X1+0.580667X2
The polynomial equation indicates the quantitative effect of all two formulation variables (X1, X2) represents the main effects. Which indicate that as the concentration of oil and S.mix increases, then drug release decreases was shown in Table 22.
| Source | Sum of squares | df | Mean square | F-value | p-value | Significant |
| Model | 432.82 | 2 | 216.41 | 173.12 | < 0.0001 | |
| A-Oil | 382.24 | 1 | 382.24 | 305.77 | < 0.0001 | |
| B-S.mix | 50.58 | 1 | 50.58 | 40.46 | 0.0007 | |
| Residual | 7.5 | 6 | 1.25 | |||
| Cor Total | 440.32 | 8 |
| Std. Dev. | 1.12 | R2 | 0.983 |
| Mean | 80.93 | Adjusted R2 | 0.9773 |
| C.V.% | 1.38 | Predicted R2 | 0.9638 |
| Adeq Precision | 33.7249 | ||
| Precision |
Table 22: Analysis of variance for drug release.
Optimization of microemulsion
Criteria for optimization microemulsion: Central composite design was used to optimize main effects, interaction effects, linear effects and quadratic effects of the formulation ingredients on the Viscosity (Y1), % drug release (Y2) of microemulsion was developed by choosing the desired goal for each factor and response. There is the possible input optimization that can be selected as the range maximum, minimum, target and none were shown in Table 23.
| Name | Unit | Lower limit | Upper limit | Goal |
|---|---|---|---|---|
| A. Oil | % | 17.5 | 23.75 | In range |
| B. S.mix | % | 35 | 45 | In range |
| Y1. Viscosity | Cp | 192 | 290 | Minimum |
| Y2. % Drug R release | % | 69.23 | 91.85 | Maximum |
Table 23: Criteria for optimization of microemulsion.
Numerical optimization
The numerical optimization was developed by choosing the desired goal for each factor and response. There in, the possible input optimizations that can be selected include: the range, maximum, minimum, target, none (for responses) and set so as to establish an optimized output value for a given set of conditions. In this study the goals for optimization were to maximum % Drug release, and minimum viscosity. Desirability ramp showing optimum conditions to formulate patches as Oil=17.5, S.mix=35 to achieve Viscosity=195.27, drug release (%)=91.81 with desirability 0.991 (Figure 27).
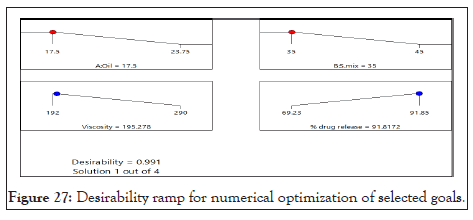
Figure 27: Desirability ramp for numerical optimization of selected goals.
The bar graph Figure 28 indicates the overall desirability of the responses. The optimal region values have the overall desirability value of 0.991 indicating closeness to target response.
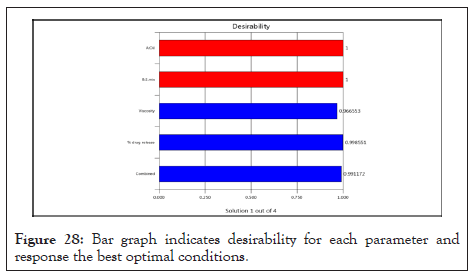
Figure 28: Bar graph indicates desirability for each parameter and response the best optimal conditions.
Graphical optimization
The goals for optimization in this study were to maximizing % drug release and minimum viscosity within 8 hours. Figure 29 shows the optimum condition/central points of the best combination regions (optimum) corresponding to the following processing factors: Oil (%)=17.5 and S.mix (%)=35. These conditions estimated the formulate of microemulsion with viscosity (cp)=192 and in vitro drug release (%)=91.85, for that reasons batch F3 selected as optimized batch.
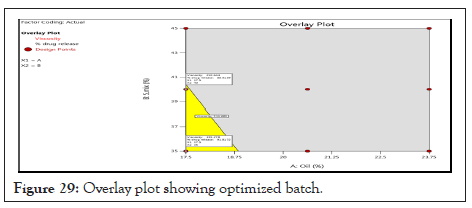
Figure 29: Overlay plot showing optimized batch.
Pre-formulation studies of drug was characterized for various tests like organoleptic properties, melting point, UV and FTIR spectroscopic analysis, Differential scanning colorimetery, X-ray diffractometery. By the all preformulation studies we found that drug analyzed for quality and the results obtained are matched with the specifications.
Design, development and characterization of microemulsion by using Design-Expert software (Design-Expert® version 11. Minneapolis, MN) were done in present research containing imiquimod to cure of skin cancer. It gives 9 batches for optimization of imiquimod containing microemulsion. In this design 2 factors were studied at 3 different levels. Amount of oil (%) X1 and Smix (%) X2 were selected as the independent variables whereas viscosity (Y1) and % drug release (Y2) selected as dependent variables. Concentrations used in formulations for oil (%) are low (-1)=17.5, medium (0)=20.62 and high (+1)=23.75, while for S.mix (%) low (-1)=35, medium (0)=40 and high (+1)=45.
Imiquimod containing anticancer microemulsion prepared using water titration method. The prepared microemulsion batches (F1-F9) were characterized for different parameters like pH, Viscosity (cp), Staining test, Droplet size (nm), Drug content (%), determination of zeta potential, UV spectroscopy, In vitro drug release study and Thermodynamic stability of prepared microemulsion. FTIR spectra research verified compatibility between medication and excipient. In FTIR spectroscopy study drug-excipients mixture shows all characteristics peaks of drugs present which confirms drug and all excipients are compatible to each other.
Optimized formulation, F3 was reddish creamy white and thick solution. Optimized F3 batch further evaluated for determination of scanning electron microscopy, in vitro anticancer study, NMR study, Accelerated stability study according to ICH Q1a guidelines. Optimized F3 batch were analyzed to determine their zeta potential values for the good stability. For optimized formulation (F3) has zeta potential value -32.9 ± 0.018 mV indicating good stability. Staining test is carried out to check type of microemulsion it was observed that all batches of microemulsion is O/W type. F3 batch of microemulsion gives good result of staining test. Batch F3 was analyzed for surface characterization using Scanning Electron Microscopy. Particles are globular with globule size in the nanometer scale. In the in vitro drug release study, the drug release rate was found to be 91.85 ± 0.018 after 8 hr, depends upon concentration of S.mix. Thermodynamic stability is carried out by centrifugation and stress test. F3 showed good results with better stability. In vitro anti-cancer activity studies proves that the developed microemulsion formulation can be a promising product in the treatment of cancer. After the incorporation of the drug, the F3 batch of imiquimod containing microemulsion remained stable and no phase separation. Microemulsion system helps increase the solubility of drug.
Citation: Rajaram SV, Ravindra PP, Shripal MC (2020) Microemulsion Drug Delivery of Imiquimod as Anticancer Agent for Skin Cancer Therapy and its Evaluation. Drug Des. 9:170.
Received: 28-Aug-2020 Accepted: 11-Sep-2020 Published: 18-Sep-2020 , DOI: 10.35248/2169-0138.20.9.170
Copyright: © 2020 Rajaram SV, et al. This is an open-access article distributed under the terms of the Creative Commons Attribution License, which permits unrestricted use, distribution, and reproduction in any medium, provided the original author and source are credited.