Cell & Developmental Biology
Open Access
ISSN: 2168-9296
ISSN: 2168-9296
Research Article - (2017) Volume 6, Issue 2
A two-parameter model describes the microbial growth trend of planktonic cultures. Based on the assumption that cell duplication underlies the growth, the model defines an average generation time that depends on time and complies with the phenomenological evidence that the growth rate is naught at the start and at the end of the process. This is tantamount as to replace the real growth process with a virtual one, where all the generation lines stemming from the inoculum are synchronous and imply a duplication tree with no truncated branches. A simple function that complies with these constraints is τ=(a/t+bt), where a and b are parameters defined through a best fit treatment of the experimental plate count data. Surprisingly simple relationships come out for specific items of the growth trend, like maximum specific growth rate, eventual cell number, Nmax, duration of lag phase, etc., as well as some intriguing correlations between them. Published plate count data allowed testing the reliability of the model. The agreement is satisfactory being in line with the accuracy of the data (R2 ≥ 0.98).
<Keywords: Duplication model; Plate count fit; Correlated growth parameters
The phenomenology of microbial effects in food and animal or vegetal tissues is mainly related to the number of cells per unit volume or unit mass of the system. It is therefore crucial to garner a reliable estimate of their increasing (or decreasing) number in a given volume of a given medium, and at a given temperature. The current investigation practice often concerns planktonic cultures. Microbial growth in planktonic conditions does not reflect the real microbial contamination underlying food spoilage and/or tissue deterioration, but nonetheless provides a reliable experimental evidence for assessing the role of some physical and chemical variables on the evolution of a microbial inoculum and compare the behaviors of different microbial strains.
The standard approach implies the dilution of a starting aqueous cell suspension before inoculation on a petridish, where the implanted cells tend to form colonies. The observer actually has to count the colonies and deduce the number of the inoculated cells on the assumption that each viable cell has formed one discrete colony. Some replicas are indeed necessary to achieve a reliably average result, which however remains an estimate rather than a direct measure. Plate count data (number of CFU per unit volume, or unit mass) therefore reflect the empirical resultant of the actual behavior of many thousands of cells. Once the inoculum environment is well defined, these data indicate that the microbial population grows with a sigmoid trend from a starting density toward an eventual steady level, where the growth rate vanishes. The best treatments of such data are those that strictly reflect their empirical nature. This attitude is indeed at the fundament of models [1-3] that made use of damped exponential functions to describe the sigmoid increase (or decrease) of the population density. Other models instead relate the plate count trend with the expected behavior of the single cells, describing the microbial growth with a kinetic (deterministic models), or a logistic mechanism, or a “combination” of them [4-9]. The availability of suitable software allows the use of these models for bestfit treatments. The relevant expressions for the maximum growth rate, the maximum CFU density, the lag-time and the effect of temperature changes contain a number of parameters, many of which actually become adjustable quantities in the fitting treatment. Consequently, the size of the data set directly affects the reliability of the results.
The present paper suggests a model that does not take into account any specific growth mechanism, aiming to predict just the resultant of the cell duplication applied to a vast microbial population. Data sets reported in the literature for several microbial species allow a reliability test of the model: the accuracy of the fits obtained is in line (R2 ≥ 0.98) with the best ones so far achieved. Although the model accounts for the contribution of the single generation lines to the growth of the entire culture, it remains substantially phenomenological and the related parameters have a merely statistical meaning, as the bio-physiological peculiarities of the growth process do not appear in the model. Nonetheless, the good agreement between model and experiments supports the hypothesis that the microbial growth in planktonic conditions may obey some self-regulatory constraints, which do not depend on the kind of microbes. Furthermore, since the two parameters of the model reflect the potential growth extent and the sharpness of the growth trend, the model can be of help for defining protocols to tune the microbial growth on changing the environmental conditions.
Once the inoculum enters a new medium, the cells have to adapt themselves to the new environment by activating a number of biochemical processes [1]: the larger the differences between old and new environment, the longer the adaptation time span, commonly referred to as the “lag-phase”. The “true” growth process, namely the increase of the population density, begins at the end of the lag phase. Focusing the attention just on the growth process, if N0 is the number of cells in the starting inoculum, then the growth process will imply N0 generation lines.
Along any generation line, the generation time will not be the same for each generation step, since the duplication process is not exactly symmetric, one of the two daughter cell being weaker in promoting the generation process. For each generation line, a duplication tree like the one reported below is expected (Figure 1).
The duplication process may not proceed indefinitely because of many reasons, like genetically programmed cell death, reduced amount of substrate, available surrounding volume, quorum sensing, etc. [10- 14]. This is why, along a given cell line, the generation time is not the same for every duplication step and the progress of the N0 generation lines is not synchronous [10], even at the onset of the growth. In spite of the identical genome, the starting cells can indeed differ from one another for the promptness to undertake the duplication. The whole system would nonetheless keep its ergodicity in most cases [15]. This means that replicas of a given plate count trend would reproduce the same overall CFU number at a given time after the inoculum. A final consideration concerns the experimental evidence: the plate count data actually reflect the convolution of the behaviors of individual cells producing the empirical evidence of a smooth continuous growth of the whole population. In order to achieve a treatable description, one may replace the above picture with a virtual one that yields the same number of cell at any point of the growth span. First, one defines τi,k as the mean generation time of the cells of the (k-1)th step (where “k” refers to the kth generation step and τi,1 refers to the starting cell of the ith generation line). Along the generation line stemming from the ith single cell of the inoculum, Nj,k ≤ 2k, where the inequality sign accounts for truncated branches corresponding to the formation of non-generating cells. Because of the overlap of the generation steps (Figure 1), the progress of each generation line actually is a quasi-continuous process [6] described with a function of time,
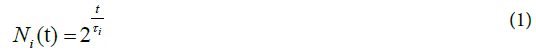

Figure 1: Sketched picture of the non-synchronous progress of a given generation line; the duplication tree shows truncated branches. Numbers correspond to generation steps (heavy segments). The eventual population is formed by cells (open circles) belonging to different generation steps.
where τi is a mean generation time for the ith generation line. In spite of its implicit format, Ni (t) is not a simple exponential function, as the generation time changes at each generation step, some branch of the duplication tree is soon truncated, and the eventual number of cell is attained “smoothly”. Such a trend can be reproduced assuming τi to be a function of time, τi (t), that tends to infinite for, t → ∞, so mimicking the attainment of the final step (Figure 2).

Figure 2: The progress of the ith generation line occurs with a step-by-step mechanism that may be “averaged” with a continuous function, corresponding to a continuous variation of the generation time τi. For the whole population stemming from the starting inoculum of N0 cells, the resultant picture is an array of duplication trees, each with its own τI(t).

Figure 3: Array of N0 generation lines with overlap of generation times. Each k-step stair corresponds to the averaged (Figure 2) duplication tree of a generation line (Figure 1). At any time, the system hosts cells belonging to different generation steps.
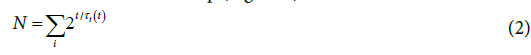
where the sum is equal to N0 for t=0 as it includes all the generation lines stemming from the single cells of the starting inoculum. The generation steps of different generation lines partially overlap to one another and do not have the same onset time (Figure 3).
Once again, one may describe the growth process with a continuous function of time,

where τ(t) is a mean generation time for the whole population.
This is tantamount as to replace the real growth process with a virtual one where every generation line stemming from the starting inoculum has the same number of duplication steps (therefore contributing to the same extent to Nmax) and attains the same eventual steady state. Provided that τ is a suitable function of time, the idealized growth process yields the same number of cells as the real process, at any time during the growth span.
The expression for τ (t) has to comply with some constraints suggested by reasonable assumptions and empirical evidence:
•Phenomenological evidence imposes that growth rate,  is naught for t = 0 and t → ∞, then

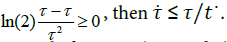
•The specific growth rate,  is always positive, namely,
A simple function (Appendix) that obeys the above conditions is:

Equation (4) implies that τ decreases in the early phase of the growth, goes through a minimum and tends to a straight-line increasing trend (Appendix). The two parameters in the expression, namely, a and b, actually have a meaning that comes out a posteriori. According to equations (3) and (4),

Since in the real system many duplication trees have truncated branches, the parameter b would reflect the stochastic balance between progressing and non-progressing generation lines, 1/b being the measure of the potential growth extent.
The specific growth rate,
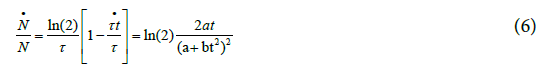
which goes through a maximum at t*=a3b (Appendix). The tangent to the growth curve at t=t* intercepts the vertical axis at -log(2)/8b (Figure 4) and crosses the level log (2)/b and the abscissa at t=tend and t=t(0), respectively.
With a straightforward algebra (Appendix) one can verify some worth noting relationships (Table 1) that are rather simple and imply a predictable growth trend (Figure 4) easy to verify looking at several plate count trends reported in the literature. The (0,  growth extent, which is equal to log (2)/b, may be split in four equal steps (Figure 4), namely, log (2)/4b, log(2)/2b, 3log (2)/4b and log (2)/b, which are attained at t=t*, t=t*√3 , t=tend=3t*and t=∞, respectively. The tangent to the growth curve at t=tend intercepts the vertical axis at 3 log (2)/8b and crosses the level log (2)/b at t=5 t*(Appendix).
| Parameter | Expression | Parameter | Expression |
|---|---|---|---|
| t' |  |
 |
log(2)/2b |
| t* |  |
 |
log(2)/4b |
| t(0) |  |
 |
log(2)/b |
| tend |  |
 |
3log(2)/4b |
Table 1: Synthetic presentation of the main growth parameters expressed according to the present model. “*” stands for “at t=t*”; t’ is the time for the minimum of τ; t(0) and tend correspond to the intercepts between the tangent to the growth curve at t* and the horizontal straight lines at No and Nmax, respectively (Figure 5).
Were these levels expressed as base-2 logarithms, that are the most obvious choice when dealing with a duplication mechanism, they would appear as:
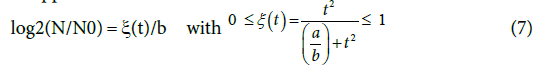

Figure 4: Predicted growth trend according to the present two-parameter (“a” and “b”) model. The logarithms may be in any base.

Figure 5: Master plot for the microbial growth. ξ is the fraction of the potential growth actually attained, while tR is the reduced time, t/t*. The figure includes the tangents at tR=1 and 3 (namely, t* and tend, respectively) and relevant intercepts.
the value of (1/b) reflecting the overall potential growth extent of the microbial population and (t) being the attained fraction of it: for example,  and tend, respectively. The ratio (a/b) would affect the steepness of the growth process: the smaller (a/b), the steeper the growth trend. Using the reduced quantity tR=t/t* for the elapsed time, the ξ -vs-tR may be referred to as the master plot for any growth implying a duplication mechanism (Figure 5), since (remind that t*=(a/3b)1/2)

does not depend on the parameters a and b. For the tangent at tR=3 (that corresponds to ttend) (see above and the Appendix).
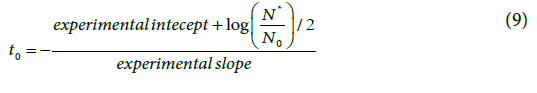
This description does not take into account the lag phase, namely, the time span before the onset of the growth. This no-growth behavior may sometimes be rather short and negligible, but literature reports also growth curves with lag-phases of some hours. Throughout the lag phase the growth rate is naught (namely, 1/τ=0;  . This evidence does not comply with equation (4) that describes the progress of the growth after the lag phase. However, a rigid shift of the growth onset allows the model to match the experimental plate counts (Figure 6). The extent of such time shift, t0, is the duration of the lag-phase (Appendix) and substantially differs from t (0)

Figure 6: Rigid shift, t0, to account for the lag phase preceding the growth process.
Literature reports a variety of experimental plate count data relevant to duplicating microbes. In every case, the two-parameter model permits a satisfactory (R2 ≥ 0.98) fit. Figures 7 and 8 show the fits of a couple of data sets [16,17], among many others considered to test the model.

Figure 7: Fit of the experimental plate counts of Streptococcus thermophilus at 25°C [16] according to the present model.

Figure 8: Experimental plate count data of Pseudomonas fluorescens at 5°C. The data are those in [17], while the curve is the relevant fit according to the present model. Figure 9 accounts for growth trends at different temperatures by the same authors.

Figure 9: The master plot that allows the representation of any growth curve with an underlying duplication mechanism. The full line corresponds to equation (8), while the data corresponds to the experimental plate counts reported in the literature: empty squares, Lactobacillus delbrueckii subsp. bulgaricus and open circles, Streptococcus thermophilus [16]; full squares, Salmonellae [18]; full circles, C. jejuni [1], crosses, Pseudomonas fluorescens and stars, Candida sake [17].

Figure 10: Effect of temperature on the (a/b) ratio that governs the steepness of the growth curve, and 1/b, that is the potential growth extent, for Pseudomonas fluorescens (triangles) and Candida sake (circles) [17].
The plate count data, reported in the literature and related to a variety of microbial strains, can be gathered in a single master plot (Figure 9), once the growth curves are expressed in reduced quantities, namely, tR and ξ (t), according to the equation (8) of the present model.
The cases considered in Figure 9 concern microbial strains that differ from one another for metabolism, composition and temperature of growth medium, starting population density (i.e., N0), etc.; nonetheless, the relevant plate counts gather in the same master plot. Many other data sets available in the literature (not reported in Figure 9 for the sake of clarity) show the same behavior. This suggests that growth in planktonic conditions would occur complying with relationships of the present model, no matter the differences between strains and culture mediums. The plate counts reported by Tyrer et al. [17] allow estimation of the effect of the temperature on the microbial growth. In the adopted model, the relevant quantities are the (a/b) ratio, that governs the steepness of the growth curve and (1/b), that is the potential growth extent. Figure 10 shows that the former exponentially decreases with increasing T, which implies an increase of the steepness of the growth curve, while the latter moderately increases.
A two-parameter model describes the microbial growth trend for planktonic cultures. Based on the commonly accepted assumption that growth takes place via cell duplication, the model assumes a continuous function for the generation time along each generation line and an average Generation time, τ(t) for the whole array of generation lines stemming from a given inoculum. A simple function, τ=(a/t+bt), satisfies the overall constraints for the observed growth trend and allows a very satisfactory fit of the plate count data relevant to any duplicating microbial strain.
A master plot, based on reduced quantities, allows representation of any growth trend related to a duplication mechanism. As for the physical meaning of the proposed model, (1/b) is the potential growth extent, log2 (Nmax/N0), while the ratio (a/b) governs the steepness of the growth process. The starting no-growth time span, t0, namely, the duration of the lag phase, corresponds to the rigid shift of the time scale that allows the matching between expected and experimental growth trend. The effect of the temperature is translated to the corresponding changes of the parameters a and b. In spite of the very satisfactory description of the experimental growth trend of various microbial strains, the model remains substantially phenomenological, as long as it does not relate to the biochemical processes that sustain the growth. Nonetheless, the agreement between predicted and experimental trends suggests that the microbial growth in planktonic conditions may obey some self-regulatory constraints that do not depend on the peculiarities of the microbial species considered. Such constraints would prevail on the effects of bio-physiological differences and become effective when dealing with a large number of cells per unit volume, namely, when a statistical view, like the one underlying the present model (equations 1-3), becomes significant and reliable. In other words, the model would not apply to low density microbial populations. Accordingly, the meaning of the parameters a and b is merely statistic, as long as they reflect the convolution of many coexisting generation lines. The parameters a and b are expected to change on modifying the starting environmental conditions of the culture, namely, pH, temperature, available substrate, etc. By checking whether a or b is more affected by such changes, one may envisage some tuning protocols to govern the microbial growth, including addition of bacteriostatic or bactericidal drugs. For microbial growth processes not implying a duplication mechanism, the model should still hold. One has simply to replace equation (3) with , where n becomes an adjustable parameter that may be also given a non-integer value. This could be the case of yeasts and fungi: the relevant verification is in progress.