Biochemistry & Pharmacology: Open Access
Open Access
ISSN: 2167-0501
ISSN: 2167-0501
Research Article - (2025)Volume 14, Issue 2
Genotypic, cytological, mean performance and correlation studied were performed using parents, MCU 5, CO 14, CO 17, TCH 1828, KC 2, KC 3, GISV 323, GTHV 15-34 and RHC 1409 at the Department of Cotton, Tamil Nadu Agricultural University, Coimbatore, during the year 2021. Four F2 population viz., MCU5 × KC3, CO14 × KC2, CO14 × KC3 and CO14 × GISV 323 along with standard check DCH 32 were also raised for jassid screening. The study made evident that resistant phenotypes would have low jassid population with injury grade for a genotype when it had higher amount of phenol, chlorophyll index, lower amount of sugars and proteins along with higher numbers of trichome length, trichome density and also higher number of abaxial, midrib and vein pubescent counts. Based on the findings and debate, breeders should create varieties with high resistance genotypes to lessen the jassid invasion. It was discovered that the trichomes offer resistance against sucking pests. As a result, cotton plants need fewer pesticides in future, creating a safe environment for ecological species without endangering them. Using tolerant genotypes would reduce the need for pesticides. Additionally, it opens the path for the prospective Integrated Pest Management (IPM) programmes.
One of the most precious fibre crops in the world is cotton, commonly known as "White Gold." In addition to being used for product packaging, cotton seed is utilized to create industrial lubricants, medicinal compounds, vegetable oil, and cow feed [1]. With a yield of 505.46 kg of lint per hectare, cotton is farmed on an area of 12.44 million hectares in India [2]. The nation is the third-largest producer of cotton in the world, although its output is far lower than that of the top producing nations. One of the main reasons for low productivity is the biotic constraints imposed by insect pests particularly sucking bugs, which represent severe threats to cotton production and have indirectly reduced cotton yields by around 28% [3]. In response to insect assault, plants modify the structure and function of their cell walls as well as the amount of nutrients they contain secondary metabolite production [4]. Some plants initial reactions to insect herbivores has been found to be changes in its protein profiles and oxidative enzymes [5]. There are numerous trichomes on leaves, and many plants use these physical traits as protection against different herbivorous insects [6]. Amrasca biguttula (jassids), a sucking pest, has emerged as one of the crop's most significant production bottlenecks in recent years, affecting not just India but also Pakistan, Bangladesh, Thailand, and other Southeast Asian countries. This outbreak of jassids or other sucking pests was mostly brought on by ignorance of the IPM techniques suggested after the introduction of Bt cotton [7]. The application of pesticides for the bollworm complex, which formerly helped control the sucking pest to some extent and kept it far below its ETL levels, was reduced or entirely stopped by Bt cotton producers [8]. Resistance is a result of defence mechanisms like morphological barriers or a complex array of phytochemicals that act as deterrents for oviposition, phagodeterrents, and repellents [9]. Boll worm and sucking pest resistance is now needed in cotton breeding programmes. In their analysis, Taylo and Bernardo found a significant inverse relationship between A. devastans populations and trichome density. The physical properties of cotton plants, particularly on leaves, the quantity of sucking pests varies from cultivar to cultivar. The most well-known biochemical components linked to resistance are protein, reducing sugars, phenol, and chlorophyll content. Insects communicate potential biotic stresses to their host plants. Breeders can create resistant genotypes that are socially stable, commercially successful, and ecologically sustainable by using the resistant cultivar in their breeding programme [10]. Because of this, resistant cotton cultivars are crucial to a sustainable agricultural system [11]. Data collection on particular biochemical characteristics and their association to infection with sucking pests requires expertise.
As a result, the current study will concentrate on the molecular(parental polymorphism) along with biochemical (phytochemical) substances and morpho-anatomical characters (trichomes) that are present in plants and play a crucial role in determining whether certain cotton cultivars are resistant or susceptible to sucking pests.
The parents of Gossypium hirsutum L. viz., MCU 5, CO 14, CO 17, TCH 1828 were used as lines and the parents viz., KC 2, KC 3, GISV 323, GTHV 15-34 and RHC 1409 were used as testers for the study. The current investigation was conducted at the department of cotton, Tamil Nadu Agricultural University, Coimbatore, during the year 2021. Four F2 population viz., MCU5 × KC3, CO14 × KC 2, CO14 × KC3 and CO14 × GISV 323 along with standard check DCH 32 were also raised for jassid screening. The F2 crosses were mentioned as C1, C2, C3 and C4 respectively for illustration.
Total soluble proteins
Based on Lowrey et al. the total soluble protein were calculated through cotton leaves extract. Using a given quantity of bovine serum albumin, a standard curve was created. The protein content of both types of samples was determined by using a standard calibrated curve with known bovine albumin values.
Total phenols
The approach developed by Malick and Singh was used to determine total phenols (g/gM). To create the standard, 100 mg of catechol stock solution is diluted to 1000 ppm in 100 ml of water. The standard colour intensity is calculated at 650 nm using this 200 ppm, 400 ppm, 600 ppm, and 800 ppm scale.
Total reducing sugars
The Miller et al. method was used to calculate the total reducing sugars after making a few changes. Using a typical graph of glucose produced by known glucose concentrations, the samples' total reducing sugars were determined (100-500 g).
Analyzing the Jassid population and its outcomes
Based on infestation signals and using a technique created by the Indian Central Cotton Committee [12], jassid damage was evaluated. On days 15, 30, 45, 60, and 75 after sowing, a visual evaluation of hopper injury and the amount of jassid per plant on each entry were recorded, and a mean injury index (grade index) was determined. The severity of Jassid's wounds was rated as follows (Table 1).
| Grades | Symptoms |
|---|---|
| 1 | Leaves free from crinkling or with no yellowing, bronzing and drying |
| 2 | Few leaves on lower portions of the plant curling, crinkling and slight yellowing |
| 3 | Crinkling and curling all over, yellowing, bronzing and browning in the middle and lower portion, plant growth hampered |
| 4 | Extreme curling, yellowing, bronzing and browning, drying of leaves and defoliation, stunted growth |
Table 1: The severity of Jassid's wounds was rated.
The leafhopper resistance index was calculated of suggested by Nageswara Rao.
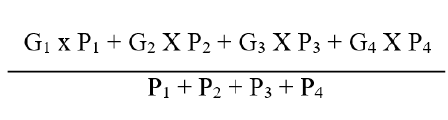
Where, P denoted the number of plants beneath each item and G denoted the grade's ICCC number. The damage index is categorised into resistance groups as shown below (Table 2).
| Grade index | Category |
|---|---|
| 0.0-1.0 | Resistant |
| 1.1-2.0 | Moderately resistant |
| 2.1-3.0 | Susceptible |
| 3.1-4.0 | Highly susceptible |
Table 2: The damage index.
Analysis of the trichome length and density
Based on quantitative measurements (trichome density and length) and qualitative evaluation (Pubescence rating), as stated by Bourland et al. and Hornbeck and Bourland. On the plants, jassid resistance-related pubescence features were seen.
Each genotype of the trichome density measurements were suggested by Bourland et al. The Abaxial Leaf Pubescent Count (ALPC), Leaf Midrib Pubescent Count (LMC), and Leaf Vein Pubescent count (LVC) was counted in terms of the number of trichomes/unit area. A high magnification microscope was used to count the trichomes in the 0.1 cm2 area (Stereo Zoom microscope). The mean for trichomes cm-2 was determined separately for each trichome count that was acquired from three different locations on the leave samples (Table 3).
| Trichome density scale | Category |
|---|---|
| 1 | Smooth |
| 3 | Lightly hairy |
| 5 | Hairy |
| 7 | Very hairy |
| 9 | Pilose |
Table 3: Trichome density measurements.
Compound microscopes that use the Aptina MT9M001 image sensor may deliver accurate images with excellent colour and contrast. At 50 DAS, fresh leaf samples were collected, and the Scope Photo application was used to measure the length of the trichomes.
Parental materials
MCU 5, CO 14, CO 17, TCH 1828, KC 2, KC 3, GISV 323, GTHV 15-34 and RHC 1409 were used for the present study. They were obtained from the Tamilnadu Agricultural University, Department of cotton, Coimbatore. They were raised during the month of August 2021 with two rows each with the spacing of 90 cm × 45 cm. Agronomical and cultural practices were followed as recommended and as per the schedule.
Molecular analysis
By generally following the process, genomic DNA was extracted from the cotton leaves of the parents, and the quantity and quality of DNA was verified for Polymerase Chain Reaction (PCR) using a NanodropTM 1000 spectrophotometer. After verification the amplified fragments from PCR (using the primers for the fibre quality and trichome hairiness traits) were separated through agarose gel electrophoresis and scoring of banding patterns and parental polymorphism identification.
PCR amplification
About 27 primers with high PIC values were obtained from the Cotton Marker Database (CMD) developed by Mainlab at Washington State University. These primers were commercially synthesized and procured from Eurofins Genomics Pvt. Ltd. 2X SMART PRIME PCR Master mixes were used for amplification. The following primers were used for the study (Table 4).
| S. no. | Marker name | Primer sequence (5’-3’) | Annealing Temperature (°) | |
| 1 | BNL1153 | F | CTTTATCCGGAGACGGAACA | 55°C |
| R | CTAACTTTTGCTCACCCCCA | |||
| 2 | CIR316 | F | TTACAGGCACTACCACC | 60°C |
| R | CCTTTCTGGCGACTT | |||
| 3 | BNL1122 | F | TCGATAACGGCTATAGTAATCTCTC | 55°C |
| R | CAACAAATAAGCAGCCAAGAAA | |||
| 4 | BNL3599 | F | TTTAGCCCCAGTAACATGCC | 55°C |
| R | ACTGCAAGCTCTGCCCTAAA | |||
| 5 | BNL3147 | F | ATGGCTCTCTCTGAGCGTGT | 55°C |
| R | CGGTTCAGAGGCTTTGTTGT | |||
| 6 | BNL1513 | F | TTTCACAAGCACAACCATAGG | 55°C |
| R | AATACAGGTTCAAAGTTGATAGGG | |||
| 7 | BNL1440 | F | CCGAAATATACTTGTCATCTAAACG | 55°C |
| R | CCCCCGGACTAATTTTTCAA | |||
| 8 | BNL1964 | F | AGGGAGGGGGAGGTTCTC | 55°C |
| R | CGGTAGTCCTCCACCATGTT | |||
| 9 | BNL1417 | F | TTATTCTAACCACCGCCTCC | 55°C |
| R | TGAGTGGATATGCTTGGCCT | |||
| 10 | CIR014 | F | AGCTTGCCTCTTTCTG | 60°C |
| R | ACATTAGAACTCCCTGCT | |||
| 11 | BNL1878 | F | TGCTTCAACTGCTCTTGCAT | 55°C |
| R | TCGATATCTGGAACACCCAC | |||
| 12 | BNL2568 | F | GGGAAGAGAGGGAGACTAACG | 55°C |
| R | ATTTTGATAGGTTGGTTTTGTCC | |||
| 13 | BNL1059 | F | CCTTCTCTGACACTCTGCCC | 55°C |
| R | TGTATTCTCTTCTTTTCCTTATACTTTT | |||
| 14 | BNL1693 | F | CCCTTGGGAATAGC | 55°C |
| R | CATGTGTCTCCGTGTGTGTGTG | |||
| 15 | BNL2884 | F | TCAACTCATACCAAATCAATTCC | 55°C |
| R | CCCTGTTTTGTTCAATGGGT | |||
| 16 | NAU1215 | F | GAGTGAGACTGGAGCTGGTT | 55°C |
| R | CAAATCATTGTTTGCAGCAG | |||
| 17 | CIR199 | F | CAGAATTTGACCGTTTC | 50°C |
| R | GCCATGATATTTCGGT | |||
| 18 | BNL3580 | F | CTTGTTTACATTCCCTTCTTTATACC | 55°C |
| R | CAAAGGCGAACTCTTCCAAA | |||
| 19 | MUSB1035 | F | TCATGATAGCAACGAGTGGTGC | 58°C |
| R | GTCGAGTTGTATTAGTGTGCCCG | |||
| 20 | CIR0407 | F | GCACAGAACATCCATACA | 50°C |
| R | TCTCTCTCTCTTTCACACAC | |||
| 21 | BNL 1059 | F | CCTTCTCTGACACTCTGCCC | 55°C |
| R | TGTATTCTCTTCTTTTCCTTATACTTTT | |||
| 22 | BNL 3255 | F | GACAGTCAAACAGAACAGATATGC | 60°C |
| R | TGTATTCTCTTCTTTTCCTTATACTTTT | |||
| 23 | CIR 246 | F | TTAGGGTTTAGTTGAATGG | 55°C |
| R | ATGAACACACGCACG | |||
| 24 | CIR 307 | F | GACTTGAAAAGATTACACAC | 55°C |
| R | GAATTTGCTGGCTCT | |||
| 25 | JESPR 153 | F | GATTACCTTCATAGGCCACTG | 55°C |
| R | GAAAACATGAGCATCCTGTG | |||
| 26 | JESPR 127 | F | GATTTGGGTAACATTGGCTC | 55°C |
| R | CTGCAGTGTTGTGTTGGGTAGA | |||
| 27 | JESPR 154 | F | GTTCCCTCAGTTGCTCAGAAG | 55°C |
| R | GGAGGAGTTGGCAGAAAATAGC |
Table 4: Particulars of primer pairs used for molecular study.
Separation of amplified fragments using Agarose gel electrophoresis
A 3% (w/v) agarose gel was casted in a chamber filled with 0.5X TBE buffer, and the amplified products, together with a ladder of 100 base pairs, were loaded into the wells to determine the size of the amplified fragment of the product. For 2.30 hours, the PCR products were operated at 90 volts. After electrophoresis, the gel was taken from the tank, inspected under UV light, and photographed using gel documentation equipment (Bio-rad Gel Doc XR imaging system).
Analysis and scoring of banding patterns
A total of 27 SSR primer pairs were used to study polymorphism among 9 parents. All 27 primers produced were clear, scorable and unambiguous bands and hence and they were chosen for parental polymorphism analysis. DNA bands were scored which was present in the agarose gel for their presence and absence across the genotypes in the form of binary codes (presence –1; absence –0).
Mean performance of parents and hybrids
Numerous studies on the antibiosis mechanism for pest resistance have found that resistant germplasm lines typically contain more phenolic compounds than susceptible germplasm lines, but on the other hand, higher levels of reducing sugar were found in susceptible germplasm lines than resistant germplasm lines. Additionally, it was stated that phenolic chemicals may serve as insect repellents, resulting in the development of insect resistance in such genotypes as reported by Rao et al. and Nishanth et al. From the mean Table 5, the resistant parent KC 3 had lowest jassid population (3.11) followed by GTHV 15-34 (3.25). The maximum number of jassid population was observed in susceptible check DCH 32 (13.25). Pathan et al. Khalil et al. and Saleem et al. have carried out several studies to evaluate the response of sucking pest resistance. Aslam and Saeed evaluated 22 cotton genotypes for their comparative resistance to jassid. Based on the jassid injury grade the total parental genotypes were divided into moderately resistant (MCU 5, CO 14, TCH 1828, CO 17 and KC 2) and resistant genotypes (KC 3, GTHV 15-34, GISV 323 and RHC 1409). Among the parents, KC 3 had highest amount of total phenols (2.89 μg/g) and chlorophyll index (51.71) but lowest amount of reducing sugars (1.98 mg/g). KC 2 registered with lowest amount of soluble proteins (4.4 mg/g) among the parents. The susceptible check, DCH 32 was observed with highest mean jassid population per plant (13.25), jassid injury grade (4), reducing sugars (5.12 mg/g), soluble proteins (5.9 mg/g) but with lowest chlorophyll index and phenol content (1.25 μg/g). The hybrids, MCU 5 × KC 3, CO 14 × KC 2, CO 14 × KC 3, CO 14 × GISV 323 reported resistace with the injury grade of range between 0 to 1; CO 14 × RHC 1409, TCH 1828 × KC 2, TCH 1828 × GTHV 15-34 and CO 17 × KC 3 exhibited moderate resistance with the injury grade range of 1.0-2.0. Among the hybrids, MCU 5 × KC 3, recorded lowest mean for the traits namely, jassid nymph per plant (3.21), amount of reducing sugars (1.87 mg/g) with highest total amount of phenol (2.87 μg/g) and chlorophyll index (58.33). The cross CO 14 × RHC 1409 had the highest Jassid Injury grade (1.32), highest total reducing sugars (2.99 mg/g) and highest total soluble proteins (4.8 mg/g). The hybrid, TCH 1828 × KC 2 had highest mean number of jassids per plant (7.51) and lowest chlorophyll index (42.46). The hybrid, TCH 1828 × GTHV 15-34 had lowest value of phenol content (1.56 μg/g). The hybrid CO 14 × KC 3 had lowest jassid injury grade (0.13) with lowest soluble proteins per plant (2.0 mg/g). The mean performance of parents and hybrids were depicted in the Figure 1.
| Parents | Mean Jassid nymph/plant | Jassid injury grade | Resistance rating scale | Total phenol (µg/g) | Total reducing sugar (mg/g) | Total soluble protein (mg/g) | Chlorophyll index |
|---|---|---|---|---|---|---|---|
|
KC3 |
3.11 |
0.12 |
R |
2.89 |
1.98 |
4.8 |
51.71 |
|
DCH 32 |
13.25 |
4 |
HS |
1.25 |
5.12 |
5.9 |
30.65 |
|
MCU 5 |
8.4 |
1.8 |
MR |
1.48 |
2.32 |
5 |
40.33 |
|
CO14 |
8.2 |
1.77 |
MR |
1.49 |
2.55 |
5.3 |
40.57 |
|
TCH1828 |
9.89 |
1.72 |
MR |
1.59 |
2.21 |
5.1 |
46.49 |
|
CO17 |
9.55 |
1.51 |
MR |
1.34 |
2.56 |
5.3 |
44.17 |
|
KC2 |
9.12 |
1.38 |
MR |
1.54 |
2.12 |
4.4 |
42.12 |
|
GTHV 15-34 |
3.25 |
0.88 |
R |
2.5 |
1.12 |
4.9 |
51.16 |
|
GISV 323 |
4.12 |
0.87 |
R |
2.63 |
1.26 |
5.1 |
49.89 |
|
RHC 1409 |
6.34 |
0.84 |
R |
2.45 |
2 |
4.9 |
49.35 |
|
MCU 5 × KC 3 |
3.21 |
0.18 |
R |
2.87 |
1.87 |
2.1 |
58.33 |
|
CO 14 × KC 2 |
4.97 |
0.16 |
R |
2.68 |
1.91 |
2.4 |
55.72 |
|
CO 14 × KC 3 |
5.1 |
0.13 |
R |
2.61 |
2.49 |
2 |
54.73 |
|
CO 14 × GISV 323 |
6.44 |
0.3 |
R |
1.81 |
2.44 |
2.2 |
54.62 |
|
CO 14 × RHC 1409 |
5.46 |
1.32 |
MR |
1.77 |
2.99 |
4.8 |
46.56 |
|
TCH 1828 × KC 2 |
7.51 |
1.27 |
MR |
1.65 |
2.65 |
4.5 |
42.46 |
|
TCH 1828 × GTHV 15-34 |
6.21 |
1.23 |
MR |
1.56 |
2.51 |
4 |
42.88 |
|
CO 17 × KC 3 |
6.64 |
1.19 |
MR |
1.59 |
2.41 |
4.6 |
47.56 |
|
SE |
0.64 |
0.22 |
|
0.14 |
0.2 |
0.29 |
1.62 |
Table 5: Parental mean value assessmet of Jassid resistance related traits.

Figure1: The mean performance of parents and hybrids for different biochemical traits.
Correlation studies for parents and F1 hybrids
To know the association between the traits taken under study, the correlation studies were carried out as illustrated in Table 6. From the correlation table, it was evident that mean jassid population had highly significant positive correlation with the injury grade (0.858). The mean jassid population per plant had negative significant correlation with the amount of phenols present (-0.844) and the chlorophyll index (-0.824). Positive significant correlation for mean jassid population per plant were noted for the traits namely, amount of reducing sugars (0.734) as well as soluble proteins (0.486). Rizwan et al. also reported the same results of positive correlation of reducing sugars and proteins with mean jassid population. The jassid injury grade revealed negative significant correlation with amount of phenol content (-0.753). Highly significant positive association was confirmed with the amount of reducing sugars (0.759) and soluble proteins (0.702). Highly significant negative correlation coefficient values were observed in chlorophyll index (-0.628) with injury grade. The amount of phenol content estimations resulted in significant negative association with the reducing sugars (-0.600) and soluble proteins (-0.487). The reducing sugar estimation concluded a significant negative correlation with the chlorophyll index (-0.285). Involvement of total soluble sugars content, proteins in having more insects feeding on plants has been reported by Athar et al. and Sonalkar et al.
| JP | IG | PHE | RS | PRO | CI | ||
|---|---|---|---|---|---|---|---|
| JP | 1 | .858** | -.844** | .734** | .486* | -.824** | |
| IG | .858** | 1 | -.753** | .759** | .702** | -.928** | |
| PHE | -.844** | -.753** | 1 | -.600** | -.487* | .813** | |
| RS | .734** | .759** | -.600** | 1 | 0.256 | -.685** | |
| PRO | .486* | .702** | -.487* | 0.256 | 1 | -.749** | |
| CI | -.824** | -.628** | 0.213 | -.285* | -0.149 | 1 | |
| Note: **Correlation is significant at the 0.01 level (2-tailed). *Correlation is significant at the 0.05 level (2-tailed). |
|||||||
Table 6: Correlation of traits for Jassid resistance studies in parental genotypes and F1 hybrids.
Genotypic and cytological studies
Zafar et al. studied about the genetic linkage map of leaf hairiness in upland cotton using molecular markers. He used 400 RAPD and 54 SSR primers. JESPR-154 primer amplified at 150 bp DNA fragment in hairiness population. Linkage map was developed using polymorphic DNA markers by him. Insect resistance in cotton could be improved through the construction of genetic linkage map using RAPD and SSR markers which revealed that the inheritance for leaf hairiness exists.
Among the 27 SSR primers used only JESPR 154 primer showed amplified fragment at 150 bp which validates the corresponding parents with hairiness trait conferring resistance to Jassid given in Figure 2. In order to phenotypically and cytologically determine the trichome length and density Aptina MT9M001 image sensor used with compound microscopes provided the results as shown in Figure 3. From the images correlating the primer amplified at 150 bp in KC 3, GISV 323, GTHV 15-34 and RHC 1409 had trichomes with count of three to five with a same initiating point. But for parents MCU 5, CO 14, CO 17, TCH 1828 and KC 2 the band was not amplified at 150 bp and the Figure 3 reveals that number of trichomes arising from the initiation point was also lower (one or two in numbers).

Figure 2: Primer JESPR 154 show amplified fragment at 150 bp which validates the corresponding parents with hairiness trait conferring resistance to Jassid.

Figure 3: Aptina MT9M001 image sensor used with compound microscopes, producing clear images of A) MCU 5, B) CO 14, C) CO17, D) TCH 1828, E) KC 2, F) KC 3, G) GISV 323, H) GTHV 15-34 and I)RHC 1409. The images A, B, C, D and E depicts the point where trichome arises and divides into two or remains only one whereas in images F, G H and I had four or five trichome hairs arising at each point showing more hairiness.
The amplification at 150 bp correlated with the Figure 4. A, B, C, D and E (MCU 5, CO 14, CO 17, TCH 1828 and KC 2) could be apparently visualized with the development of only one or two hairs which exhibits lower trichome density in compare to the Figures F, G, H and I (KC 3, GISV 323, GTHV 15-34 and RHC 1409) with high trichome density [13].

Figure 4: Stereo Zoom microscopes, producing clear images of A) MCU 5, B) CO 14, C) CO17, D) TCH 1828, E) KC 2, F) KC 3, G) GISV 323, H) GTHV 15-34 and I) RHC 1409. The images A, B, C, D and E depicts lower trichome density whereas in images F, G H and I had higher trichome density which are apparently visible.
Correlation studies for F2 crosses
The mean Jassid population per plant represented in Table 7, was found to have significant correlation coefficient with jassid injury grade in all F2 crosses (0.935, 0.964, 0.391 and 0.779 for crosses C1, C2, C3 and C4 respectively) and the same trait contributed negative significant association with trichome length (-0.876, -0.397 and -0.572 for crosses C1, C2 and C4 respectively) and density (-0.510, -0.775, -0.410 and -0.600 for crosses C1, C2, C3 and C4 respectively) in majority of the crosses. Trichome density had positive association with pubescent count on abaxial, midrib and veins and also with mean number of gossypol glands and chlorophyll index traits in majority of the crosses. The abaxial leaf pubescent count showed negative relationship with mean jassid population in all the crosses and the cross C1 (-0.835) alone contributed significant association with the same. The traits, leaf midrib pubescent count (-0.848, -0.781 and -0.691 for crosses C1, C2 and C3 were significant) and leaf vein pubescent count (-0.840, -0.438, -0.497 and -0.684) also contributed with the negative association with the mean jassid population in majority of the crosses. Another significant positive correlation was observed between the abaxial leaf pubescent count with leaf midrib pubescent count (0.994, 0.364, 0.410 and 0.333) and leaf vein pubescent count (0.998, 0.182, 0.704 and 0.380) in major number of the crosses [14].
|
|
MJP |
IG |
TL |
TD |
ALPC |
LMC |
LVC |
GG |
CI |
|---|---|---|---|---|---|---|---|---|---|
|
MJP |
1 |
.935** |
-.876** |
-.510** |
-.835** |
-.848** |
-.840** |
-.848** |
-.984** |
|
1 |
.964** |
-.397* |
-.775** |
-0.259 |
-.781** |
-.438* |
-0.296 |
-.382* |
|
|
1 |
.391* |
-0.253 |
-.410* |
-0.316 |
-0.105 |
-.497** |
-.392* |
0.091 |
|
|
1 |
.779** |
-.572** |
-.600** |
-0.301 |
-.691** |
-.684** |
-0.132 |
-0.157 |
|
|
G |
|
1 |
-.846** |
-.598** |
-.789** |
-.797** |
-.783** |
-.795** |
-.948** |
|
|
1 |
-0.342 |
-.810** |
-0.272 |
-.743** |
-.465** |
-0.29 |
-.437* |
|
|
|
1 |
-0.254 |
-.675** |
-.576** |
-0.322 |
-.715** |
-.628** |
0.093 |
|
|
|
1 |
-.575** |
-.479** |
-.544** |
-.678** |
-.649** |
-0.232 |
-0.353 |
|
|
TL |
|
|
1 |
.480** |
.646** |
.658** |
.644** |
.657** |
.877** |
|
|
|
1 |
0.257 |
-0.113 |
0.259 |
0.114 |
0.317 |
0.062 |
|
|
|
|
1 |
.398* |
0.15 |
.480** |
0.297 |
0.328 |
0.106 |
|
|
|
|
1 |
.401* |
0.146 |
.502** |
.500** |
.377* |
.396* |
|
|
TD |
|
|
|
1 |
.374* |
.368* |
0.352 |
.380* |
.556** |
|
|
|
|
1 |
0.159 |
.483** |
.384* |
0.261 |
0.29 |
|
|
|
|
|
1 |
.458* |
0.275 |
.832** |
.792** |
0.093 |
|
|
|
|
|
1 |
0.199 |
.545** |
.511** |
-0.033 |
0.06 |
|
|
ALPC |
|
|
|
|
1 |
.997** |
.995** |
.995** |
.829** |
|
|
|
|
|
1 |
.364* |
0.329 |
.417* |
0.239 |
|
|
|
|
|
|
1 |
.410* |
.528** |
.615** |
-0.038 |
|
|
|
|
|
|
1 |
0.333 |
0.302 |
0.105 |
0.223 |
|
|
LMC |
|
|
|
|
|
1 |
.994** |
.994** |
.843** |
|
|
|
|
|
|
1 |
.498** |
.364* |
0.305 |
|
|
|
|
|
|
|
1 |
.457* |
.385* |
0.268 |
|
|
|
|
|
|
|
1 |
.891** |
.403* |
.425* |
|
|
LVC |
|
|
|
|
|
|
1 |
.998** |
.830** |
|
|
|
|
|
|
|
1 |
0.182 |
0.209 |
|
|
|
|
|
|
|
|
1 |
.704** |
0.185 |
|
|
|
|
|
|
|
|
1 |
.380* |
.396* |
|
|
GG |
|
|
|
|
|
|
|
1 |
.835** |
|
|
|
|
|
|
|
|
1 |
-0.098 |
|
|
|
|
|
|
|
|
|
1 |
0.108 |
|
|
|
|
|
|
|
|
|
1 |
.682** |
|
|
CHI |
|
|
|
|
|
|
|
|
1 |
|
|
|
|
|
|
|
|
|
1 |
|
|
|
|
|
|
|
|
|
|
1 |
|
|
|
|
|
|
|
|
|
|
1 |
Table 7: Correlation of traits for Jassid resistance studies in F2 crosses.
From the correlation Table 7, it is noted that, the mean number of gossypol glands (-0.848, -0.296, -0.392 and -0.132) with mean number of jassid population was in negative association both significantly and non-significantly. Another significant positive association between gossypol glands with leaf pubescent counts viz., abaxial; midrib and vein were identified in more number of crosses. The chlorophyll index refered had indicated that positive and negative relationship with mean number of jassids per plant but majority of the crosses resulted in negative correlation coefficient values (-0.984, -0.382 and -0.157). It was also observed that chlorophyll index does not have any major association with other traits taken under study [15].
As a result of the aforesaid findings of Table 5 and Table 6, high phenolic content, low reducing sugar, lower soluble proteins, greater chlorophyll index, and higher trichome density would result in fewer jassids per plant. Shinde et al., Halder et al. and Rushpam et al. reported similar findings for high phenolic content with lower jassid incidence. Rohini et al. reported higher phenolic content along with higher trichome density offers resistance to jassid in cotton plants which was in accordance with the result obtained. Manivannan et al. also reported that phenol content in cotton plants acts as the feeding deterrant hence the population of jassid feeding that respective plant would be lower. He also reported that higher the protein more would be the infestation by jassids, which was also in agreement with the results obtained. This result was in accordance with the present study. Singh et al. and Nikhath et al. also reported higher the amount of reducing sugar more susceptible the cultivar would be. Among the hybrids, MCU 5 × KC 3, recorded lowest mean for the traits namely, jassid nymph per plant (3.21), amount of reducing sugars (1.87 mg/g) with highest total amount of phenol (2.87 μg/g) and chlorophyll index (58.33). Hence this F1 hybrid confers resistance against jassids. Hence, higher phenolic content along with higher trichome density offers resistance to jassids in cotton plants. This hybrid could be further forwarded to F2 to identify the jassid segregants for further screening [16].
From the F2 correlation studies it was evident that correlation studies with jassid population per leaf and the hair density on midrib and vein had significant but negative correlation as reported by Bhatti et al. Negative correlation of number of jassids with trichome density was also reported by Ashfaq et al., Rustamani et al., Gonde et al., Kanher et al., Sankeshwar et al., and Amin et al.,. Similar results were reported by Syed et al. and Khan et al. for gossypol gland conferring resistance to jassids [17].
Thus, knowledge into these biochemical analyses and trichome density of the cultivar might be used to breed for jassid resistance, which would assist minimize the usage of pesticides and pest loads from the fields, thereby increasing the population's productivity [18,19].
[Google Scholar] [PubMed]
[Crossref] [Google Scholar] [PubMed]
Citation: Subhashini S, Keerthivarman K, Rajeswari S, Premalatha N, Kalaimagal T, Muthuswami M, et al. (2025) Manifestation of Jassid Studies in Upland Cotton (Gossypium hirsutum L.) Based on Biochemical, Morphological and Genotypical Studies. Biochem Pharmacol. 14:382.
Received: 29-Aug-2023, Manuscript No. BCPC-23-26372; Editor assigned: 01-Sep-2023, Pre QC No. BCPC-23-26372 (PQ); Reviewed: 15-Sep-2023, QC No. BCPC-23-26372; Revised: 18-Jan-2025, Manuscript No. BCPC-23-26372 (R); Published: 25-Jan-2025 , DOI: 10.35248/2167-0501.25.14.382
Copyright: © 2025 Subhashini S, et al. This is an open-access article distributed under the terms of the Creative Commons Attribution License, which permits unrestricted use, distribution, and reproduction in any medium, provided the original author and source are credited.