Journal of Proteomics & Bioinformatics
Open Access
ISSN: 0974-276X
ISSN: 0974-276X
Research Article - (2008) Volume 1, Issue 9
With the large variety of Proteomics workflows, as well as the large variety of instruments and data-analysis software available, researchers today face major challenges validating and comparing their Proteomics data. It is the expectation that Human Proteome Organisation (HUPO) related standardization initiatives with its standardized data formats but also with its efforts in standardized processing and validation will lead to field-generated data of greater accuracy, reproducibility and comparability.
State of the art techniques for the analysis of complex proteomes use multidimensional approaches: pre-separation on protein level (1D/2D PAGE); different separation principles on peptide level (IEF, 1D LC and 2D LC workflows), and a combination of different MS techniques (ESI and MALDI Ionisation, Ion Trap or TOF- Analysers to generate MS and MS-MS data). With the tremendous amount of heterogeneous data resulting from today’s expression proteome analysis due to these different experimental strategies, different MS based techniques and different instrumental equipment, a database solution with sophisticated warehousing and data mining strategies is mandatory. ProteinScape (co-developed by Bruker Daltonics and Protagen, Germany) provides a bioinformatics platform for in-house proteome studies, as well as for large scale multi-center studies, like the human brain proteome project (HUPO BPP).
Nowadays a new bioinformatics focus is necessary for automatic methods of spectrum data processing and validation of peptide/protein identification, especially in multiworkflow studies. Manual validation of proteomics research is not feasible, resulting in subjective protein lists with suboptimal quality relevant information. Bioinformatics tools for the automated protein identification and result processing with quality control, the elaboration of standards and a well defined processing pipeline are all mandatory to produce reliable and comparable data when analyzing heterogeneous data generated in multi-workflow studies.
For protein identification and characterization complementary tools (e.g. search engines) have been implemented into ProteinScape. The use of independent search engines provides an automatic cross-validation of the identifications in parallel with a better sensitivity (resulting in more protein IDs) of the database search. The Decoy approach allows measuring the rate of wrong identifications (false positives) by means of artificial (obviously false) protein sequences mixed into the protein database (Elias et al., 2005). At any score threshold, the number of decoy proteins can be counted, indicating the rate of false positives.
A key role in such a data processing and validation pipeline is a new bioinformatic algorithm, ProteinExtractor, as part of the ProteinScape bioinformatics platform, enabling automatic data processing and result validation by generating Protein_IDs extracted from redundant information, merging peptide lists from different workflow studies into one compiled protein list and automatically cutting off identification results for which a pre-selected false positive rate has been reached. The use of decoy strategies as well as application of the ProteinExtractor algorithm to overcome the protein inference problem minimizes the need for manual validation (which is nevertheless easily possible using raw spectra information).
In the near future it will be a must that all protein identifications come with a statistical significance value, or a specified false positive rate (FPR), so everyone can really judge the validity and statistical relevance of the information. Different workflows create different kinds of information, so reproducibility and standardized ways to create confidence in the generated results is the great challenge in Proteomics for a relevant bioinformatics solution.
The new design concept for ProteinScape (vers. 2) allows visualizing and processing proteomics data under many different perspectives. All the different views into the data are arranged within one general program frame. This conceptional approach allows straightforward creation of any depth of information without switching between different software.
Different perspectives into the archived data include sample and project management, generating protein ID, protein quantitation, setting up data dependent queries including combining / grouping of samples, different data viewing tools (e.g. spectrum viewer, protein viewer, LCMS data viewer) including raw data access and various report options (e.g. protein ID, peptide ID, quantitation reports).
Database Concept
Implementation
Major technical constraints for the architectural design of the proteomic database are functional and vertical scalability and extensibility. To cover these needs, ProteinScape uses a multi-tier architecture (http://en.wikipedia.org/wiki/Threetier). Each tier may run on a different computer, e.g. the database engine may run on a high-end server whereas the application server may run on some other server and the client application on a desktop computer. On the low end, the complete system is configurable to run on a single desktop PC for a single user operation.
Supporting both high- and low-end configurations is challenging because each may involve different technologies or frameworks to be used. An application server may be considered as an overhead for a ”single-computer” solution. The same holds for the database-engine. Ideally the applied technologies (database engine and application server) are configurable to a specific point without rewriting parts of the software modules. This means that the modules have to be platform and technology independent. To address these issues a Model Driven Architecture (MDA) (http://www.andromda.org) development coupled with dependency injection technologies namely Spring (http:// www.springframework.org) is used.
The database layer is based on Hibernate (http://www.hibernate.org) as object relational mapping tool. Using Hibernate (and its HQL query language instead of SQL) the RDBMS system can be easily exchanged with other RDBMS like, e.g., Microsoft SQL, MySQL, PostgreSQL or Oracle.
In the middle tier, the JBOSS (http://www.jboss.org) application server is used to deploy J2EE compliant business modules. Different and partially independent modules are deployed: General user management (GUM) and login; general method management e.g. of laboratory protocols and search-methods; a processing-kernel module for background jobs (long durating spectra imports, submission to searchengines, cleanup-jobs), and ProteinScape modules for the ProteinScape 2.0 application itself.
Access to the ProteinScape server is provided via RMI, SOAP and Hessian network protocol. Java clients would usually access ProteinScape via RMI. Hessian is mainly used for C++ and .Net clients (e.g. other applications) and SOAP is used by external, third-party clients.
The class model and service definitions are modeled in UML. AndroMDA is used as an MDA tool to generate database mappings and Java classes from the model in an automated build process. In the model the visibility of a service can also be defined, so that not all services are available for external access, which allows us to differentiate between public and internal services. Service access can also be limited to users having specific rights (automatic role based access check using the Acegi Security Framework (http://acegisecurity.org).
The ProteinScape Client is a dedicated Java Eclipse RCP application (http://wiki.eclipse.org/index.php/Rich_Client_Platform,) which provides the full power of a native GUI. Its plug-in based architecture allows extensibility and flexibility regarding feature content and easy re-use or integration of own or third-party eclipse plug-ins.
Data Warehousing Concept: Supporting Complexity in Proteomics Workflows
The extreme complexity of the Proteome calls for different multistep approaches for separation and analysis on protein and on peptide level. These are usually combinations of 1D or 2D gel electrophoresis and one- to multidimensional LC techniques in combination with different MS and MS/ MS techniques, all of which are supported by the ProteinScape data warehousing concept.
A database driven solution is the most effective way to manage these data, to compare experiments, and to extract and gain knowledge based on experiments already done in the past. ProteinScape combines the archival and data analysis power to both cope with data heterogeneity and provide confidence in the generated results.
Mass spectrometry based quantification is becoming more and more important. All current label chemistries for protein quantification are fully supported (ICPL, SILAC, iTRAQ, ICAT, and C-term 18O/16O labeling) and the software is designed to include future label technologies. The support includes multiplexed quantification (e.g., ICPL triplex, iTRAQ or SILAC 4plex). It enables the use of isobaric or non-isobaric label chemistries and it permits the targeted analysis of proteins in complex mixtures. Interactive validation of protein quantification based on raw LC/ MS data has become simple and rather routine.
Recent improvements in MS instrumentation and nano- LC reproducibility make a label-free MS based quantification approach feasible. This technology has the potential to become a significant complement to current quantification methods, such as label based MS methods (ICAT etc.) or 2D-gel quantification methods. The high throughput compatibility of a label-free approach allows processing large numbers of samples, which is required to obtain statistically valid quantifications from typical biological sample heterogeneity. Handling these workflows from data processing (e.g. RT-alignment of different LC-MS data, compound detection and binning techniques) to statistical validation and quantification results is a big challenge nowadays.
Any kind of software solution for data warehousing and analysis should address these different workflows in a flexible manner. The ProteinScape platform supports various discovery workflows through a flexible analyte hierarchy concept.
In the lab, a proteomic workflow can be a manifold combination of various steps like, separation on protein level, protein labelling, protein digestion to generate peptides, separation at peptide level followed by analytical methods to identify peptides, proteins and their post translational modifications, e.g with mass spectrometry. In ProteinScape, a simple or complex workflow is represented in the navigation tree. However, two elements remain fixed: the topmost level is the Project that contains Samples on the second level. Optionally, separation and digestion are created as the next level with mass spectrometric data below, or MS data can directly be located below a sample. An example of a standard workflow (2D gel workflow) is shown in (Fig. 1). Here, the Project Navigator of ProteinScape shows one Project that contains one Sample that has been submitted to 2D gel electrophoresis. 102 spots have been digested and analyzed by MALDI-TOF MS and LC-ESI-IT MS/MS. One spot is expanded, so the datasets and the underlying protein database search results can be seen.

Figure 1: Example for a 2D gel project in the navigation tree.
Protocols and methods are handled by a global method management module. These methods can be versioned (e.g. search engine-Searchmethods) and unversioned (e.g. vocabulary like organism taxonomy), thus any method change is tracked and a new label assigned. Access permissions can be defined for each method separately and are usergroup based.
Standardized Data Processing
Proteomics studies, whether driven by large consortia or in a research facility, often lead to heterogeneous data due to different experimental strategies and diverse instruments. An important aim of the HUPO organisation is to the basis and define standardized analysis methods and result validation techniques (see focus of HUPO 2007 general meeting). One of nine official global HUPO consortia is the Human Brain Proteome Project, headed by Helmut E. Meyer (Medizinisches Proteom-Center (MPC),Bochum, Germany), which aims to map the proteomic landscape of the brain using mouse and human samples to get deeper insights into neurodegenerative diseases, and produce an inventory of proteins in the human brain. The brain consortium has established guidelines for data processing for protein identification (Reidegeld et al., 2006; Hamacher et al., 2006; Stephan et al., 2005; Stephan et al., 2006). To generalize the reprocessing of diverse data sets, a guideline (http://forum.hbpp.org) has been set up defining the workflow of protein identification. Well defined data processing procedures and standardized operations (processing pipeline) significantly help to increase comparability and to improve the protein identification results. They will allow researchers to compare results and statistical relevance for relevant data, within the huge variety of Proteomics data. A data warehousing system including a data processing pipeline is mandatory for data comparison and validation. The HUPO initiated MS data processing pipeline is fully implemented into ProteinScape [Fig. 2].

Figure 2: Workflow for processing MS (PMF) and MS/MS spectra based on the HUPO processing guidelines and implemented within ProteinScape. The approach for analysing the MS/MS spectra is slightly different from the approach of the MS spectra. All spectra are searched against four search engines and the resulting peptides are used with the ProteinScape algorithm ProteinExtractor to end up with protein lists. These lists for each search engine are used again to merge the protein lists based on the peptides of the identified proteins. The four protein lists and the merged protein list are cut off by a False Positive Rate [FPR] of 5% on the protein level.
The HUMAN Brain Proteome Project (HBPP) was one of the first international research collaborations that made extensive use of ProteinScape. In a joint study supported by 18 research laboratories in four continents the HUPO BPP data (740,000 MS and MS/MS spectra in 37 different data sets from different species) were collected, stored and reprocessed at the central Data Collection Center (DCC) at the MPC. The objective results of this standardised reprocessing allows a comparison of the heterogeneous datasets and as such, the HUPO BPP data reprocessing constitutes a sophisticated approach which tries to define stringent criteria for data integration and subsequent protein identification.
Result Enhancement: Integrating Multiple Search Engines
Proteomic analyses typically produce massive amounts of mass spectrometric data, which are analysed in an automated way by database search engines for retrieval of peptide sequences and subsequent inference on the corresponding protein sequences. However, this process has turned out to be error prone, producing false positives and multiple hits for the same proteins for various reasons.
The key problem in MS based protein identification is that peptide masses determined by MS are generally not unique and therefore each measured mass can randomly match a peptide from a sequence database. As a result, protein identification is probability-based and there remains a certain risk of obtaining a false positive. To measure the statistical significance of a match, the search engines apply various different approaches to calculate search scores.
Sequest (Eng et al., 1994) scores each peptide using a so called preliminary score. This serves as a preselection and the 500 top scored peptides are evaluated using a crosscorrelation between the measured spectrum and the theoretical spectrum of the database peptide. Preliminary score and cross correlation values are reported to the user. In the proteomics community Sequest results are often evaluated using simple score thresholds or user specific combined score thresholds. As there are no means for the probability of correctness available, judging Sequest results correctly can be a difficult and time consuming task, as a large amount of spectra must be evaluated manually.
The Mascot Score is based in the MOWSE algorithm (Pappin et al., 1993),that was originally implemented in the MS-Fit software (http://prospector.ucsf.edu). Here, the MOWSE score has been transformed into a measure of absolute probability using a probability based scoring approach. This gives the advantage that significance thresholds can be reported. Furthermore the probability that the observed peptide match is a purely random event is also reported and can be used for result evaluation.
The Phenyx scoring system (Colinge et al., 2004) is based on the OLAV scoring model, which is a family of true statistical scoring schemes that can be fine-tuned for any instrument and datasets. This includes differentiation between for instance iTRAQ and non modified peptides, differentiation between instruments of similar types (HCT vs LCQ, or QTOF micro vs QSTAR). A scoring model is a function that can activate up to 12 basic functions, such as presence of a, b, y, y++, b-H2O…; co-occurrence of ion series (using HMMs), intensities, residue modifications (PTM or chemical), recalibration. A scoring model can be learned from a relatively small set of validated peptide matches. The scoring models can take advantage of the very high mass accuracy instrumentation (no limits such as 1 Dalton bins) and is function of the charge state of the precursor ions.
The identification process implies, for each spectrum, a search in a randomly sampled set of peptides in addition to the candidate peptides in a queried sequence database. After a normalisation step between both queries, a log-likelihood ratio is calculated to determine a z-Score and p-Value that reports the quality of a match, and its non-random behaviour. In cases where spectra do match more than one peptide with relatively high scores, a resolution algorithm can solve the conflict by rejecting lower probability peptide matches. When searching with Phenyx, a 2-round mode can be selected. This mode searches a full sequence database with a first set of parameters. The proteins identified after this first round are then submitted to a second round of identification where looser criteria can be explicitly selected (search for unspecific cleavages, many PTMs, etc).
In case of ProteinSolver (Chamrad, 2004) each matching database peptide is scored where the aim is to measure the similarity between the theoretical spectrum of the database peptide and the measured spectrum. In this procedure mass accuracy is regarded as well as signal intensity. To evaluate the significance of the score values and to transform the scoring into a measure of probability, frequency distributions are derived from the scoring distribution of all matching peptides contained in the database. As most of these matches are purely random, a model of the distribution of random matches can be obtained for each spectrum. Using this model, the probability that a database peptide belongs to the random distribution (i.e. the peptide with its score is a pure random match and presumably a false positive event) can be calculated. This has the advantage that the significance of a match is specifically rated in dependency to spectrum quality and the distribution of other peptide matches.
Because of the different approaches to scoring, different search engines frequently report different proteins and apply a different ranking. An important criterion for judging the performance of search engines is their ability to discriminate correctly identified proteins from randomly matched proteins. This approach enables the sensitivity and selectivity of the algorithms to be assessed. To get the most accurate and reliable information ProteinScape integrates several MS/MS search engines (including Mascot, Phenyx, Sequest, ProteinSolver) to allow cross-validation and consolidation of the identification results through the complementary use of these engines. Instead of importing search-engine result files manually, the database system is interfaced to the different search-engines with automated submission and result import. The searches are running in the background inside the processing kernel module, and the client is notified when results are available. The number of parallel running jobs can be configured to optimally utilize the power of the search-engines.
A high number of algorithms for MS/MS data interpretation has been published within the last few years (Yates et al., 1995; Perkins et al., 1999; Craig et al., 2004; Geer et al., 2004; Colinge et al., 2003). For each algorithm the benefit for a given data set was demonstrated. Clearly, the preference for utilizing a specific search engine is not only reflected by its performance but by its search time, interfaces, GUI presentation and availability.
However, the performance itself was not investigated systematically for the search engines as the variability of test parameters like sample organism, proteome separation technique, mass spectrometer, and search algorithm parameter is enormously high. In a recent study (Körting et al., 2008) the performance of a search engine on a given dataset and moreover quantifying the benefit of the simultaneous use of four search engines has been investigated.
From PeptideID to ProteinID
In MS/MS experiments only peptides are identified, not proteins. A search engine identifies a list of different peptides for each single MS/MS spectrum. The mapping of peptides to proteins is not a one-to-one mapping, leading to ambiguities. Spectra match to several peptide candidates, and each peptide matches to several proteins or protein isoforms. Sometimes because of noise or low mass accuracy, the correct peptide identification for a spectrum may even not be the top-scored peptide candidate. This complicates the process of grouping peptides to proteins further.
Therefore, generating a non-redundant list of proteins (containing only those proteins and protein isoforms which can be distinguished directly by MS/MS data) of proteins from peptides is very difficult and has to be done by bioinformatics methods. Current approaches show very little transparency, disregard isoform distribution, utilize rough estimates or need sophisticated training.
ProteinExtractor, a module of the ProteinScape bioinformatics platform, uses an empiric method to derive protein identification lists from peptide search results. Prior to designing the ProteinExtractor algorithm, a team of MS experts defined a set of rules in order to define a minimal protein list, which contains only those proteins (and protein variants), which can be distinguished directly by MS/MS data. Every protein reported should be identified by at least one (or more) spectrum with significant peptide score, which cannot be mapped to a higher-ranking protein already in the result list. The algorithm was then implemented to follow these rules.
ProteinExtractor: The Algorithm
An iterative process is used to implement the rules. The algorithm itself can be adjusted to the applied search engine and tailored to the specific analytical problem by the definition of specific parameters. For each spectrum, all peptides with a score above the predefined peptide score threshold given for the respective search engine are taken into account (not only the best-scoring peptide). For every protein candidate, a combined protein score (metascore) is calculated from the peptide scores. The protein candidate with the highest metascore is written to the resulting protein list. All spectra which match this protein are assigned to this protein and are marked as “used”.
From the remaining spectra the combined protein scores are recalculated, and again the next most probable protein is selected. These steps are repeated until no more protein candidates are left. Proteins are selected only if they have at least X peptides, which could not be mapped to another protein already in the protein list, and which have a score better than specified in minimum X peptides with score > (“unique score”). Peptide/spectrum matches are treated as different if they differ in sequence, charge or modifications (as they are independent observations). Each search engine has its own scoring scale. The ProteinExtractor calculates metascores by using weighting factors as a search engine dependent parameter. These weighting factors are used to bring the scores of the different engines into the same range.
ProteinExtractor Works for Different Search Engines
The ProteinExtractor algorithm uses only spectra, the assigned peptides and peptide scores as input, and works therefore with any search engine. This gives the opportunity to create protein lists from each search engine with the same algorithm and conditions. ProteinExtractor has been successfully used and tested already with Mascot, Phenyx, Sequest and ProteinSolver.
In the HUPO BPP project, ProteinExtractor was used for generating the protein lists. Overall, 1200 data sets containing 750000 MS/MS spectra were processed. Here the decoy strategy was used to generate a maximal protein list with minimal protein variants / isoforms with a defined false-positive rate of under 5% (Stephan et al., 2006).
Decoy Strategy for Validation of the Protein List
Combined MS/MS searches result in long protein lists, sorted by descending protein score. However, the question remains open as to which proteins are “really” identified (Peng et al., 2003; Cargile et al., 2004; Elias et al., 2005). Where is the threshold that separates correct hits from random matches?
The false positive rate (FPR) of protein searches can be estimated by searching decoy databases containing entries with “right” (target) and “false” (decoy) protein sequences. Decoy databases can be created from FASTA or UniProt- DAT formatted protein database files. In the case of FASTA formatted database files, an entry consists of a database specific entry (i.e. accession number), a description and the actual amino acid sequence. An ideal decoy database should contain at least the same number of peptide sequences as the target database, allowing an a priori non-biased selection of decoy and target proteins. For every original protein sequence a decoy entry is generated that contains the same amino acids in a random order – a protein with the same mass and amino acid content, but with an artificial sequence. In ProteinScape, randomization of the target sequence database can be performed in different ways:
· reverse: the protein sequence of the target database entry is simply reversed from end to beginning in the decoy protein sequence
· shuffle: all amino acids from the target protein sequence are put in a random sequence in the decoy protein sequence
· random: the mass of the target protein is calculated and a decoy protein of the same mass (considering a given mass tolerance) is calculated with the same probabilities of amino acid occurrence as the target protein. In general these random decoy proteins have a completely different amino acid composition.
For all three strategies, the theoretical protein mass remains the same (within a given tolerance for the random strategy). Also, a combination of all decoy strategies is possible.
The decoy strategies can lead to two forms of databases (e.g. stored as FASTA formatted files): On the one hand the target and decoy sequences are merged into a composite decoy database, on the other hand only the decoy sequences are stored.
The database specific accession numbers of a composite database must be unique for each sequence and they must allow determination whether a sequence represents a target sequence or a decoy sequence. Therefore, any decoy entry gets its own accession number (the letters “rev”; “rnd”;“ran” followed by the target accession) (Reidegeld et al., 2008).
The Decoy Database Generating Tool
ProteinScape is delivered with a software utility which allows creating different flavours of decoy databases. The Decoy database tool provides a flexible way to efficiently generate target-decoy composite databases from FASTA formatted protein databases. As target protein databases, the IPI, NCBI and UniProt databases are supported. The resulting composite databases are suitable to be used for protein identifications from MS/MS data with common protein search engines, e.g. Mascot, Phenyx, SEQUEST and ProteinSolver. The workflow of protein identification has to be changed only quite slightly: the target protein database is replaced by the composite target-decoy database. The search engine parameters and scoring criteria remain unchanged.
The decoy database building tool basically is a Perl scriptmakeDecoyDB.pl that can be started from a command shell (cmd on windows operating systems). The formal syntax for the launching the Perl script is:
perl makeDecoyDB.pl [database] [decoy-database] [decoy-type] [database-type] [decoy-prefix] where database is the name or path to the sequence database FASTA file
decoy-database is the name of the resulting composite sequence database FASTA file
decoy-type defines the algorithm to generate random sequences ( 1= reverse, 2= shuffle [default])
database-type defines the type of sequence database to convert (3=UniProt, 2=NCBI, 1=IPI, 0=other [default])
decoy-prefix defines the string to use as a prefix to the original accessions e.g. ‘rnd’.
Creating a decoy database of e.g. UniProt_sprot.fasta takes approximately five minutes.
Automatic Result Validation
The protein identification process results in a list of identified proteins, more precisely a list of protein identifiers, i.e. target database dependant accession numbers (the “original list”). The search engine assigns a score to each protein in this list reflecting the quality of identification. The list is ordered by decreasing score, containing the protein accessions with the highest score at the first position.
Valid protein identification is reasonable only if some quality assessment of the resulting protein list is performed (Benjamini et al., 1995; Levander et al., 2007). The quality of protein identification can be measured automatically by determining the false positive rate (FPR) or false discovery rate (FDR). The false positive rate (FPR) is defined as the quotient of the number of false positives (FP) and the sum of false positives and true negatives (TN):
FPR = FP / FP + TN
The false discovery rate (FDR) of a protein identification is defined as the quotient of the number of false positives
and the sum of false positives and true positives (TP).
FDR = FP / FP + TP
The FDR/FPR evaluation can be done on the peptide level (before combining peptides to proteins), or directly on the protein level. Allowing an FPR of 1% at the peptide level will lead to a much higher (but not easily to calculate) FPR in the protein list, as most correct proteins will be identified by several peptides, and random peptide hits will more likely lead to a protein with a single peptide. For FPR calculation on the protein list, a non-redundant protein list without all protein variants and isoforms is needed (like the protein list generated by ProteinExtractor). Therefore, in Proteinscape FPR calculations are done only on the protein list.
A protein search against the composite database will result in a protein list that contains a certain number of decoy entries, clearly detectable by their accession number with the prefix. The following calculation is based on the assumptions:
- every match to a “decoy” entry is a wrong match (false positive)
- the number of random identifications in the “original” part of the sequence database will be similar (or less) to the number of decoy entries found.
Thus, the number of decoy matches gives a good estimation of the number of incorrect identifications.
The above generated protein list calculated for the selected peptide score threshold is validated by the decoy strategy for a specific false positive rate (FPR). Fig. 3 shows the plot of the number n of proteins calculated on a 1% / 5% FPR depending on the score threshold value. This calculation is performed for all of the four search engines separately. The maximum of the curve indicates the peptide scoring value giving rise to the maximum number of proteins validated on a certain FPR level. If the peptide score threshold is set too low, decoy proteins are found with so many low-scoring peptides that they combine to a significant protein score. If the peptide score threshold is set too high, correct identifications are lost.

Figure 3: The diagram shows the resulting amount of the proteins assembled by the ProteinExtractor algorithm depending on the peptide score threshold for the Phenyx search engine. The straight line shows the amount of proteins with the cut-off of 5% FPR on the protein level. The dotted line is the total amount of proteins using the ProteinExtractor at the same score parameter with the cut-off of 1% FPR.
In the second step of the optimisation process, the number of extracted proteins are optimized by varying the parameter minimum X peptides with scores > . By this parameter, the number of peptides with a scoring value above the new threshold is set which have to be present in the assigned protein. The result of the whole 2-dimensional optimisation is a scoring value leading to a maximum of assigned proteins. Again, this process is performed for all of the four search engines.
Merging Peptide Lists from Different Search Engines
So far, the parameter for peptide filtering peptide score threshold and for protein extraction minimum number have been optimized for all of the four search engines separately. In the next step of optimization, all identified peptides by the individual search engines are merged together prior to the protein assignment. In addition to the two parameters for peptide filtering and protein extraction, the weighting factor as third parameter can be verified. The weighting factor balances the influence of the search engine dependent peptide lists.
To determine the true protein content of a sample, the four independent protein lists based on the four search engines have to be merged into a single protein list. First, proteins are identified with each of the four software programs Mascot, Phenyx, Sequest and ProteinSolver, independently, using the decoy databases as described. Then, ProteinExtractor is applied to the four generated protein lists, and creates a new merged protein list.
Most correct protein hits are found by all or at least several protein identification software, most random hits only by a single software solution. This results in a better and bigger merged protein list than any of the single-software protein lists. All peptides of the proteins identified by at least one of the protein identification softwares are used, and protein scores are calculated as a (weighted) sum of the scores of all peptides matching to a protein from all softwares. Weightings can be specified by the user, the default weightings are set so that all engines scores are at the same score level. ProteinExtractor merges first the peptide lists from all engines, and then builds a new protein list. A new FPR calculation is done on this merged protein list, independent from the FPR of the individual engine protein lists.
Visualization
ProteinScape has a number of dedicated data viewers that permit the evaluation and validation on each level of proteomics experiments, such as the LC/MS survey viewer, the gel viewer and sequence-annotated MS/MS spectra. All these views are linked and permit simple browsing through the proteomics data in the current projects and even allow retrieval of data generated years ago, allowing their joint reanalysis with novel capabilities and mining tools [Fig. 4].

Figure 4: Novel Viewer Concept: This example shows a study of three patient and three control samples that have been subjected to 1D SDS PAGE. The ProteinScape client program shows the Project Navigator, the gel image of one selected sample, and the list of identified proteins. For a selected protein, it shows the list of identified peptides, the sequence coverage map (red bricks indicating matched fragment ions), and for a selected peptide its location in the LC-MS run and the respective MS/MS spectrum.
The Sequence Viewer shows the sequence coverage map of the protein. The identified peptides are shown in shades of grey, representing by default the intensity of the MS peak. For peptides identified by MS/MS, the fragment ions found are represented by red rectangles. The Gel Viewer allows the user to view the scanned gel image with its assigned spots. The LC-MS Survey Viewer provides views across the entire LC-MS/MS run. Visualization tools are needed for fast multi-resolution visualisation of the data as an image, ensuring seamless transition from a global overview of all spectra to selected isotopic peaks.
The Spectrum Viewer visualizes the MS and MS/MS data stored in the ProteinScape database along with annotations like the acquired mass values or identified fragment ion series.
The Peptide Statistics view shows a Box-Whisker Plot for a concise statistical overview of the quantitation data of all peptide for a given protein.
The LC-MS Survey Viewer displays the density data of the selected chromatogram analysis. The intensity values that correspond to the retention time/m/z pairs are expressed by a colour code. For reasons of performance and compactness the ProteinScape database stores MS data on the peak list level. However, with an additional mouse click the raw data can be loaded into the survey viewer as well.
Access to Raw Data
In the course of a full scale Proteomics experiment, the handling of the data as well as the retrieval of the relevant information from the results is a major challenge due to the massive amount of generated data (gel images, chromatograms, and spectra). as well as associated result information (like sequences and literature for example).
The variety of LC/MS mass spec techniques is producing vast volumes of data, posing two major issues in bioinformatics. First: Do we need all the raw data in the database? To cope with the huge amount of data the processing pipeline has to be able to condense the data, starting with a real time MS peak picking done at acquisition time. This is followed by a detection of chromatographic compounds which have to be arranged to charge states and finally molecular features which can be used for data base searches and multivariate statistical analysis.
Following automatic data reduction, it is necessary to have software tools to validate the generated results. These validation tools should be able to go back to visualize the raw data and correlate the results on the basis of the raw data. Especially for applying quantification algorithms, the access to MS raw data is mandatory to make sure the information contained in the raw data is not disturbed by processing.
Structure Elucidation Functionalities
BioTools™ integrates with ProteinScape for advanced sequence validation, PTM discovery, de novo sequencing and MS-BLAST searches for full structure elucidation functionalities.
BioTools provides customizable views of sequence annotated raw spectra, interactive peak editing capabilities and error plots that permit interactive operator validation of MS data. MS/MS spectra that were not identified in automated procedures in ProteinScape can be further evaluated by de novo sequencing in conjunction with MSBLAST or Sequence Queries of Mascot (Matrix Science). The relative scoring of, eg., different phosphorylation site isoforms permits the interactive validation of PTM attachment sites based on MS/MS spectra. BioTools permits the use of custom protein structures (sequence plus a particular set of modified amino acids) for quality control work independent of Proteomics approaches, linking ProteinScape‘s database properties with dedicated work in protein structure analysis.
Quantification
Using the ProteinScape platform with its advanced analysis tools for protein identification with quantification workflows that utilize labeling technologies combined with protein separation requires greatly reduced analysis and validation time.
Quantification based on label chemistry is divided into two classes:
· non-isobaric labels (Stable Isotope Label Experiments, SILE, e.g. ICPL; Stable Isotope Label Analysis in Cell Culture, SILAC, e.g. Leu/Arg, 16O/18O labelling). Here, the proper signal pairs must be found in the spectra; intensity ratios are calculated on MS level.
· isobaric labels (e.g. iTRAQ). Here, all labels of a pair / n-tuple have the same mass but generate different reporter fragments in the MS/MS spectra. Pair finding is much easier because the masses of the reporter fragments are known.
Labels that modify specific amino acid residues (e.g. ICPL that labels Lysines) are compatible with protein separation steps since they are introduced before the protein digest. Labels that specifically modify the N-termini of the peptides (e.g. the standard iTRAQ setup) must be introduced after the protein digest and thus rely on elaborate peptide separation techniques (2D LC, IEF+LC).
The general quantification workflow consists of the following steps:
1. LC-MS/MS data acquisition on each of the fractions, processing
2. peptide identification (job submission to search engines, import of the identified peptides)
3. determination of label pairs
4. calculation of intensity ratios
5. integration of the peptide lists of all fractions into an overall protein list
6. calculation of the ratios for each protein based on the peptides identified in any of the fractions
ProteinExtractor combines the search results on a peptide list level. Thus, the generation of large combined MS/MS datasets becomes obsolete, and the number of fractions in a complex protein / peptide separation workflow is not limited.
Because of the close integration of ProteinScape with the WARP-LC quantification module and the Data Analysis data processing program, protein identification and quantification in a multidimensional separation setup is highly automated. A single mouse click can trigger the acquisition of, e.g., 20 2D-LC fractions, data processing, protein database search, quantification and protein list compilation [Fig.5].

Figure 5: Display of the results of an LC-MALDI ICPL quantification of an artificial protein mixture in ProteinScape: The Protein Browser shows the basic numbers (e.g ratio Median over all peptides) for each protein. For a selected protein, the sequence coverage map the respective Compounds in the LC-MS Survey and the quantification Box-Whisker Plot is shown. For a selected peptide, the MS and MS/MS spectrum with fragment ion annotation is available as well.
Queries
Comprehensive Proteomic analyses deal with large data sets comprising a range from very few up to thousands of MS and MS/MS spectra. When considering multiple measurements deriving from method optimization, quality control and long-term studies, this number becomes multiplied and necessitates a structured overview and summary about the different results.
The optimization of a complex separation workflow is often a multidimensional task. Many parameters might have to be varied. In the end, a huge number of datasets is generated and must be compared in various ways. Even a rather simple experiment shows that a database-driven software platform makes life much easier. It keeps track of all data and allows the setup of simple, relevant queries.
In ProteinScape the concept of comparative queries featuring proteomics-specific queries for mass spectrometric data is implemented. The queries allow investigating specific aspects with a focus on different sample preparations, certain peptides, or protein specific attributes including biological properties. The concept of comparative queries allows for quick and simple extraction of tailored and concise information. It gives an excellent overview about large data amounts and is an ideal tool for method optimization.
Reports and Publication Guidelines
Several initiatives have emerged during the last two years that try to establish standards in the Proteomics research community. Amongst them HUPO PSI data formats such as mzData/ mzML or minimal information sets (such as MIAPE; Taylor et al., 2007; http://www.psidev.info/miape) and other publication guidelines that were suggested by Proteomics journal such as MCP (Bradshaw et al., 2006; http://www.mcponline.org/misc/ParisReport_Final.shtml), PROTEOMICS and others. In addition, initiatives provided first platforms on the web to accept data along with publication of proteomic data, such as PRIDE or ProDaC.
Researchers who want to submit their data to central repositories or publish their results are facing the problem of collecting all relevant information, methods, parameters, MS data, and search results. With ProteinScape, everything is already in place because the methods, data and results are stored in a project-oriented manner. The Search Result, in particular, can be easily exported to MS Excel, or a wellstructured PDF file can be generated: The Detailed Protein Report. In addition, a dedicated spectrum report for the “one hit wonders”, the proteins that are identified by means of a single peptide only, can be produced, meeting the requirements of MCP [Fig. 6- Fig. 7].

Figure 6: The Detailed Protein Report can be generated in various formats, e.g. html or pdf.

Figure 7: The Spectrum Report can be generated for individual spectra or for all “one hit wonders”, i.e. all spectra that lead to the identification of a protein without support of a second peptide match.
Providing a Transparent Access to Proteomics Databases for Retrieving Biological Information
One of the main goals in bioinformatics is to extract and collect all biological information available in public databases from a set of identified molecules (genes, proteins, etc.). Due to the complexity of this task and the huge amount of data available, it is not feasible to gather this information by hand, making it necessary to have automatic methods. PIKE (Protein Information and Knowledge Extractor) solves this problem by automatically retrieving via Internet all functional information on public information systems and databases, and then clustering this information according to the preselected criteria.
PIKE offers an easy and user friendly way to obtain protein functional information extracted from several internet sources. The user can improve the way to obtain knowledge about the biological role of the proteins within the specific topic of the experiment. The system also provides methods to integrate PIKE data into ProteinScape to extend the level of information provided. (http:proteo.cnb.uam.es)
Other sources of protein meta-information and further knowledge are the Protein Center (ProXeon), the NCBI (http://www.ncbi.nlm.nih.gov/), IPI (http://www.ebi.ac.uk/IPI/) and UniProt pages that are accessible directly from individual proteins or whole result tables in ProteinScape.
Standardized Data Submission Pipelines
During the last few years in Proteomics there has been a tremendous increase in data produced, software tools used, and data formats developed. The collection of data in one database or the direct comparison of data between consortia is often difficult or impossible due to this heterogeneity.
In the past, all manufactures had their own file formats, with software running just on the vendors own instruments. Nowadays, the vendors are participating with consortia to support initiatives in data standardization. That helps researchers generate data on one instrument and use dedicated software tools to turn data into information and knowledge in the depth that is needed. Bruker‘s concept of integrating bioinformatics tools applied for different purposes in Proteomics, which are accessible and useable within a data warehousing solution, has been developed to meet that challenge.
In a conceptional view, the general data flow in proteomics consists of three basic elements: (i) generating raw data on different types of MS and MS/MS instrumentation; (ii) the local database solution that handles the set of heterogeneous data supplying different vendors instruments, different types of MS based techniques and all possible workflows for protein identification and quantification with the support of sophisticated algorithms for standardized generation of validated results; and (iii) standard submission tool to submit the results to the global data repository PRIDE (PRoteomics IDEntifications database at the European Bioinformatics Institute; Martens et al., 2005; http://www.ebi.ac.uk/pride).
Global Data Repository for Proteomics Data: PRIDE
Producing large protein lists is not the end point in Proteomics research. To be of sustainable value, the results of an experiment should be stored in a utilizable manner. To enable result assessment and experiment comparison the experimental conditions have to be documented in a concise, reproducible and also machine readable way. This is done by PRIDE.
“ProteinScape2PRIDE”-Interface
Proteomics Data Collection (ProDac) is a “Coordination Action” within the EU 6th Framework Programme related to (i) standardization of proteomics data formats, (ii) standardized submission pipelines and (iii) the systematic data collection in standards-compliant public repositories. Based on the work of the Human Proteome Organisation Proteomics Standards Initiative (HUPO PSI), ProDac coordinates the development of international standards for the representation of proteomics data, the implementation of data submission pipelines, and systematic data collection in public standards-compliant data repositories.
The European Commission-funded ProDaC consortium (Proteomics Data Collection, http://www.fp6-prodac.eu/) coordinated by Christian Stephan of Medizinisches ProteomCenter, Bochum, Germany) will finalize data storage and documentation standards, implement conversion tools and establish standardized submission pipelines into a central data repository. This contains export from local LIMS systems like ProteinScape to standard file formats or direct upload into PRIDE. With respect to this, a tool has already been implemented to upload ProteinScape data sets into PRIDE. It was used to store the results and spectra of the Human Brain Proteome Project (http://www.hbpp.org/) into PRIDE [Fig. 11].
Experimental Data
The sample is a trypsin-digested lysate of 10,000 cells of a human colorectal cancer cell line, kindly provided by H.E. Meyer, MPC, University of Bochum, Germany.
A first run on an Agilent 1100 Cap-LC, C18-PepMap 180um i.d. coupled to a Proteineer Fraction Collector, target spotter and an UltraFlex II MALDI-TOF mass spectrometer (Bruker Daltonics, Germany), is used. After peptide identification a second run on MS/MS acquisition was started with the focus on unidentified peptides. 11,619 MS/MS spectra were generated and processed with four different search engines.
Search Engines
Protein searches with different search engines for MS/ MS data were performed with:
(i) Mascot™ v 2.2.01 (Matrix Science Ltd., London, UK; Pappin et al., 1993),
(ii) Phenyx v2.3, (GeneBio, Geneva, Switzerland; Colinge et al., 2004),
(iii) SEQUEST™ v.27 (rev.12)Thermo Fisher Scientific, Waltham, USA, Eng et al., 1994),
(iv) ProteinSolver v1.0 (Bruker Daltonics GmbH, Bremen, Protagen, Dortmung, Germany),
and the ProteinScape™ software (Bruker Daltonics), without any adjustment to those software systems. MS/MS data were first transformed in a Mascot generic file (*.mgf) before being analysed by the different search engines. The search parameters for the four software packages were set to 75 ppm for the mass tolerance of the precursor ions (MS), and 0.9 Daltons for the mass tolerance of the fragment ions (MS/MS). Variable modification allowed was oxidation of methionine and up to one missed cleavages.
Sequence Database
For the interpretation of the spectra, the four search engines were used with the IPI human database. A decoy database was generated with the decoy database builder included in ProteinScape since v1.3SR2.
Cluster Solution
Despite being successful in specialized areas like protein identification and multiple alignment, the Proteomics community has been hesitant to adopt cluster computing for more complicated analysis. The reason behind the rejection lies in the kind of clusters available. Some specialize in single applications, leading to efficient but inflexible systems, others facilitate grid type systems which are powerful but neither easy to learn, nor easy to administrate.
The BioClust system (Reinhardt et al., 2005) proposes a third way called service oriented cluster (SOC). Service oriented cluster means that the roles and tasks which are common in cluster managers are reorganized to fit better to the end user‘s needs. SOC‘s deliver predefined services through a standardized interface like specialized solutions but can run different applications in parallel and are easily extendable. BioClust is a high level abstraction above a reliable cluster system, which separates application concerns from administration tasks. Currently, Sequest, Mascot, Phenyx, ProteinSolver, Blast and peakpicking algorithms are working under control of BioClust.
To reduce processing time, all database searches in this study were processed on the PAULA cluster administrated by BioClust at the Medical Proteom-Center (MPC) at the University of Bochum, Germany. Facilitating 128 CPU‘s, the cluster is capable of processing large scale MS/MS runs in a very short time. In the data reprocessing of the HUPO BPP project, the PAULA cluster was used to run a total of 33 million MS/MS searches.
Data Processing
The individual steps in MS/MS data processing following the HUPO based processing guidelines are described in the following sections.
Optimization of Every Search Engine
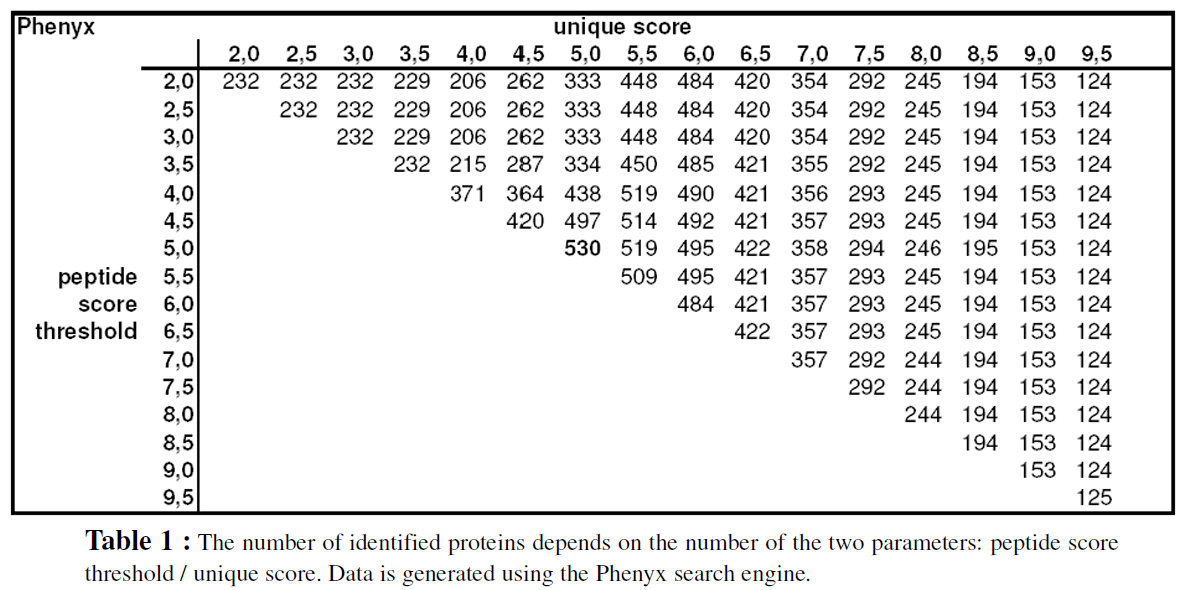
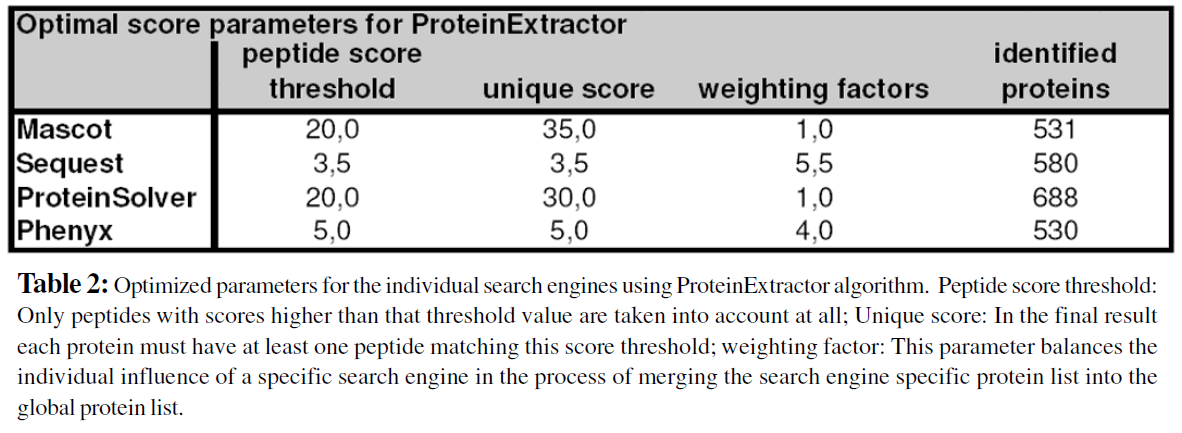
In a first step the parameters “peptide score threshold” and score value for “minimum 1 peptide with score” (unique score) of the ProteinExtractor algorithm were optimized by an iterative procedure. The Table 1 summarizes how many proteins could be identified (at 5% FPR) for a given score value (horizontal axis) and the peptide threshold value (vertical axis). Because the parameter“unique score” must be at least as high as the peptide score threshold, the data table is filled up in first diagonal part. The graphical display clearly indicates the existence of a local optimum in this two-parameter set variation procedure. These optimized values are then taken for the next steps of calculation. The optimization strategy for the other search engines goes the same way and leads to similar results. The Table 2 summarizes these optimized parameters for the complete set of the four search engines. The score values will differ if another data set is used. Therefore parameter optimization is a necessary step for every project. It is expected that for a specific type of analysis and/or a dedicated MS technology these values may approach a constant set of parameter values.
Merging of Search Engines
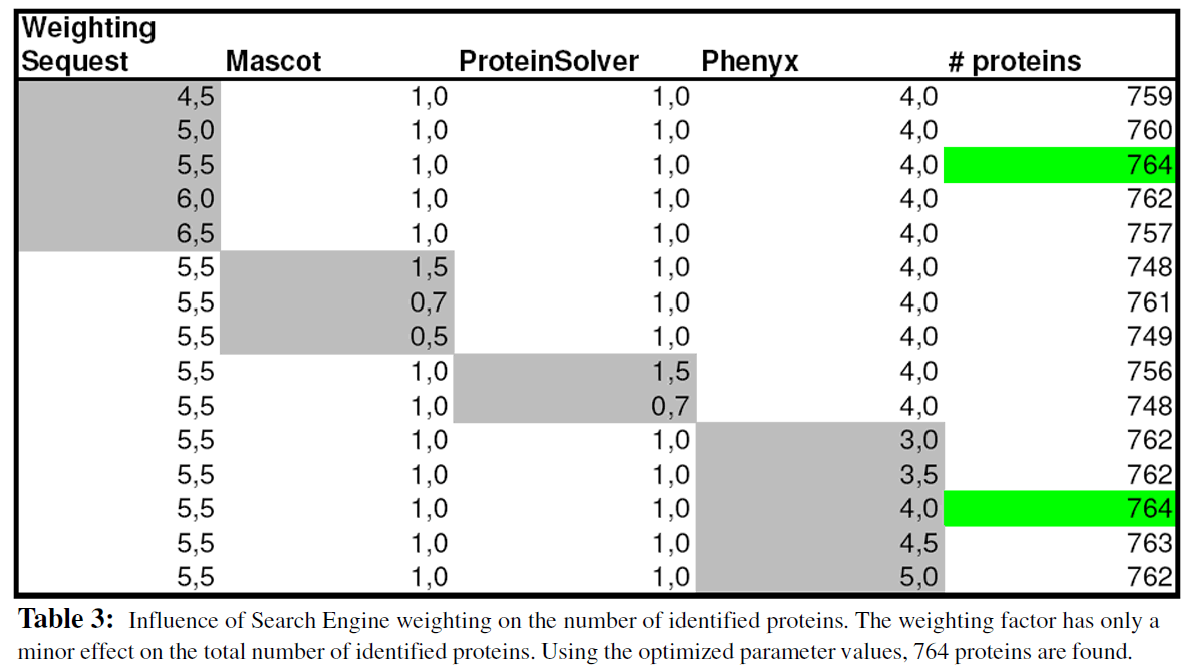
In a second step the result of all search engines are merged together using the ProteinExtractor algorithm. The sore parameters are used as described in step 1. The “weighing factor” for all of the four search engines is optimized. The results in Table 3 clearly indicate that optimization of the weighting factor has only a minor effect on the total number of identified proteins (using default values 756 proteins are found; 764 proteins are identified using the set of optimized parameter values).
Identification Results
ProteinExtractor can be used to combine the peptide search results of several search engines. With this, the sensitivity and selectivity of each search engine can be combined. For a specific protein, some peptides are found, e.g., only by Mascot, some other only by Phenyx. Thus, the number of identified proteins (at a given FPR) is higher when results of several search engines are combined. In Fig. 8, 531 proteins are identified by Mascot, 580 proteins by Sequest, 688 by ProteinSolver and 530 by Phenyx. Merging all of these search results with the ProteinExtractor algorithm increases the total amount of proteins to a number of 764 proteins. In this study combining four search engines improves the number of identified proteins by 44% (Fig. 9) at the same false positive level compared to a single search engine result of the most commonly used search engine (Mascot). The dependency between the accepted FPR and the number of identifiable proteins is shown in Fig. 10.

Figure 8: The maximum number of identified proteins from different search engines and a combination by the ProteinExtractor algorithm of ProteinScape at a false positive rate (FPR) of 5% is plotted as a bar diagram. With the combination of several search engines, 44% more proteins can be identified than with Mascot as one of the common search engines.

Figure 9: Number of proteins which can be identified at a given peptide score threshold and unique score for the Phenyx search engine. The parameters at the maximal number of proteins are the optimal ProteinExtractor parameters.

Figure 10: The number of proteins identifiable depends on the accepted false-positive-rate [FPR]. Shown are the number of identified proteins at a given FPR for all four search engines and the ProteinExtractor.

Figure 11: General data flow in proteomics consists of three basic elements: (i) generating raw data on different types of MAS and MS/MS instruments; (ii) the local database handling the set of heterogeneous data supplying all possible workflows for protein identification and quantification with the support of sophisticated algorithms for standardized generation of validated results; and (iii) standard submission tool to submit the results to the global data repository PRIDE.
With the large variety of workflows in proteomics, as well as the multiplicity of instruments and data-analysis software available, researchers today face major challenges in validating and comparing their data. Using standardised data formats, but also with HUPO PSI, efforts in standardised processing and validation the generated data may be more accurate, reproducible and comparable.
A database driven solution is the most effective way to manage these data, to compare experiments, to extract and gain knowledge based on experiments already done in the past. ProteinScape 2 as the bioinformatics platforms for Proteomics and protein analysis combines the archival and data analysis power to both cope with data heterogeneity and provide confidence in the generated results. It addresses the current requirements for identification, quantification, and validation of biomarkers and detailed protein characterisation. Offering comprehensive solutions for qualitative and quantitative LC-MS/MS and gel-based protein analysis, this data warehousing and project management software supports all workflows through a flexible analyte hierarchy. A combination of different database search engines, scoring algorithms and quantification methods is combined with ‘decoy’ validation by a dedicated algorithm, ProteinExtractor, that produces non redundant protein result lists across entire projects.
Result integration and validation are key issues for the identification and quantification of proteins on great numbers. For a maximized number of identified proteins, one strategy comprises biological and technical replicates, another involves separation steps on protein and/or peptide level. The resulting redundant search results need to be integrated on a peptide level. The ProteinExtractor compiles a non-redundant protein list from peptide lists of different origin. This allows the combination of data from different search engines as well as from different MS experiments (2D LC-ESI-MS/MS and LC-MALDI-TOF/TOF). The use of decoy strategies to validate the number of identified proteins according to a desired false positive rate (FPR) as well as application of the ProteinExtractor to overcome the protein inference problem minimizes the need for manual data validation. Days of manual processing time are condensed into hours of computing time. In parallel the use of a single data repository allows easy access to the combined information from different workflows and links to external tools complement the system for project-spanning comparisons of data sets.
Additionally, capabilities in data visualisation, reporting, data integrity and data security match the current high standards of the biotech industry. Researchers who want to submit their data to central repositories or publish their result are facing the problem of collecting all relevant information, methods, parameters, MS data, and search results. With ProteinScape, everything is already in place because the methods, data and results are stored in a project-oriented manner. The Search Result, in particular, can be easily exported to MS Excel, or a well-structured PDF file can be generated. In addition, a dedicated spectrum report for the“one hit wonders”, the proteins that are identified by means of a single peptide only, can be produced.
It is expected that in the future the ability to store large amounts of data in an effective way in combination with expert data mining tools will become more and more important. Proteomics is clearly moving in the direction of increased data size and larger numbers of technical and biological replicates. The importance of replicative experiments in identification studies has always been accepted, although many results have been achieved with only few replicates. However, when it comes to quantitative studies (label-free workflows in particular), a solid statistical analysis becomes mandatory. And this means an adequate number of biological and technical replicates. A dedicated database system like ProteinScape is fundamental for the administration of replicates and the flexibility that is needed for the various (supervised and unsupervised) statistical approaches.