Journal of Geology & Geophysics
Open Access
ISSN: 2381-8719
ISSN: 2381-8719
Research Article - (2017) Volume 6, Issue 5
In coastal areas, groundwater may represent the main resource for human needs. The over-exploitation of coastal aquifers could cause seawater intrusion that induces depletion both in quality and quantity of the water resource, with no negligible environmental impacts. Moreover, locally geological heterogeneities of the aquifer can affect the flow and transport processes. In such cases, an integrated hydro-geophysical approach could provide useful information to evaluate the response of the aquifer and to estimate changes in the main hydraulic parameters such as transmissivity and permeability. In this study Electrical Resistivity Tomography (ERT) survey combined with traditional techniques of measuring the main groundwater parameters have been performed to assess the hydrogeological properties of a coastal heterogeneous aquifer. The conventional interpretation of pumping test drawdown allowed to detect a hydraulic barrier located to a specific distance with respect to the pumping well; furthermore, the transmissivity of the portion of aquifer involved in the pumping and the corresponding changes of its hydraulic conductivity due to the presence of the barrier has been estimated. Confirming the conventional interpretation of the pumping test drawdowns, the ERT image was able to locate the hydraulic barrier over space, visualizing a high resistive body, located below the water table.
Keywords: karstic aquifer; pumping test; electrical resistivity tomography; hydrogeologic barrier
The dynamics of the coastal karstic aquifer have a very important role in the management of the water resource. Locally, geological heterogeneities and anisotropy affect flow and transport processes and constrain many aspects of quantitative hydrogeology, with impacts on the main hydraulic properties, such as permeability and transmissivity, of karstic and fractured aquifer. Moreover, these features affect the vulnerability of the aquifer, strongly influenced by the preferential pathway of contaminants in groundwater [1], by changes in groundwater storage [2], by the increase of salt water intrusion due to an over-exploitation of the water resources [3]. In the past, coastal aquifer dynamics have been studied using conventional hydrogeological techniques, such as in-situ tests, aimed at determining hydraulic parameters of the aquifer, or by means data collection of physical parameters of the groundwater [4]. During the last decades, the hydro-geophysics has emerged as a discipline that supports the conventional hydrogeological techniques by answering to three important issues: areal hydrogeological mapping, hydrological parameter estimation, and hydrological process monitoring [5,6]. Among geophysical methods, electrical resistivity tomography (ERT) is one of the most used techniques to characterize coastal aquifers because the electrical resistivity is very sensitive to water content and, moreover, to water salinity [7,8]. Specifically, ERT in time-lapse mode is able to monitor the coastal aquifer dynamics, by means of imaging fresh/salt water interface and by evaluating the groundwater salinity changes with time. Cassiani uses a saline tracer test to identify possible hydraulic connections between a shallow unconfined aquifer and a deeper confined aquifer with the advantage over traditional methods to follow the tracer movement by avoiding missing its plume. The dynamics of the saltwater intrusion in the coastland bounding the Venice Lagoon are monitored by means time-lapse ERT [9]. Using electrical techniques highlights the spatial heterogeneity of submarine coastal geology and its hydrogeologic control in a reef lagoon setting in order to evaluate submarine groundwater discharge [10]; in north western Crete, Soupios use different geophysical techniques, combined with geological, hydrolithological and tectonic survey, to provide a coastal aquifer assessment [11]. Neverthless, the promising non-invasive approach needs to be calibrated to provide quantitative estimation of the hydrological parameters. Recently, Kazakis have used geoelectrical methods for the estimation of aquifer hydraulic properties by using data from 21 pumping tests combined with groundwater electrical conductivity values [12], collected in 37 sites. They found a strong correlation between the hydraulic conductivity of the aquifer determined using electrical resistivity data and that derived from pumping tests analysis. In this study the conventional interpretation of the pumping test is coupled with geophysical survey in order to evaluate, from a qualitative point of view, the hydrogeological properties of the coastal aquifer.
Particularly, electrical techniques allowed to locate the position of a hydrogeological barrier, confirming the conventional interpretation of the pumping test drawdowns. Furthermore, the results of the pumping test allowed to quantitatively estimate the transmissivity of the portion of aquifer involved in the pumping and the corresponding changes of its hydraulic conductivity due to the presence of the barrier.
The experimental site lies in the area owned by the Water Research Institute (CNR-IRSA), in the industrial zone of the city of Bari (Southern Italy), just 2.3 km away from the coast (Figure 1). The geological setting of the study area is well described in the geological map and the hydrostratigraphic column. Locally, the outcropped Cretaceous sedimentary succession is characterized by the “Calcare di Bari” Formation (Figure 1a), made up of karsified and fractured limestone with frequent intercalations of dolomitic limestones and grey dolostones. The Quaternary deposits are referred to different sedimentary units. The oldest one, from the Pleistocene age, is the “Calcarenite of Gravina” Formation, constituted of litho-bioclastic calcarenites with a thickness that ranges from few meters up to 20 m [13]. The little canyons, named locally ‘lame’, formed by erosive activity of ephemeral streams, are filled with upper Pleistocene-Holocene deposits, made up of carbonate gravels with a reddish fine-grained matrix. The Quaternary sequence is completed by Holocene travertine deposits that appear at times in a narrow band, parallel to the coast. A wide and thick aquifer resides in the carbonate bedrock, characterized by a good permeability as a result of an intense fracturing of rock and a karst dissolving action [14]. The numerous karstic cavities, of different shapes and sizes, are often partially or completely filled by alluvial deposits named ‘terra rossa’ [13]. This specific feature, together with the irregular distribution of the fracture system and karstic channels, makes the aquifer strongly anisotropic. The rainfall, that mainly infiltrates through the more fractured and karstified areas and along the ‘lame’, recharges the aquifer. The groundwater flows through bedrock fractionated into distinct levels, separated by layers of compact rock. The piezometric head (Figure 1a), ranges from 15 m above sea level (asl), in the inner part, to 1 m asl near the coast, where the water table becomes almost flat and the hydraulic gradients becomes very low (about 0.1%). The average direction of groundwater flow is SSW–NNE, roughly perpendicular to the coastline. Particularly, in the experimental site the groundwater moves under slight confining pressure (Figure 1b) owing to a local deeper and greater compactness of water-bearing formations. The effects of karstic phenomena are present also below sea level by enhancing seawater encroachment into the coastal aquifer.

Figure 1: a) Geological map of the study area. b) Hydrostratigraphic column coming from drilling carried out in the experimental test site.
Long term pumping test
A long term pumping test was performed in the CNR-IRSA experimental site to investigate the influence of a prolonged withdrawal, on the chemical-physical groundwater characteristics of the investigated coastal aquifer portion (Figure 2). The experimental site consists of 6 wells of which 5, specially made cross-oriented (NNE/SSW and WNW/ESE), have been used for monitoring during the pumping test. The well P37 was used as extraction well while the well P27, placed at about 160 m down gradient from the first one, was used as monitoring well, as well as the P37 itself. The pumping was conducted for 16 days with a constant pumping rate equal to 50 m3/h; the extracted water was reinjected into the Lamasinata, an artificial channel, by means of a piping system. This channel, generally dry except during the rain events, constitutes a preferential way for groundwater recharge. During the test the water levels were manually registered in P37, while they were monitored continuously in P27, together with the temperature and EC, by means of probes located at specific depths. During the monitoring period, rainfall data were also acquired. In this paper we focus on the effect of the prolonged pumping by monitoring the water level in the well P37 and in one of the monitoring wells P27. Detailed description of the experimental set up of the pumping tests and of the acquired data by means of the monitoring are well described [15].
ERT survey
The purpose of ERT surveys is to determine the subsurface resistivity distribution by making measurements on the ground surface. The resistivity measurements are acquired by injecting current into the ground, through two current electrodes, and by measuring the resulting voltage difference at other two potential electrodes. An apparent resistivity value (ratio between current and potential values) is calculated multiplying the resistance for a geometric factor. The calculated resistivity is an “apparent” value because it is referred to a homogeneous subsurface. To determine the true subsurface resistivity from the apparent ones, it needs to solve the inversion problem [16]. During the pumping, the geophysical survey has been performed by means of an ERT profile, 235 m long, using 48 stainless steel electrodes, 5 m spaced, to investigate about 50 m depth from the surface. The ERT profile has been approximately oriented perpendicularly to the water flow but unsymmetrically, with respect to the extraction well, due to the limited space (Figure 2). However, the profile is located hydraulically downgradient, hence in the better position to visualize the effects of the pumping. The electrical resistivity data have been collected using Syscal Switch Pro 48 resistivity-meter using four different configuration arrays (Wenner, Wenner-Schlumberger, poledipole, pole-pole) in order to obtain a more reliable ERT model despite of high background noise of the site. Each configuration array differs for the investigation depth, the sensitivity to lateral or vertical changes of the subsurface resistivity, the horizontal coverage of the data and the signal strength. As rule of thumb, Wenner and Wenner-Schlumberger arrays have high sensitivity to vertical changes, moderate investigation depth, relatively poor horizontal coverage and high signal to noise ratio. On the contrary, the pole-dipole and pole-pole arrays are characterized from the high sensitivity to lateral changes, the widest horizontal coverage and the highest investigation depth, but they are sensitive to telluric noise and have the lowest resolution [16]. For the pole-pole and pole-dipole arrays, the remote poles (P1) have been placed at more than 500 m from the ends of the ERT profile, in order to be considered "infinite" sources (Figure 2). Before the collection of the electrical resistivity measurements, the resistance contact between the electrodes and the ground has been measured in order to ensure a good flow of electrical current into the subsurface. The resistance contact is resulted always less than 5 KΩ. The transmission parameters, used for the acquisitions, are specified in the (Table 1). The RES2DINV software has been used for inversion process [17]. The first step for the raw experimental data treatment is based on the data quality analysis. It consists of a data filtering by removing the data points that overcome the threshold values (Table 2). As expected, the data sets of pole-dipole and pole-pole have shown too low potential values due to background noise caused by underground utilities and man-made structures distributed throughout the area. On the contrary, Wenner and Wenner-Schlumberger have yielded data set less affected by noise. After the raw data treatment, the complete data set included 351 data points for Wenner, that is more than 97% of the whole data set acquired and 400 data points for Wenner-Schlumberger, that is almost 70% of the whole “raw”data set. For this reason, only data set collected with Wenner and Wenner-Schlumberger array have been processed in the inversion procedure.

Figure 2: Test site with the location of the pumping (P37) and monitoring well (P27). The ERT survey and remote electrode positions are also indicated. E1 and E48 indicate the sequential number of the electrodes along the profile.
| >Injection pulse duration | >250 ms |
|---|---|
| >Minimum and maximum number of cycles for each measurement | >3-6 |
| >Standard deviation of the measurements in a cycle | >5% |
Table 1: Transmission parameters used in ERT surveys.
| Lower Bound | Upper Bound | |
|---|---|---|
| Injection current (mA) | 5 | 1000 |
| Potential measurement (mV) | 5 | 5000 |
| Deviation standard of the measurements in a cycle (%) | 0 | 5 |
Table 2: Error bounds for ERT data filtering.
Pumping test
Analysing the data collected during the pumping test it was evident that in the extraction well, P37 (Figure 3), the water depth dropped immediately of about 30 cm after that the pumping started and it continued to increase gradually over time in following days. After that the pumping was stopped, the water depth in P37 rose instantly, although it not reached the initial value measured before the start of the pumping. A rapid recovery of the initial water level was recorded after slight rain events occurred few days after the stopping of pumping, showing that the studied portion of aquifer is characterized by a quick response to rainfall events.

Figure 3: Rainfall and water levels values measured in the extraction well (P37) and in the monitoring well (P27) before, during and after the stop of long-term pumping test.
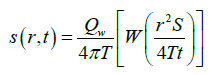
Data collected during the pumping allowed estimations of the fractured aquifer transmissivity under unsteady flow conditions. (Figure 4) shows the drawdown s (r,t) measured manually into the extraction well, fitted by the Theis-Jacob (solid lines) approximation to the analytical solution for radial unsteady flow towards a well in a confined aquifer [18]

Figure 4: Drawdown measured manually into the extraction well, fitted by the Theis-Jacob approximation (solid lines) for radial unsteady flow in a confined aquifer.
 (1)
(1)
for t ≤ tp where tp is the pumping period (t); Qw is the pumping rate, W is the well function for a confined aquifer (-); S is the aquifer storativity (-) and T is the hydraulic transmissivity of the parallel set of fractures (L2t-1) [19]
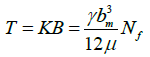 (2)
(2)
where K is the hydraulic conductivity of the set of parallel Nf fractures (Lt-1) with same mean aperture of bm (L); Nf is defined by imposing Nf × bm =ne×B, where ne is the effective porosity (≅0.003±0.002) of the studied fractured aquifer given by tracer tests [20].
In view of Equation (1) the transmissivity of the fractured aquifer was computed close to T=0.05-0.1 m2/s. These calculations were performed using Matlab (2012). The value of the storativity, S, was assumed to be < 0.3%, i.e. close to the effective porosity (0.3%) due to the very low aquifer confinement (<1 m).
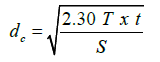
Data collected into the pumping well highlight a reduction of aquifer permeability (and conductivity) at specific distances from extraction well. These positions of hydraulic conductivity changes from 0.1 to 0.07, and 0.05 m2/s, respectively, were determined by means of times t1 and t2, provided by graphical estimations in (Figure 4). The distance dc (L) of each aquifer conductivity change from extraction well can be estimated by applying [21]:
 (3)
(3)
Equation (3) provided distances of 2314 m and 125 m for changes of the aquifer transmissivity at t1 and t2, respectively.
ERT
Pseudo-sections of apparent resistivity (Figure 5a and 5b) have been produced in order to provide a qualitative preliminary representation of the data set; both for Wenner and Wenner-Schlumberger cross sections they highlight a strong lateral and vertical heterogeneity, that results in a complex hydro-geophysical model [22]. Particularly, the central part of the pseudo-sections is characterized by a conductive area, with apparent resistivity values ρa less than 50 Ω m, surrounded by resistive areas, with high values of apparent resistivity (ρa > 500 Ω m. The analysis of the pseudo-section has driven the inversion strategy. The ERT cross sections are reported in logarithmic scale to assess, simultaneously, local resistivity both in high-resistivity and lowresistivity sectors. The maximum depth of investigation is about 40 m from the surface level using Wenner array, while it reaches almost 50 m using Wenner-Schlumberger array. The cross sections resistivity (Figure 6a and 6b) put in evidence the leading presence of a resistive body (ρ >3000 Ω m) in the central part of the section. The resistive body extends approximately from 80 m to 160 m starting from the first electrode (E1) of the ERT line and covers a depth ranging from 15 m to 30 m below ground level. The low resolution of the ERT images, depending on the high inter-electrode spacing, could affect the geometry of the resistive body. Comparing the geophysical results with stratigraphic information, obtained from the wells located in the CNRIRSA experimental site, by considering that this high resistivity body is completely below the water table, hence within the saturated zone, it can be referred to a hydraulic barrier constituted by a dolomitic layer, characterized by a very low permeability [23]. The distance between the core of the hydraulic barrier respect to the pumping well is about 130 m consistent with the results obtained by hydraulic analysis of the pumping test data.

Figure 5: Pseudo-sections of apparent resistivity related to, a) Wenner- Schlumberger array, b) Wenner array, respectively.

Figure 6: Cross sections of electrical resistivity related to, a) Wenner- Schlumberger array, b) Wenner array, respectively.
An hydro-geophysical approach has been proposed in order to study the response of an heterogeneous karstic coastal aquifer, when it is subjected to a stress induced by a long term pumping. During the pumping, traditional monitoring techniques for measuring the main groundwater parameters (water level, temperature and EC) have been applied. The traditional pumping test analysis shows the presence of a hydraulic barrier that causes a change in hydraulic conductivity of the aquifer, due to a strong change in fracture apertures. This result was corroborated by the ERT image, able to detect the hydraulic barrier related to a resistive body, located completely within the saturated zone, and referred to a dolomitic rock, characterized by a very low permeability. Furthermore, the results of the pumping test allowed to quantitatively estimate the transmissivity of the portion of aquifer involved in the pumping and the corresponding changes of its hydraulic conductivity due to the presence of the barrier.
This study was funded by the VIGOR Project, within the activities of the Interregional Programme ‘Renewable Energies and Energy Savings FESR 2007– 2013’.