Journal of Geology & Geophysics
Open Access
ISSN: 2381-8719
ISSN: 2381-8719
Research Article - (2016) Volume 5, Issue 1
EE-index (EDst, EUEL), has been used to study the longitudinal dependence and seasonal variation of the equatorial electrojet (EEJ). The EUEL data eliminates many sources of disturbances by subtracting the median value of horizontal component (H) and the E Dst from H component data. EUEL data at a chain of stations along the dip equator have been analyzed to provide a detailed study on the equatorial electrojet. Data from eight stations (ANC, ILR, AAB, TIR, LKW, BCL, DAV and YAP stations) have been used for a period of three years (2009, 2010 and 2011). The longitudinal dependence has been studied for each year, a very good agreement between each year results has been found. This study shows that the magnetic signature of the EEJ is stronger in South America with a maximum at about longitude 77°W; and weaker in Asia, with a minimum in India, between longitudes 70°E and 90°E. The seasonal variations of the equatorial electrojet have been studied by both the whole data set (disturbed and quiet days) and quiet days’ data. It has been proved that there is a semiannual variation in the equatorial electrojet with equinoctial maxima.
Keywords: EEJ-MAGDAS, Equatorial electrojet, Ground magnetic stations, EE index
Egedal [1,2] discovered an electric current that flows in a narrow zone of approximately 600 km in width above the magnetic dip equator. This intense electric current, which in daytime flows in an eastward direction was named the “equatorial electrojet” by Chapman [3]. The EEJ represents a rather large enhancement of the diurnal variation in the horizontal or surface component of the geomagnetic field at and in the vicinity of the dip equator. The enhanced current was explained as being because of an abnormally large electrical conductivity [4,5]. Features of EEJ have been described for longitude regions of 75°W (Forbush and Casaverde 1961), 15°–19°E, 75°E, 5°W [6-12].Most of the first studies were carried out to explain the generating mechanism of EEJ [5,13]. Since the 1970s, some theories and physical models of the ionospheric dynamo have been developed in order to explain the mechanism of the EEJ flow and its main features (day to day, seasonal variability, counter-electrojet, electrodynamic processes of coupling with global scale current systems, etc.,) [14-19]. Another approach to simulate the EEJ has been done through the analysis of EEJ magnetic effects assuming simple current configurations. These configurations are the line current the thin-band current with different modes of latitudinal dependence: the uniform and parabolic and the “fourth degree” current distribution as well as the thick current distribution incorporating latitude and height dependence [3,6,7,20].
In the present study, the EEJ has been estimated using simultaneous ground based geomagnetic data recorded at 8 stations from MAGnetic Data Acquisition System (MAGDAS) at different longitudes (Figure 1 and Table 1). Also, the data of the three quietest days in each month during three years (2009, 2010 and 2011) has been analyzed. The obtained results have been used to study the longitudinal dependence and the seasonal variation of EEJ.
| Stations inside the equatorial region | ||||||
|---|---|---|---|---|---|---|
| Abbrev. | Station name | Country | GG Lat. | GG Long. | GM Lat. | GM Long. |
| ILR | Ilorin | Nigeria | 8.50 | 4.68 | -1.82 | 76.80 |
| AAB | Adis Ababa | Ethiopia | 9.04 | 38.77 | 0.18 | 110.47 |
| TIR | Tirunelveli | India | 8.70 | 77.80 | 0.21 | 149.30 |
| LKW | Langkawi | Malaysia | 6.30 | 99.78 | -2.32 | 171.29 |
| BCL | Bac Lieu | Vietnam | 9.32 | 105.71 | -0.66 | 177.96 |
| DAV | Davao | Philippine | 7.00 | 125.40 | -1.02 | 196.54 |
| YAP | Yap Island | FSM | 9.50 | 138.08 | 1.49 | 209.06 |
| ANC | Ancon | Peru | -11.77 | -77.15 | 0.77 | 354.33 |
Table 1: Stations under investigation.
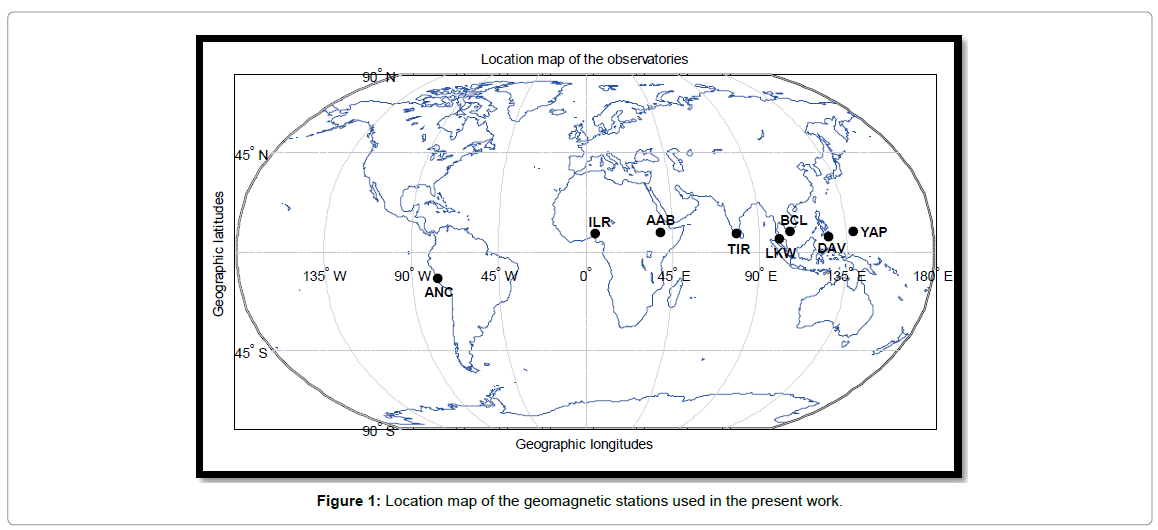
Figure 1: Location map of the geomagnetic stations used in the present work.
At first, the three years (2009, 2010 and 2011) for 8 stations have been analyzed (Table 1). Here we deal with the whole data then focus on the three quietest days in each month for the whole period (Table 2).
| Months | Quiet days in 2009 | Quiet days in 2010 | Quiet days in 2011 | ||||||
| January | 12 | 22 | 23 | 07 | 09 | 17 | 05 | 23 | 30 |
| February | 02 | 08 | 17 | 20 | 21 | 27 | 03 | 09 | 27 |
| March | 02 | 07 | 09 | 21 | 22 | 23 | 15 | 16 | 26 |
| April | 02 | 04 | 23 | 10 | 18 | 26 | 10 | 26 | 27 |
| May | 12 | 25 | 27 | 23 | 24 | 27 | 08 | 12 | 20 |
| June | 01 | 12 | 17 | 08 | 12 | 20 | 03 | 28 | 29 |
| July | 17 | 18 | 19 | 10 | 17 | 18 | 16 | 27 | 28 |
| August | 15 | 16 | 24 | 21 | 22 | 30 | 18 | 19 | 31 |
| September | 23 | 24 | 29 | 11 | 12 | 30 | 01 | 19 | 23 |
| October | 10 | 14 | 20 | 01 | 02 | 14 | 22 | 28 | 29 |
| November | 06 | 23 | 29 | 06 | 19 | 26 | 09 | 14 | 19 |
| December | 01 | 03 | 04 | 10 | 11 | 22 | 16 | 26 | 27 |
Table 2: The three international quietest days.
The data used in the present work has been taken from the International Center for Space Weather Science and Education ICSWSE, Kyushu University, Japan. The data are in three forms H, ER, and EUEL data; where:
1 H component data: Variation in the North-South component at a certain magnetic station.
2 ER data (ΔH): The median value of the H component data, which is determined for the period from the start time of the observation to the end time, is subtracted from the H component data for each station.
3 EUEL data: Is calculated by subtracting the EDst index from the ER data.
The EE-index (EDst (Equatorial Disturbance in storm time), EU (index for equatorial electrojet), and EL (index for counter electrojet)), is proposed by Uozumi [21] to monitor temporal and long-term variations of the equatorial electrojet by using the MAGDAS/CPMN real-time data.
In the present study we deal with EUEL data in most cases.
Figures 2 and 3 represent the EUEL data for all magnetic observatories under investigation. The gaps that appear in most plots are due to problems in the measuring instrument.
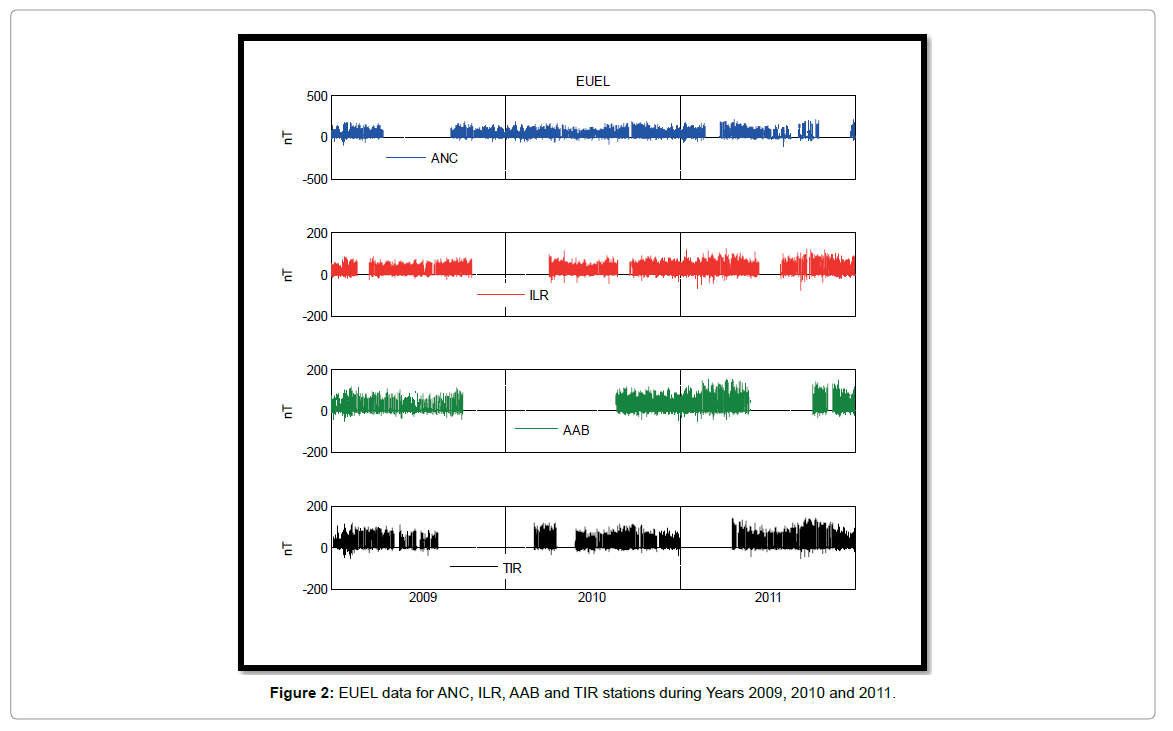
Figure 2: EUEL data for ANC, ILR, AAB and TIR stations during Years 2009, 2010 and 2011.
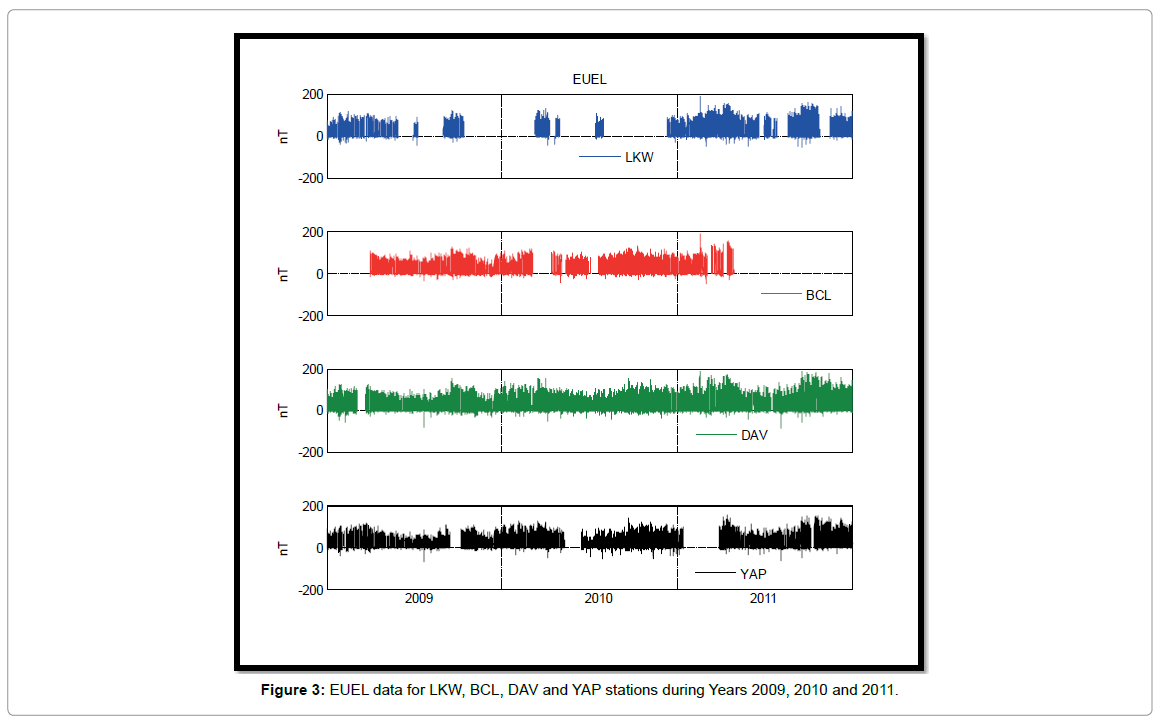
Figure 3: EUEL data for LKW, BCL, DAV and YAP stations during Years 2009, 2010 and 2011.
In this part, the EEJ has been estimated by measuring the maximum value of the EUEL for each quiet day at 12 Local Time at each station. Tables 3-5 represent the values of EEJ in the three quietest days each month during years 2009, 2010 and 2011 for the equatorial stations ANC, ILR, AAB, TIR, LKW, BCL, DAV and YAP.
| Dates | ANC | ILR | AAB | TIR | LKW | BCL | DAV | YAP |
| 12/01/2009 | 128.4 | 41.7 | -- | 39.5 | 43.7 | -- | 55.6 | 51.9 |
| 22/01/2009 | 55.3 | 21.8 | 53.9 | 66 | 46.7 | -- | 84.6 | 67.1 |
| 23/01/2009 | 55.5 | 32 | -- | 53.7 | 64.3 | -- | 82.7 | 66.5 |
| 02/02/2009 | 170 | 51.8 | 67.5 | 69 | 84.5 | -- | 89.8 | 74.7 |
| 08/02/2009 | 93.5 | 59.6 | 92.9 | 68.6 | 51 | -- | 90.1 | -- |
| 17/02/2009 | 118.3 | 72 | 82.4 | 68.9 | 65.7 | -- | 74.5 | 74.6 |
| 02/03/2009 | 132.1 | -- | 59.1 | 70.4 | 91 | -- | 94.2 | 96.4 |
| 07/03/2009 | 76.9 | -- | 55.9 | 60.4 | 66 | -- | -- | 65.6 |
| 09/03/2009 | 132.9 | -- | 69.1 | 77.5 | 68.8 | -- | -- | 105 |
| 02/04/2009 | 77.4 | 50.5 | -- | 76.2 | 97.7 | 107.2 | 113.6 | 98 |
| 04/04/2009 | 93.3 | 38.3 | 88.3 | -- | 91.3 | 93.2 | 92.1 | 66.5 |
| 23/04/2009 | -- | 39.4 | -- | 63.1 | 54 | 65.7 | 82 | 75.1 |
| 12/05/2009 | -- | 43.2 | 49.6 | 65.7 | 76 | 76.1 | 83.9 | 59.5 |
| 25/05/2009 | -- | 61.7 | 100.4 | -- | 93.2 | 92.5 | 85.4 | 79.2 |
| 27/05/2009 | -- | 54.6 | 74.3 | 77.1 | 74.8 | 76.8 | 70.6 | 60.2 |
| 01/06/2009 | -- | 58.5 | -- | 41.1 | -- | 51.2 | 35.3 | 28.6 |
| 12/06/2009 | -- | 52.4 | 81.8 | 57 | -- | 59.4 | 48.9 | 34.7 |
| 17/06/2009 | -- | 42.6 | 35.9 | 48.8 | -- | 61.3 | 59.7 | 46 |
| 17/07/2009 | -- | 38.8 | 54.2 | 61.9 | -- | 53.6 | 58.9 | 51.1 |
| 18/07/2009 | -- | 51.8 | 55.7 | 45.4 | -- | 42.6 | 39.1 | 31.5 |
| 19/07/2009 | -- | 38.7 | 35 | 44.4 | -- | 54.9 | 47.9 | 40.9 |
| 15/08/2009 | -- | 56.9 | 74.5 | -- | -- | 94.7 | 73.2 | 47.6 |
| 16/08/2009 | -- | 45.2 | 48 | -- | -- | 62.7 | 58 | 35.9 |
| 24/08/2009 | -- | 45.3 | -- | -- | -- | 78.7 | 66.4 | 53.2 |
| 23/09/2009 | 160.2 | 66.6 | -- | -- | 80.8 | 85.7 | 94.1 | -- |
| 24/09/2009 | 159.5 | 53.2 | 83.7 | -- | 89.9 | 94 | 107.1 | -- |
| 29/09/2009 | 147.9 | 57.9 | 69.2 | -- | 75.1 | 71.1 | 64.1 | -- |
| 10/10/2009 | 108.7 | 58.4 | -- | -- | 76.4 | 82.5 | 98 | 82.2 |
| 14/10/2009 | 99.9 | 39.5 | -- | -- | 56.3 | 61.2 | 73.3 | 61.7 |
| 20/10/2009 | 137.5 | 67.5 | -- | -- | -- | 115.1 | 108.1 | 81 |
| 06/11/2009 | 115.6 | -- | -- | -- | -- | 87.1 | 97.2 | 83.1 |
| 23/11/2009 | 83.5 | -- | -- | -- | -- | 58 | 53 | 45.9 |
| 29/11/2009 | 104 | -- | -- | -- | -- | 39.9 | 45 | 48 |
| 01/12/2009 | 88.9 | -- | -- | -- | -- | 23.7 | 24.8 | 39.3 |
| 03/12/2009 | 128.4 | -- | -- | -- | -- | -- | 24.2 | 22.7 |
| 04/12/2009 | 111.7 | -- | -- | -- | -- | -- | 51.7 | 41.4 |
Table 3: Estimated EEJ in 2009.
| Dates | ANC | ILR | AAB | TIR | LKW | BCL | DAV | YAP |
|---|---|---|---|---|---|---|---|---|
| 07/01/2010 | 114.4 | -- | -- | -- | -- | 105.8 | 138.7 | 106.2 |
| 09/01/2010 | 80.4 | -- | -- | -- | -- | -- | 81.7 | 78.4 |
| 17/01/2010 | 131.5 | -- | -- | -- | -- | 48.5 | 69.4 | 60.3 |
| 20/02/2010 | 115.4 | -- | -- | -- | -- | 101.6 | 123 | 102.5 |
| 21/02/2010 | 78.5 | -- | -- | -- | -- | 87.8 | 104 | 92.4 |
| 27/02/2010 | 122.1 | -- | -- | -- | -- | 86.7 | 102.7 | 91.6 |
| 21/03/2010 | 119.6 | -- | -- | 87.3 | 75.2 | -- | 97.9 | 93.6 |
| 22/03/2010 | 109.1 | -- | -- | 87 | 80.7 | -- | 104.1 | 101.8 |
| 23/03/2010 | 106.4 | -- | -- | 74.3 | 76.5 | -- | 87.2 | 86.8 |
| 10/04/2010 | 72.5 | 60.2 | -- | 78 | -- | -- | 95.1 | 98 |
| 18/04/2010 | 123.9 | 75.9 | -- | -- | -- | -- | 90.4 | 74.5 |
| 26/04/2010 | -- | 64.4 | -- | -- | 98.9 | 93.9 | 98.4 | 95.9 |
| 23/05/2010 | 59.7 | 41.1 | -- | -- | -- | 77 | 83 | -- |
| 24/05/2010 | 127.2 | 51.7 | -- | -- | -- | 54.3 | 71.8 | -- |
| 27/05/2010 | 90.7 | 54.1 | -- | 72.2 | -- | 71.8 | 75.1 | -- |
| 08/06/2010 | 57.9 | 40.2 | -- | 71.8 | -- | 83,7 | 78.8 | -- |
| 12/06/2010 | 87.8 | 53.8 | -- | 66.8 | -- | 68.6 | 74.1 | -- |
| 20/06/2010 | 71.1 | 30.1 | -- | 43.8 | -- | 64.5 | 36.6 | 22.6 |
| 10/07/2010 | 76.7 | 52.4 | -- | 53.7 | -- | -- | 61.4 | 35.7 |
| 17/07/2010 | 82.6 | 44 | -- | 69 | 82.3 | -- | 71.6 | 53.4 |
| 18/07/2010 | 104.9 | 34.4 | -- | 66.5 | 90.7 | -- | 81.9 | 57.8 |
| 21/08/2010 | 99.9 | 48.7 | 58.7 | 50.9 | -- | -- | 86.4 | 62.3 |
| 22/08/2010 | 69.3 | 44.6 | 41.9 | 66.9 | -- | 71.6 | 72.2 | 56.6 |
| 30/08/2010 | 138.5 | -- | 75.8 | 70.5 | -- | 63.2 | 64.6 | 50 |
| 11/09/2010 | 156.3 | -- | 103.3 | 102.6 | -- | 103 | 101.1 | 72.1 |
| 12/09/2010 | 155.8 | -- | 72.6 | 91.3 | -- | 94.2 | 91.5 | 71 |
| 30/09/2010 | 134.9 | 53.7 | 95 | 99.5 | -- | 107 | 118.2 | 102.5 |
| 01/10/2010 | 136 | 55.3 | 44.1 | 67.6 | -- | 86.3 | 105.3 | 93.6 |
| 02/10/2010 | 160 | 43.8 | 67.1 | 74.1 | -- | 89.5 | 86 | 74 |
| 14/10/2010 | 120.8 | 59.8 | 71.4 | 64.6 | -- | 80.2 | 99.4 | 84.3 |
| 06/11/2010 | 109.2 | 70.2 | 99.2 | 69.9 | -- | 92.5 | 116.2 | 91.7 |
| 19/11/2010 | 121.9 | 46.1 | 69.9 | 74.9 | -- | 76.7 | 86.5 | 80.3 |
| 26/11/2010 | 93.9 | 62.2 | 95.2 | 64.9 | -- | 89.2 | 99.3 | 92.7 |
| 10/12/2010 | 110.7 | 80.1 | 99.3 | 76.8 | -- | 105.7 | 125.1 | 110.6 |
| 11/12/2010 | 104.4 | 59.5 | 53.4 | 28.6 | 47.6 | 50.2 | 68.4 | 71.6 |
| 22/12/2010 | 79.9 | 61.1 | 87.3 | 78.4 | 95.9 | 97 | 89.6 | 80.9 |
Table 4: Estimated EEJ in 2010.
| ANC | ILR | AAB | TIR | LKW | BCL | DAV | YAP | |
|---|---|---|---|---|---|---|---|---|
| 05/01/2011 | 84.1 | 57.8 | 66.6 | -- | 58.7 | 52.5 | 81.2 | -- |
| 23/01/2011 | 131.9 | 61.5 | 69.3 | -- | 98.1 | 95 | 114.1 | -- |
| 30/01/2011 | 99.7 | 34.3 | 62.1 | -- | 72.1 | 71 | 80.3 | -- |
| 03/02/2011 | 83.2 | 60 | 89.7 | -- | 53.4 | 47.5 | 66.9 | -- |
| 09/02/2011 | 133.1 | 70.6 | 79.5 | -- | 91.3 | 94 | 113.6 | -- |
| 27/02/2011 | -- | 43.4 | 77.3 | -- | 71.7 | 73.4 | 89.5 | -- |
| 15/03/2011 | -- | 53.6 | 82.8 | -- | 121.7 | 123.9 | 149.5 | -- |
| 16/03/2011 | -- | 63.8 | 99.1 | -- | 111.1 | -- | 110.2 | -- |
| 26/03/2011 | 169 | 78.6 | 118.2 | -- | -- | 106.2 | 98.7 | -- |
| 10/04/2011 | 129.1 | 79.3 | 131 | -- | 116.2 | -- | 117.7 | 95.7 |
| 26/04/2011 | 110.2 | 75.7 | 93.7 | 109.2 | 119.3 | 117.4 | 129.3 | 105.2 |
| 27/04/2011 | 155.3 | 77.3 | 104.9 | 106.9 | 114.6 | -- | 135 | 106.5 |
| 08/05/2011 | 111.3 | 61.3 | 77 | 82.2 | 93 | -- | 106.3 | 80.3 |
| 12/05/2011 | 106.2 | 72.8 | 90.1 | 80.3 | 75.5 | -- | 95 | 73.8 |
| 20/05/2011 | 129.7 | 71.3 | 117.3 | 88.6 | 94 | -- | 91.9 | 70.2 |
| 03/06/2011 | 75.2 | 57.6 | -- | 56.7 | 75.5 | -- | 74.8 | 65.8 |
| 28/06/2011 | 102.9 | -- | -- | 74.3 | -- | -- | 74.6 | 29.9 |
| 29/06/2011 | 128.1 | -- | -- | 88.2 | -- | -- | 86 | 69.7 |
| 16/07/2011 | 91.6 | -- | -- | 75.3 | -- | -- | -- | 59.7 |
| 27/07/2011 | -- | -- | -- | 74.9 | 77.3 | -- | 68.5 | 59.4 |
| 28/07/2011 | -- | -- | -- | 67.3 | 85.3 | -- | 99.9 | 76.8 |
| 18/08/2011 | -- | 62.1 | -- | 67.5 | -- | -- | 123.6 | 110.8 |
| 19/08/2011 | -- | 73.6 | -- | 85.6 | 107.5 | -- | 93.6 | 69.4 |
| 31/08/2011 | -- | 55.5 | -- | 60.5 | 74 | -- | 80.1 | 74.3 |
| 01/09/2011 | -- | 72.9 | -- | -- | 111.8 | -- | 119.7 | 97.7 |
| 19/09/2011 | 177.8 | 60.1 | -- | 141.3 | 143.3 | -- | 159.5 | 127.5 |
| 23/09/2011 | -- | -- | -- | 95.5 | 118.6 | -- | 146.7 | 116.5 |
| 22/10/2011 | -- | 91.8 | 112 | 123.7 | 141 | -- | 121.6 | 104.8 |
| 28/10/2011 | -- | 83 | 120 | 116.3 | -- | -- | 156.7 | 126.2 |
| 29/10/2011 | -- | 80.1 | 106.4 | 106.4 | -- | -- | 162 | 138.8 |
| 09/11/2011 | -- | 84.7 | -- | -- | -- | -- | 106.6 | 110.2 |
| 14/11/2011 | -- | 94.9 | -- | 106.8 | -- | -- | 177.3 | 145.2 |
| 19/11/2011 | -- | 53.3 | 45.7 | 52 | 81.6 | -- | 97.6 | 79.3 |
| 16/12/2011 | -- | 50.5 | 75.5 | 54.6 | 76.9 | -- | 115.7 | 112.8 |
| 26/12/2011 | -- | 49 | 72.5 | 67 | 90.9 | -- | 119.6 | 109 |
| 27/12/2012 | 153.9 | 81.7 | 82 | -- | 80 | -- | 94 | 100.6 |
Table 5: Estimated EEJ in 2011.
Longitudinal dependence during years 2009, 2010 and 2011
The longitudinal dependence of the EEJ is estimated through surface measurements of EUEL along the dip-equator. We use available magnetic data recorded at different longitudinal sectors.
In order to reduce the variables that may affect the strength of the EEJ, we will analyze simultaneous records from available stations for each year. The EEJ is given by the mean value of the conjoint days of EUEL.
In year 2009, there were only three conjoint days (22/01/2009, 02/02/2009 and 17/02/2009) between seven stations (ANC, ILR, AAB, TIR, LKW, DAV and YAP), while in year 2010 there were eleven conjoint days (22/08/2010, 30/09/2010, 01/10/2010, 02/10/2010, 14/10/2010, 06/11/2010, 19/11/2010, 26/11/2010, 10/12/2010 11/12/2010 and 22/12/2010) between seven stations (ANC, ILR, AAB, TIR, BCL, DAV and YAP). In year 2011, there were five conjoint days (26/04/2011, 27/04/2011, 08/05/2011, 12/05/2011 and 20/05/2011) between seven stations (ANC, ILR, AAB, TIR, LKW, DAV and YAP).
As shown in Figure 4, there is a very good agreement between the trends of the equatorial electrojet strength in the three studied years.
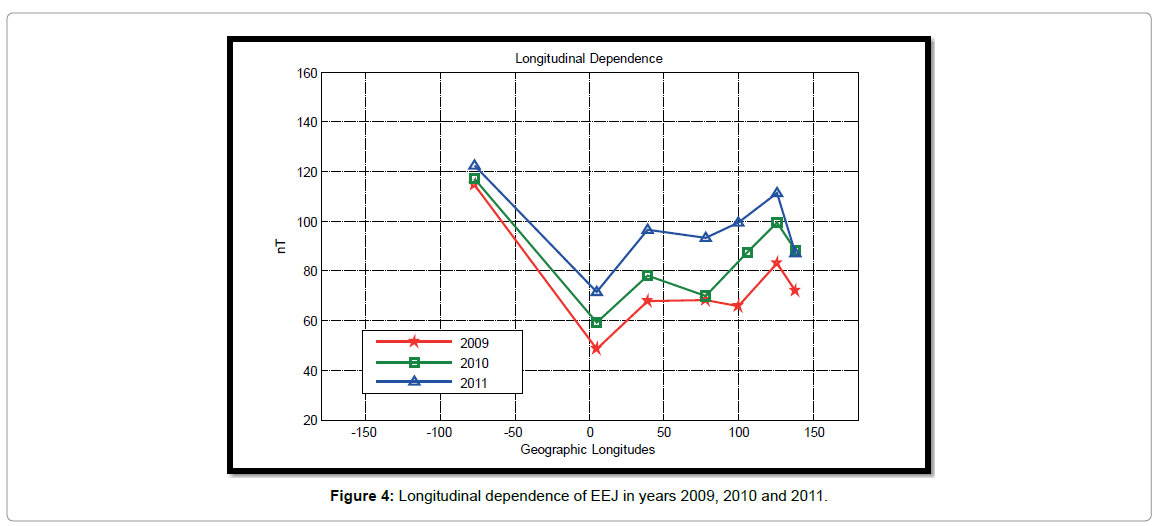
Figure 4: Longitudinal dependence of EEJ in years 2009, 2010 and 2011.
Mean longitudinal dependence
The longitudinal dependence of the EEJ is expressed by a numerical spline function estimated by calculating the mean value of the three years for each station.
Figure 5 shows that the magnetic signature of the EEJ is stronger in South America with a maximum at about 77°W. It is followed by a minimum in West Africa at about 4°E. The EEJ magnetic signature is weak in Asia-except Philippine, with a minimum in India, between 70°E and 90°E. A secondary maximum is at about 125°E. These longitude variations of the EEJ magnetic effect roughly follow variations of the inverse main field (1/B) at the dip equator.
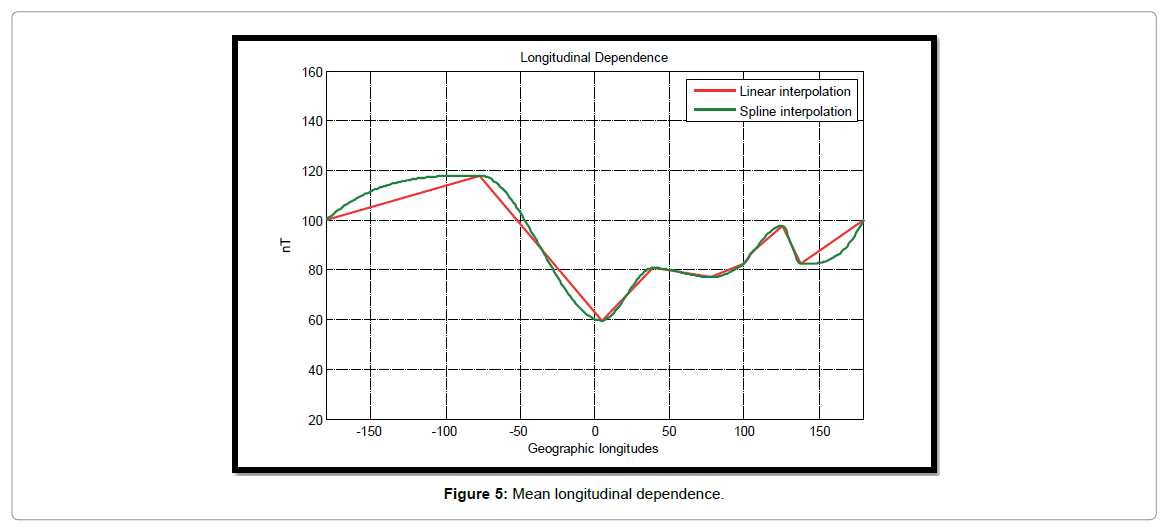
Figure 5: Mean longitudinal dependence.
Seasonal variation using whole data set
Figure 6 shows 30 day running means of the daily EUEL values for DAV station. These reveal clearly the presence of semiannual variation of the EEJ that maximizes during equinoctial months.
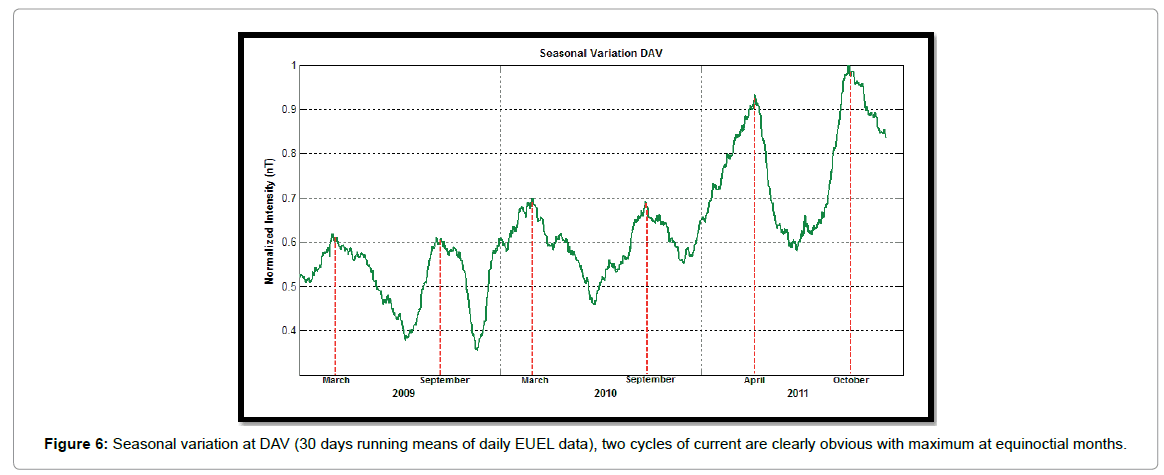
Figure 6: Seasonal variation at DAV (30 days running means of daily EUEL data), two cycles of current are clearly obvious with maximum at equinoctial months.
The seasonal variation of equatorial electrojet at DAV station reveals two cycles a year, each cycle reach maximum at equinoctial months. In year 2009 the EEJ started increasing until reaches maximum in March then decreased till midyear, the next cycle started from midyear then reached maximum in September and again started decreasing till end of the year. The same trend reoccurred in year 2010. In year 2011 the EEJ reached maximum in April and October.
Seasonal variation using quiet days
In this section we study the stations that almost have no or at least few missing days each year. These are, in 2009 DAV and YAP stations, in 2010 ANC station, DAV station and YAP station, in 2011 ILR station, LKW station and DAV station.
The number of day in the year is plotted against its EUEL value then a 4th degree polynomial fitting is performed for each station.
Figures 7-14 show clearly the semiannual variation of the equatorial electrojet.
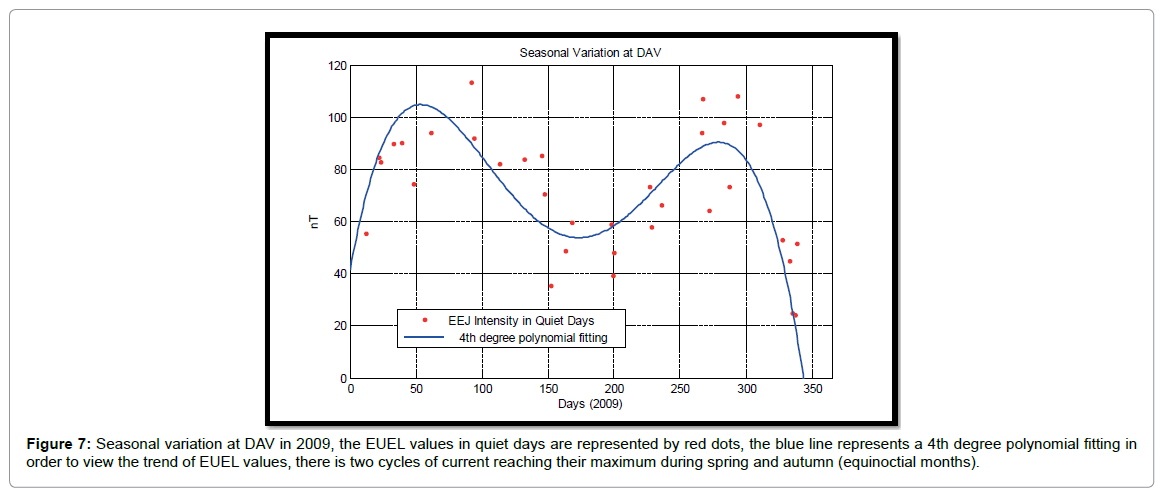
Figure 7: Seasonal variation at DAV in 2009, the EUEL values in quiet days are represented by red dots, the blue line represents a 4th degree polynomial fitting in order to view the trend of EUEL values, there is two cycles of current reaching their maximum during spring and autumn (equinoctial months).
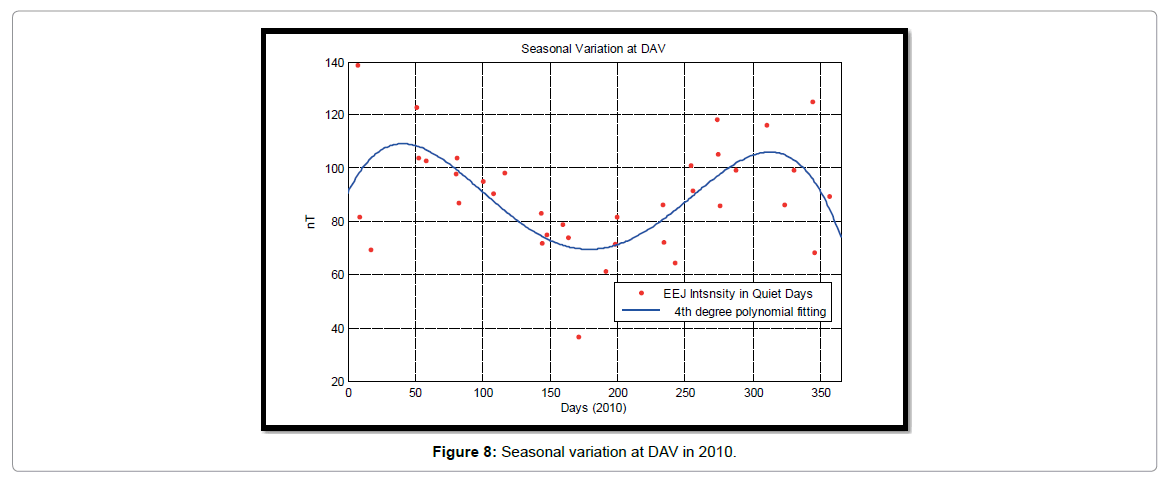
Figure 8: Seasonal variation at DAV in 2010.
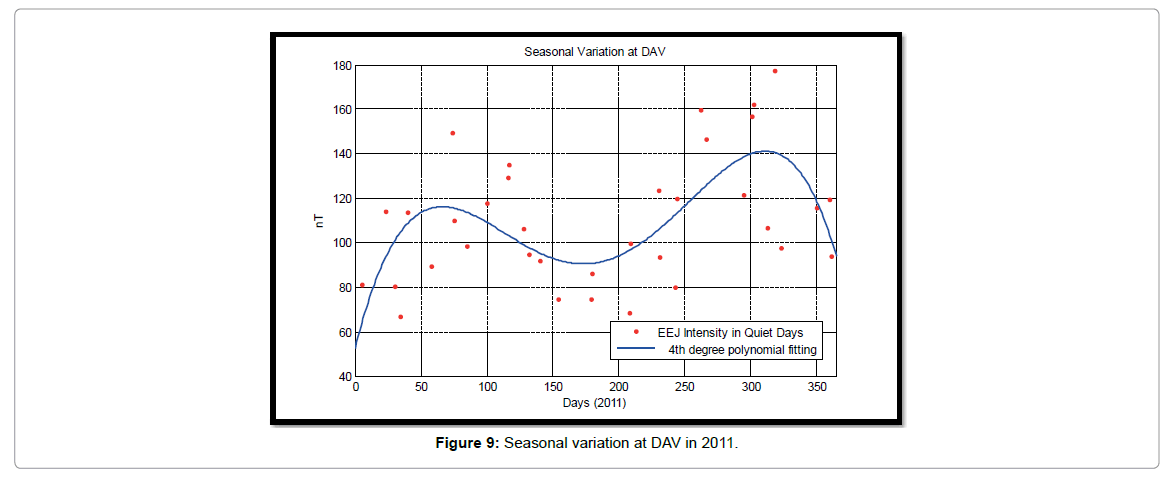
Figure 9: Seasonal variation at DAV in 2011.
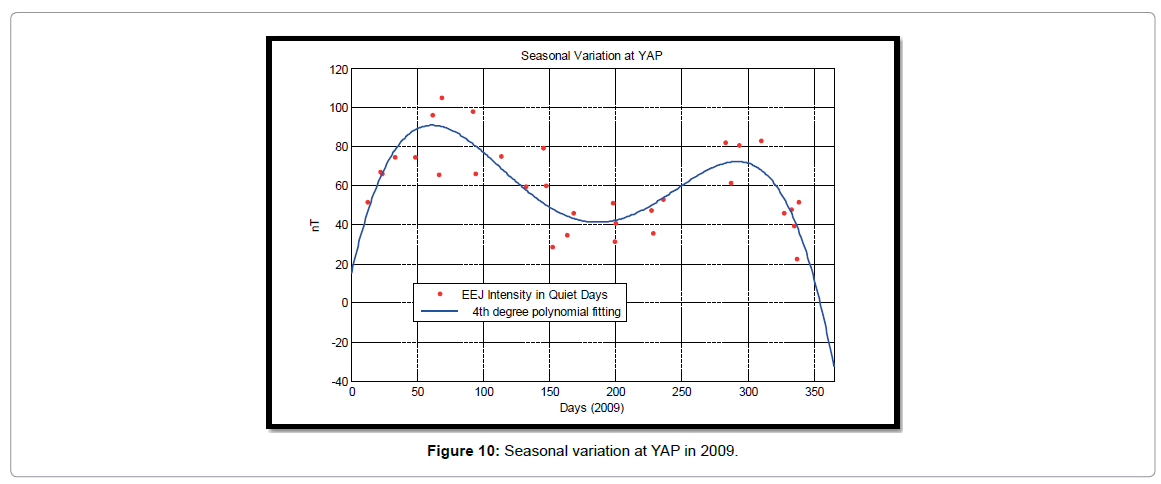
Figure 10: Seasonal variation at YAP in 2009.
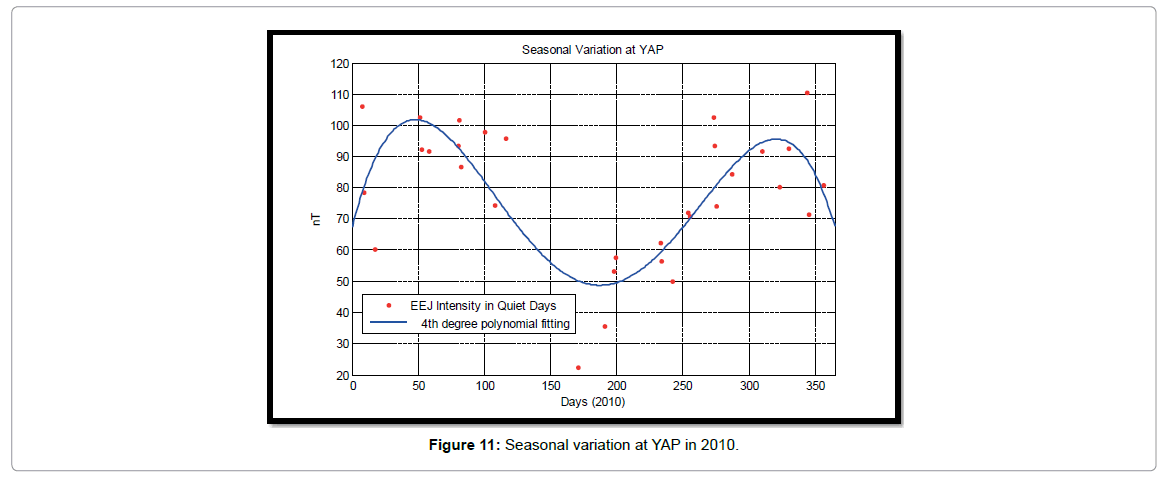
Figure 11: Seasonal variation at YAP in 2010.
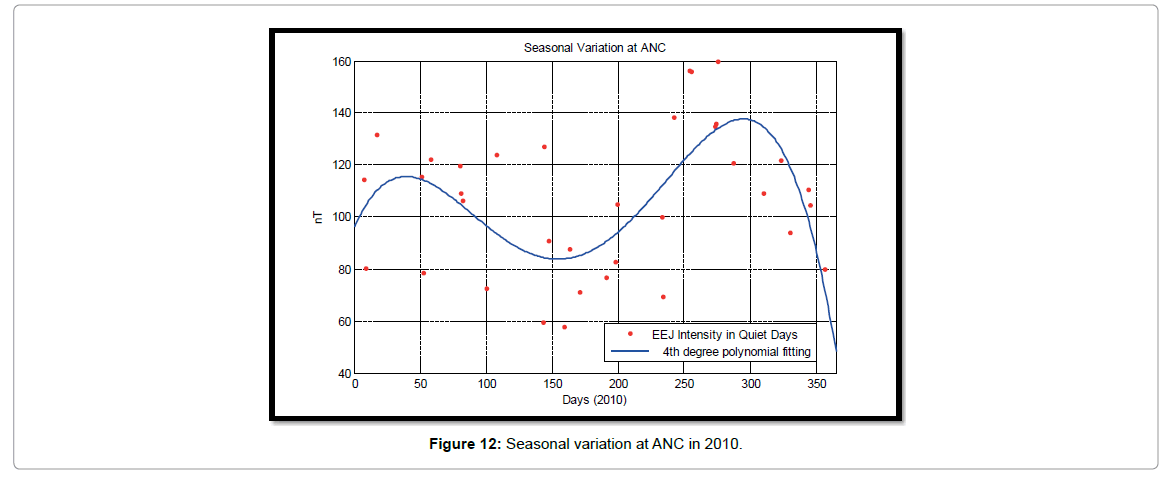
Figure 12: Seasonal variation at ANC in 2010.
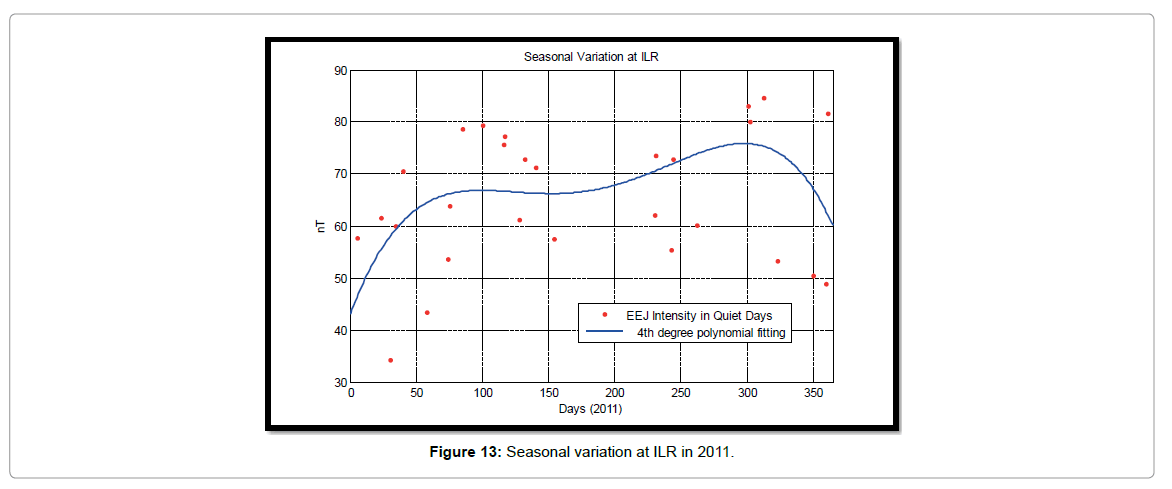
Figure 13: Seasonal variation at ILR in 2011.
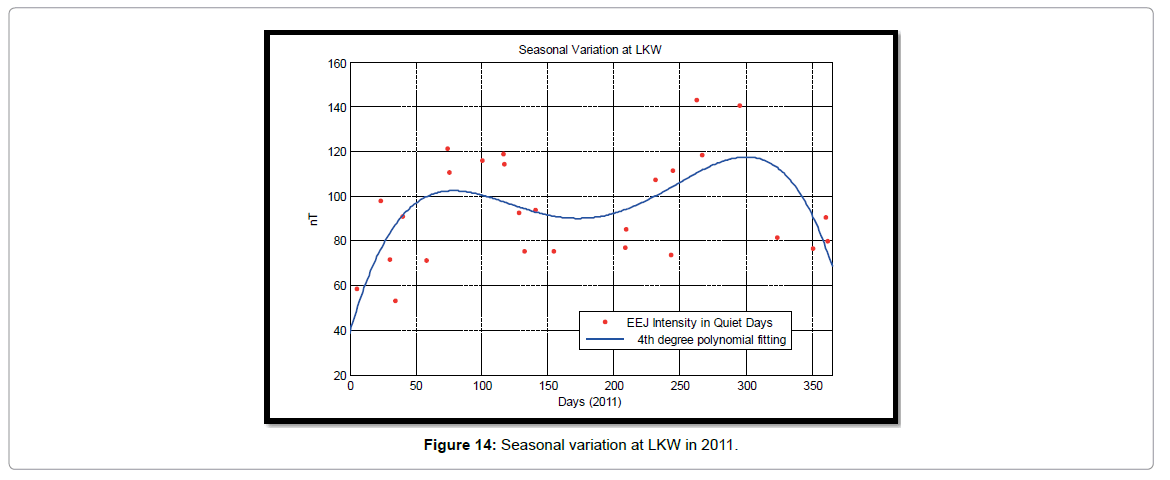
Figure 14: Seasonal variation at LKW in 2011.
In the present study geomagnetic data from a chain of stations along the dip equator have been analyzed to provide detailed study in this region on the equatorial electrojet. Data from eight stations (ANC, ILR, AAB, TIR, LKW, BCL, DAV and YAP) have been used. Most of the analyzed data are EUEL data for a period of three years (2009-2011).
The strength of EEJ has is found to vary both from day to day for a single station and from station to another. The maximum value of EEJ in the period of study at ANC is 177.8 nT and the minimum is 55.3 nT, ILR maximum 94.9 nT and minimum 21.8 nT, AAB maximum 131 nT and minimum 35 nT, TIR maximum 141.3 nT and minimum 28.6 nT, LKW maximum 143.3 nT and minimum 43.7 nT, BCL maximum 123.9 nT and minimum 23.7 nT, DAV maximum 177.3 nT and minimum 24.2 nT, and YAP maximum 145.2 nT and minimum 22.6 nT.
As expected there is a local time dependence of EEJ. EEJ-related magnetic effects in the daily variations of the horizontal component appear at about 6 LT, reach a maximum near local noon and vanish after 18 LT.
Simultaneous surface magnetic records from eight stations in different longitude sectors have been used to study the longitudinal dependence of EEJ. Three years have been analyzed separately. There is a very good agreement between the results of the three years, which makes the obtained results as one of the reliable results to discuss the longitudinal dependence of EEJ. The intensity of EEJ is found to be stronger in South America with a maximum at about 77°W. It is followed by a minimum in West Africa at about 4°E. The EEJ magnetic signature is relatively weak in Asia with a minimum in India, between 70° and 90°E. A secondary maximum is at about 125°E. These longitude variations of the EEJ magnetic effect roughly follow variations of the inverse main field (1/B) at the dip equator.
The seasonal variations of the equatorial electrojet have been studied by both the whole data set (disturbed and quiet days) and quiet days’ data. It has been proved that there is a semiannual variation in the equatorial electrojet with equinoctial maxima.