Journal of Geology & Geophysics
Open Access
ISSN: 2381-8719
ISSN: 2381-8719
Review Article - (2017) Volume 6, Issue 1
Identify the rock lithology has important meaning for estimating the reserve of petroleum as reservoir capacity and storage ability. The lithology identification from well log based on not conventional cross plot proposed and studied, which is more easier instead of rock core data observation results. However, this work carried out comparison between chart and analytical solution of matrix parameter (ρma and ΔTma) estimation values of producer shaly sand reservoir, and present the main depositional environment affects. In addition to influences of pyrite, ferruginous encrustations, organic material throughout this studied reservoir. Consequently, variety of matrix parameters values is contributed by clay minerals present in this reservoir type. This study based on wire line data measured over than 750 feet produced Upper Nubian Sandstone belong to two oil fields, SE Sirt Basin. This shaly reservoir divided into three main units (R, E and F), and each unit has been subdivided into three subunits (F3, F2, F1, E3, E2, E1, R3, R2 and R1) from bottom to top according to depositional and petrophysical properties.
Keywords: Wire line, Rock type, Minerals, Nubian sandstone, Sirte basin
Most sandstone reservoirs, worldwide, contain varying amounts of clay and/or shale. Therefore, shaly sands are heterogeneous producer reservoir. Petrophysical evaluation of these reservoirs type is needed to deal carefully with lithology investigation. However, the wire line logs using different formulas and cross-plots techniques. Most of these techniques have to be directed toward clay mineral identifications. However, this work on four wells was selected from different oil fields at eastern Sirt basin to present main inspect lithology, which is effect on reservoir qualification (porosity, permeability, etc.). The available data were wire line logs recording over than 750 feet reservoir thickness and each half feet analyzed. These logs are include; Neutron, Density, Sonic, Photoelectric factor (PEF), Natural gamma ray (NGS), and Induction resistivity.
Several techniques have been proposed for determining lithology from wire line log data, such as principal component and cluster analyses and discriminate analysis. Subsurface lithology is traditionally determined from core or cutting analysis. Cores are generally not identification from well log based on not conventional cross plot proposed and studied, which is more easy continuous and consequently do not provide a complete description of formations crossed by a well. Well logs give a practically continuous survey of the formations crossed by a well. They allow measurement of apparent thickness and of real thickness if dipmeter data are taken into account. Burke et al. and Clavier and Rust [1,2] have shown that well log responses can give a good idea of the lithology. With the increase of physical parameters recorded by modern logging tools e.g., parameters recorded by modern logging tools e.g., photoelectric cross section, natural or induced gamma ray photoelectric cross section, natural or induced gamma ray spectrometry (GRS), and dielectric constant it becomes more obvious that their combination can give a good lithologic description of the formations. This evidence was the basis for the concept of “electrofacies” (Serra and Abbott) defined as “the set of log responses which characterizes a bed and permits it to be distinguished from other beds” (Serra). Applied to open hole logs, this electrofacies is an equivalent of the lithofacies that, according to Moore, is the “total sum of the lithological characteristics (including both physical and biological characters) of a rock”. It is not always obvious, however, to translate this electrofacies in terms of geologically meaningful rocks. A procedure combining modern wireline measurements with a lithofacies data base created from logs (strictly speaking, an electrolithofacies data base) has proved to be effective in this translation [3]. Akinyokun et al. [4] detection of Lithology and Fluid Contents from geophysical data has always been an important practical issue in the interpretation of geophysical oil prospecting data by Unsupervised Self Organizing Map (SOM) of neural networks of well log data obtained from the Niger- Delta region of Nigeria.
Geological review of the studied reservoir
Stratigraphic sequence of the Sirt Basin had been divided into into Pre-rift, Syn-rift and Post-rift. The Pre-rift and Post-rift sediments were dominated by clastic, whereas the Syn-rift sediments were dominated by carbonate, as shown on Figure 1 [5]. NW-SE faulting system of horst and graben patterns started in Early Cretaceous and culminated during the Tertiary. This dominant trend truncated by E-W trending in the southeastern part of the Basin (Figure 2). Also, this localized complexity at the junction of the Ajdabiya and Hamiemat Troughs, interpreted and caused of a local stress anomaly is unknown, as no earthquakes have been recorded for this region and active faulting has not been reported [6]. The eastern part of the Sirt Basin can be distinguished into five main structures which have predominantly east-west orientation. These structures are; Hamiemat Trough (Mar Trough, Metem depression),Messlah- Kalanshiyu (Wasat) High, North Sarir Trough, South Sarir Ridge, and South Sarir Trough.
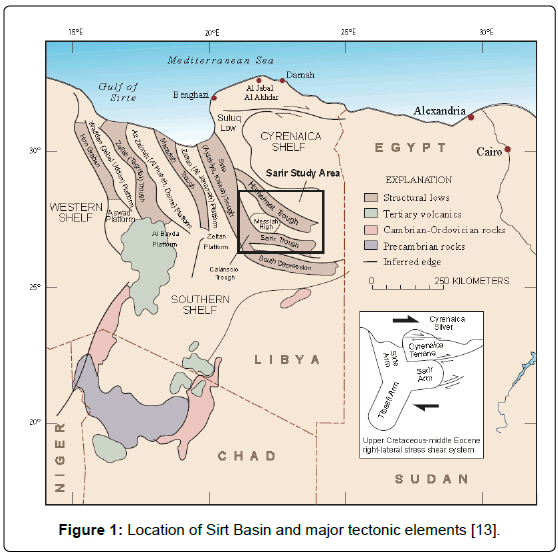
Figure 1: Location of Sirt Basin and major tectonic elements [13].
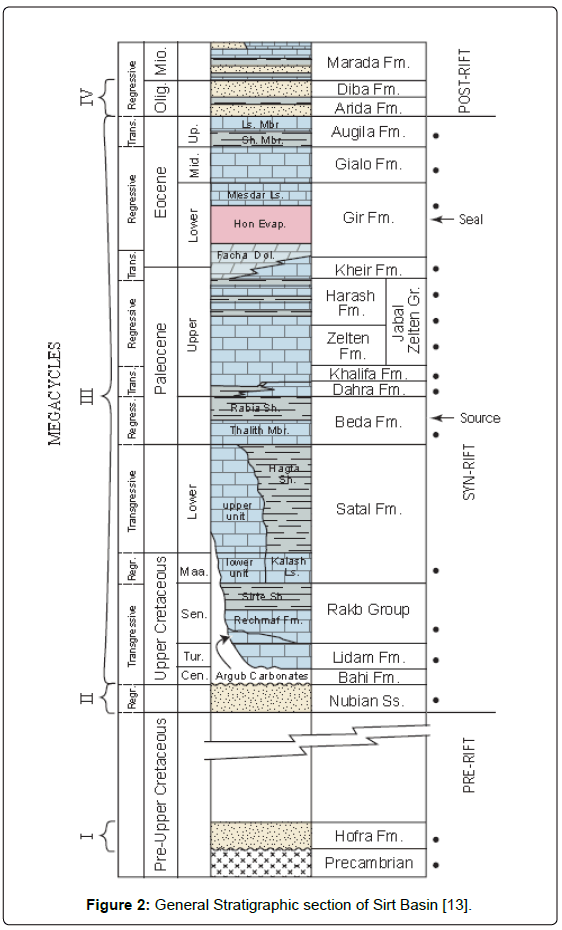
Figure 2: General Stratigraphic section of Sirt Basin [13].
The Nubian reservoir is deposited in deeper part of the Hameimat trough, deposited during late Jurassic to early Cretaceous age as basel part of the syn-rift sequence. It was preserved in grabens and is generally missing or very thin on the platforms and highs. The reservoir has a lateral and vertical type and character change of facies sequences. Ibrahim and El-Hawat [7,8] have recognized and divided the sequence into three units as Lower Sandstone member, Middle Shale member and Upper Sandstone member. Abdulghader [9] identified four lithofacies within this sequence. These lithofacies are: a meandering river facies with point bars, levees and over bank deposits, a relatively high-energy alluvial- plain association with low-sinuosity braided-streams, swamp facies and relatively deep-water lacustrine facies. This reservoir has been studied petrograhically by El-Bakush et al. [10] and in recently published paper [11] it was found that the Nubian Sandstone ranging from very to coarse grained, quartzitic and poorly sorted often with a clay matrix of fluvial and lacustrine sandstone. Therefore, variation of composition and shale content make the Nubian as a shaly sand reservoir.
Rock Types Determination
Lithology can be defined by rock samples taken from outcrops or core samples from drilled wells. Geophysical logging devices can be used instead when the rock samples are leaked or not found. Different techniques depend on these logs such as; M-N, MID, and GR- PEF plots. Therefore, the Shaly sand has a variation of clay content, so this rock type as not homogenous lithology. However, this studied reservoir rock divided into three main units (F, E and R) from bottom to top, and each unit include three subunit (F3, F2, F1, E3, E2, E1, R3, R2 and R1). Through the following sections explain each technique which applied to define lithology type for studied reservoir.
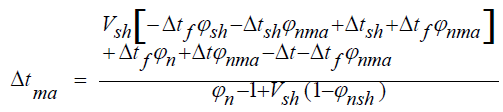
The neutron porosity (Øn), bulk density (ρb) and travel time (Δt) reading values from each related log were plotted manually depend on base mud type (fresh)of Schlumberger CP14-a and CP-12 charts to determine matrix density (ρma) and matrix travel time (Δtma). These manual plots were done before and after correction of the neutron porosity (Øn). Figures 3a and 3b present these plots of the well B. The average matrix density (ρma) and average matrix travel time (Δtma) from these plots are summarized in Table 1 of the studied well B for R reservoir subunits. The plotted points fall below the clean sandstone line toward the limestone and dolomite lines. This situation could be related to the presence of shale content which take the same pattern or may be related to the existence of fraction of the cemented material. Therefore, the values of ρma and Δtma are greater or less than those parameters of clean sandstone. These cross-plots demonstrate that the representative points generally fall below the sandstone line and virtually on the limestone line. These points may correspond to granite or granodiorite rocks of Serra [12]. Analytical solution of matrix parameters values of (ρma) and (Δtma) can be also calculated by knowing the volume of shale [13]. Formulas 1 and 2 are used for this procedure. Therefore, these reservoirs may be classified as weathered plutonic reservoirs (granite or base wash). Through Table 1 only presents results of three upper reservoir subunits of well B, because the results of whole reservoir units of different studied wells need more available space at this paper.
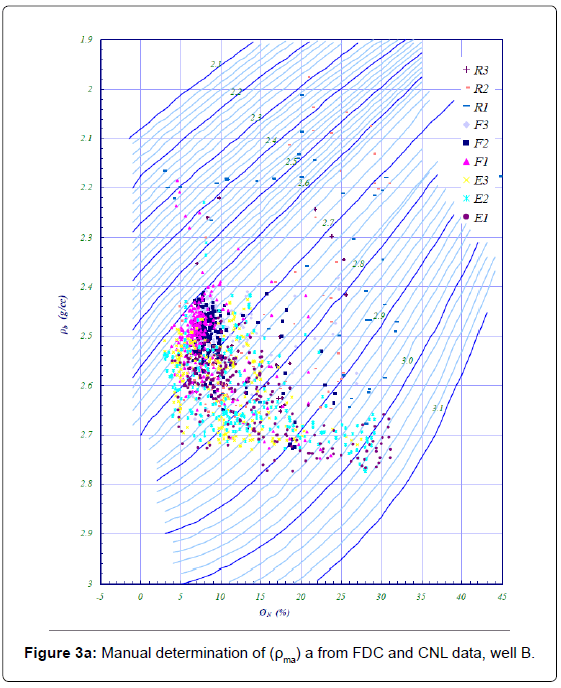
Figure 3a: Manual determination of (ρma) a from FDC and CNL data, well B.
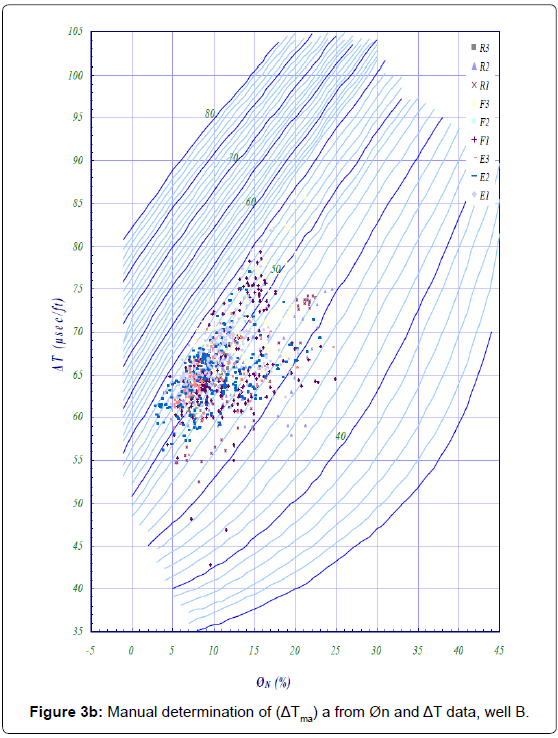
Figure 3b: Manual determination of (ΔTma) a from Øn and ΔT data, well B.
Figure 3b: Manual determination of (ΔTma) a from Øn and ΔT data, well B.
| Parameters | ||||||||
|---|---|---|---|---|---|---|---|---|
| Reservoir Unit | Chart | Analytical | ||||||
| BeforeØncor | AfterØncor. | BeforeØncor | AfterØncor. | |||||
| ρma | Δtma | ρma | Δtma | ρma | Δtma | ρma | Δtma | |
| R3 | 2.68 | 49.47 | 2.67 | 50.439 | 2.55 | 57.43 | 2.55 | 57.527 |
| R2 | 2.71 | 48.5 | 2.67 | 50.89 | 2.567 | 57.91 | 2.567 | 49.437 |
| R1 | 2.829 | 46.71 | 2.758 | 53.44 | 2.635 | 64.879 | 2.635 | 36.204 |
Table 1:Shows average ρma and Δtmavalues of reservoir subunits (R) in well (B).
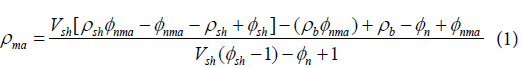 (1)
(1)
 (2)
(2)
This technique was introduced by Clavier et al. [2], which combine the measurements of the same three tools (Neutron, Density and Sonic). An apparent matrix density (ρma) a and an apparent matrix travel time (Δtma) a are estimated from previous cross-plots. These parameters were plotted against each other. Figure 4 demonstrate that the data points form a cluster shape toward the decrease of matrix travel time value (Δtma), which displays the existence of secondary porosity. Whereas less data points fall below the mentioned cluster toward the anhydrite point indicate a shaly influence. However, minor data points were scattered in the direction of northeast of the main cluster point-out gas effect. These investigated what was incompliance with Schlumberger [14] interpretation.
 (3)
(3)
 (4)
(4)

Figure 4: M-N cross-plot for mineral identification, well B.
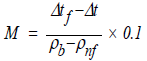
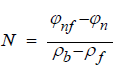
This technique is very similar to the previous one and introduced by Burke et al. [1] for the study of complex lithologies. The authors apply this technique to compute parameters M and N independently of porosity assuming that all three tools (Neutron, Density and Sonic) respond linearly to porosity. These parameters (M and N) calculated by equation as follow:
Figure 5 shows linear trend from anhydrite (below) to quartz (above) points in the northeast direction. The points close to the anhydrite express the shaly effect while the adjacent points to quartz demonstrate more clean sand [15,16]. It is reasonable to mention that the scattered points on the same trend refer to gas effect.

Figure 5: MID cross-plot for matrix identification, well B.
Gamma ray log data can be related to another log data in incompatible and compatible cross –plotting. Gamma ray –resistivity, gamma ray – Neutron porosity and photoelectron factor-gamma ray cross – plots are usually done to quantify lithology. This PEF-GR relation cross-plot illustrates the influences of pyrite, ferruginous encrustations, organic material and shale material (Figure 6). It is worth to notice from previous plotted figures that the points are concentrated between range 2-4 PEF values and gamma ray reading of 30 API should be considered and given more investigation due to its closeness to the dolomite point [17,18]. This phenomena, in this study, may reveal that the shaly sand include one or more impurities of dolomite, potassium feldspar, etc. in matrix and/or cement.

Figure 6: PEF-GR cross-plot for influence materials, well B.
Oil fields are producing from inhomogeneous (shaly sand) reservoir needs more petrophysic parameters to present accurate reserve estimation. However, the studied reservoir has a multizonation from bottom to top (E3, E2, E1, F3, F2, F1, R3, R2 and R1) due to variety of shale content and clay minerals distribution. Whereas, this reservoir hold a significant hydrocarbon potential in Southeast Sirt Basin. Formation matrix parameters (ρma and Δtma) values of this studied reservoir are different from the constant or standard values for clean Sandstone. These values depend on bulk density, Travel time and Neutron measurements. It is clearly that this difference has affected the porosity calculation. The values of these parameters were estimated both by manual method plotted on Schlumberger charts and by analytical solution using derivative formulas for each reservoir subunit. The manually estimation gives better results when neutron porosity was corrected. Cross-plots demonstrate that the representative points generally fall below the sandstone line and virtually on the limestone line. These points may correspond to granite or granodiorite rocks of Serra [12]. Therefore, these reservoirs may be classified as weathered plutonic reservoirs (granite or base wash). While the MID and M-N techniques illustrate hydrocarbon effects and secondary porosity type on Nubian reservoir lithology. While GR-PEF technique shows the plot points are concentrated between range 2-4 B/e Pef values and gamma ray reading of 30 API should be considered and given more investigation due to its closeness to the dolomite point, additional to influences of ferruginous, pyrite and clay material.