Journal of Geology & Geophysics
Open Access
ISSN: 2381-8719
ISSN: 2381-8719
Research Article - (2014) Volume 3, Issue 2
The study has been undertaken to map the land use/land cover resource at a micro-watershed level in the Sarada river basin covering an area of 2634 km2. Multi-temporal remote sensing data acquired by the Landsat-7 ETM+ satellite sensor of 30m spatial resolution and IRS-P6 LISS-III satellite sensor of 23.5m resolution, respectively has been used for the study. Change analysis of the land use/land cover pattern in the basin was carried out to identify the impact of anthropogenic activities in each of the 60 micro-watersheds of the basin. The study has appraised the fact that, land use/land cover changes are affected by factors, such as, population growth, agricultural demand (food, bio-energy, forest, etc.), urbanization and economic development in the Sarada river basin. Simultaneously, NDVI was used to broadly monitor the vegetative vigor and imperviousness of the micro-watersheds. The combination of land use/land cover and NDVI analysis helped in identifying and measuring the impact of human induced change which may alter the hydrological setting, behaviour and environment of the Sarada river basin.
Keywords: LULC change, Remote sensing and GIS, anthropogenic activities, micro-watershed, Sarada river basin, Visakhapatnam district
Human activities, such as deforestation, agricultural and urban development may have direct influence on the land use/land cover and climate change may have a profound impact on national, regional and global human supporting capacities. Tullos [1] and Sabahattin et al. [2] in their studies have noticed that, anthropogenic activities, such as, dam construction, levee and bridge constructions, sand-gravel mining, water withdrawals and industrialization have tremendous impact on the hydrological character of the river basin. Land use further emphasizes the virtues of ‘macro’ and ‘meso’ rather than ‘micro’ scale analysis. In order to properly understand ‘why’ land use/land cover changes and ‘how’ they occur, it may be necessary to have information on cause and effect relationships of the factors having an influence on it.
Land is the most important natural resource, which embodies soil, water and associated flora and fauna involving the total ecosystem. Comprehensive information on the spatial distribution of land use/ land cover categories and the pattern of their change is a prerequisite for management and utilization of the land resources of the study area. The land use pattern of any terrain is a reflection of the complex physical processes acting upon the surface of the earth. These processes include the impact of climate, geologic and topographic conditions on the distribution of soils, vegetation and occurrence of water. For better development and management of the river catchment areas, it is necessary to have timely and reliable information on environmental status.
In the present day scenario of rapid urbanization, any measure of planning requires information on existing land use practices, which needs to be given due consideration in formulating an appropriate strategy for sustainable development. Therefore, land use naturally becomes one of the most important parameters for any planning, as it provides vital information about the spatial patterns and change in the land and water resource utilization. Sengupta and Venkatachalam [3] stated that the changes in land-use/land-cover pattern over a time period control the pressure on land. Shiferaw [4] has described that, local-level dynamics is very important in determining the status of land and ecosystem health. In addition to impacts on biodiversity, a variety of negative abiotic and biotic ‘edge effects’ are known to follow by anthropogenic land use practices [5-10]. Hence, it is significant to note that, land use/land cover practices have a profound impact on hydrological setup and sediment yield in the river basin since they are inversely related to the spatial scale [11]. The human induced development is so complex and dynamic that it calls for an immediate perspective planning of populated areas, importantly urban zones. Proper planning and monitoring is essential for a sustainable use of the land.
One of the biggest advantages of remote sensing is its excellent temporal resolution, as the imagery records the finest information of terrain and land cover conditions pertaining to a specific time, which is not possible by any other means. This information on land cover can also be converted to land use information, by the proper methodology of interpretation, association, collateral data, reference level and selectivity with support from ground visits.
Various studies conducted by different authors suggests that the remote sensing technology in combination with GIS is an ideal tool to identify, locate and map various types of lands associated with different landform units [12-14]. The timely information about the land use/ land cover change pattern plays a significant role in land use planning and sustainable land and water resource development. The present study aims at analyzing the condition of the watershed with the help of land use/land cover and NDVI information extracted from the multitemporal remote sensing data in a GIS environment. The land use/ land cover change analysis was used to identify and map the impact of human induced land cover practices, such as deforestation, agricultural activity, urbanization, etc. The NDVI was used as a measure to broadly appraise the condition of vegetative vigor which indirectly corroborates the imperviousness and intensity of overall land use/land cover changes which may have an impact in altering the natural hydrological setup and environment of the Sarada river basin.
Study Area
The Sarada River basin extended between the 17°25’1.49” N to 18°16’39.19” N latitude and 82°31’50.96” E to 83°7’13.69” E longitudes covering an area of around 2634.22 Km2 (Figure 1). The River Sarada originates from the Ananthagiri hill ranges at a height of 1500 m, flows towards south and finally joins the Bay of Bengal. From its origin in the north to its confluence point at Bay of Bengal in the south, Sarada runs for a distance of about 131.37 km. While many notable tributaries join its left bank, very few or no main tributaries join its right bank. Some of the most important tributaries pouring into the left bank of Sarada river are Bodderu Nadi, Edla Gedda, Isaka Gedda, Mala Gedda, Mamidivaka Gedda, Medra Gedda, Ninni Gedda, Pala Gedda, Pedda Eru, Pedda Gadda, Ralla Gedda, Seshu Gedda, Tacheru Vagu, Toyi Gadda, Uraka Gedda, and Vedurla Gedda.
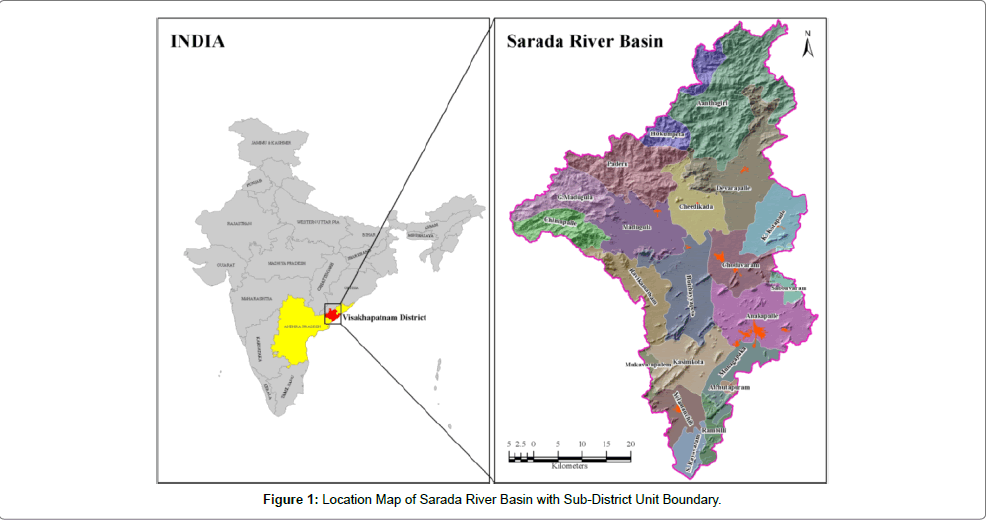
Figure 1: Location Map of Sarada River Basin with Sub-District Unit Boundary.
The basin is surrounded by River Nagavali on the north, River Gosthani, Gambhiram Gedda, Meghadrigedda in the eastern Bay of Bengal in the South and Machhkund sub-basin of the River Godavari in the west.
The study area base map is prepared by the Survey of India (SOI) topographic maps on 1: 50000 scale numbered 65J/08, 65J/12, 65J/16, 65N/04, 65K/05, 65K/06, 65K/07, 65K/09, 65K/10, 65K/11, 65K/13, 65K/14, 65K/15, 65O/01, 650/02, and 650/0. Land use/land cover maps have been prepared by using IRS-P6 (ResourceSAT-1) LISS-III of 23rd January, 2012 and LANDSAT-7 ETM+ satellite imagery of 08th December, 2002 were verified through necessary field checks.
Topographic maps pertaining to the study area were geo referenced and projected using WGS84 UTM Zone 44 North projection and spatial reference coordinate systems using Erdas Imagine software. Subsequently a mosaic was generated from the rectified toposheets. Basin boundary was delineated in the form of vector data which will be used as an input in GIS environment. A total number of 60 microwatersheds were delineated in the basin area and assigned proper codes following the micro-watershed codification system proposed by the Watershed Atlas of India [15]. The remote sensing image data was then rectified with reference to georeferenced topographic maps. A total of 25 ground control points (GCP’s) were collected by Global Positioning system (GPS) to assist with topographic maps to register the data sets with RMS error of less than 0.85. Various image enhancement techniques were applied to make the imagery more interpretable. Basin imagery subsets were created by intersecting the georeferenced input imagery with basin boundary AOI delineated from SOI toposheet mosaic. ArcGIS software was employed to delineate the vector data and to perform subsequent change analysis. Various land use/land cover classes were delineated from both the images by means of visual interpretation methods to finally produce/generate the land use/ land cover datasets and maps for the two reference years. In order to properly ascertain the areas and magnitude of the land use/land cover change occurred between 2002 and 2012, a land use/land cover change map (Figure 2) was generated by combining both the land use/land cover maps of the corresponding years. A bar graph showing the area statistics (Figure 3) was prepared to highlight the changes occurred to each of the land use/land cover class. Subsequently, a confusion matrix (Table 1) was generated to exactly identify and measure the actual changes occurred to each land use/land cover class during 2002 and 2012.
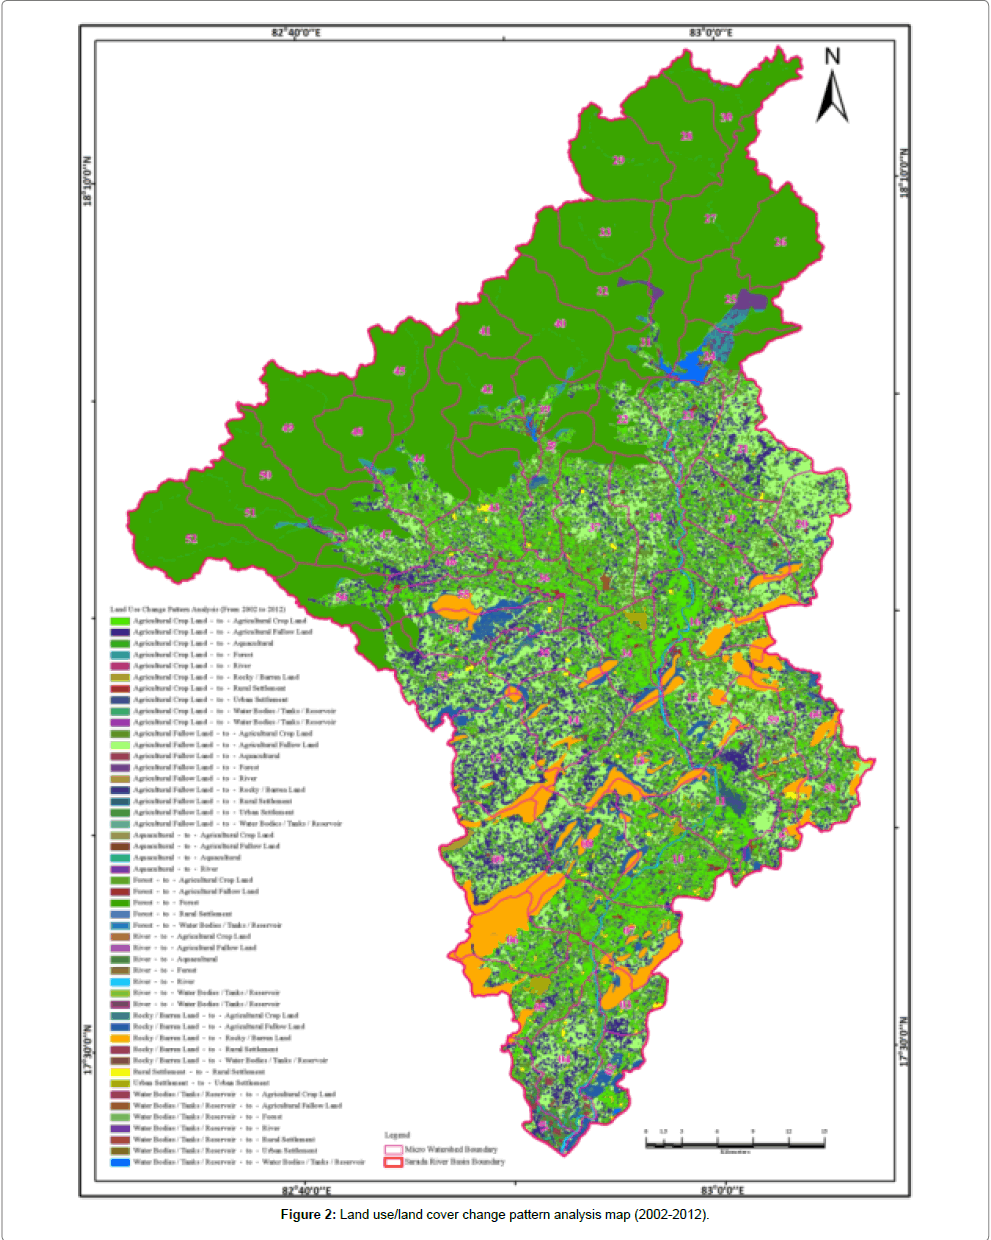
Figure 2: Land use/land cover change pattern analysis map (2002-2012).
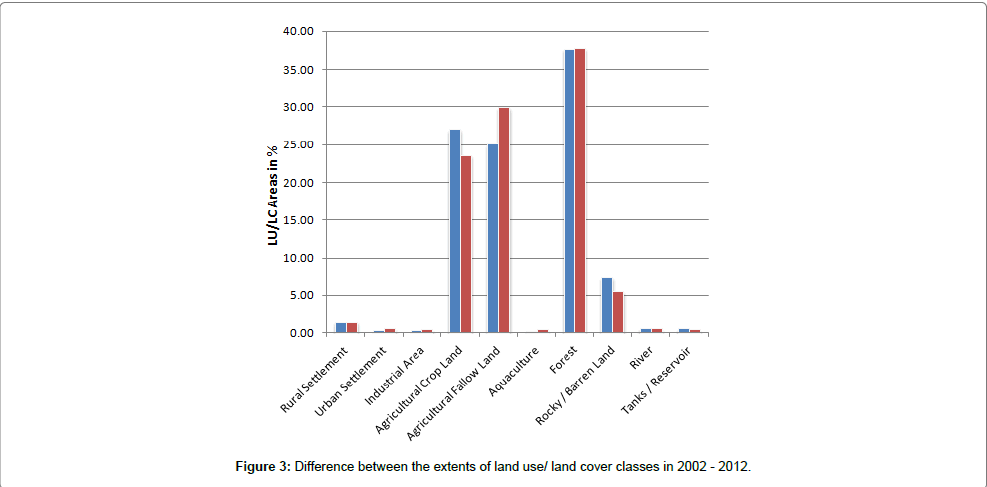
Figure 3: Difference between the extents of land use/ land cover classes in 2002 - 2012.
| 2012 | ||||||||||||
| 2002 | Rural Settlement | Urban Settlement | Industrial Area | Agricultural land | Agricultural Fallow | Aquaculture | Forest | Rocky/Barren Land | River | Tanks/Reservoir | LU/LC class in 2002 (Km2) | |
| Rural Settlement | 37.86 | - | - | - | - | - | - | - | - | - | 37.86 | |
| Urban Settlement | - | 5.93 | - | - | - | - | - | - | - | - | 5.93 | |
| Industrial Area | - | - | 8.25 | - | - | - | - | - | - | - | 8.25 | |
| Agricultural Land | 0.01 | 1.84 | 0.29 | 365.36 | 319.96 | 3.96 | 1.98 | 16.69 | 0.14 | 0.97 | 711.20 | |
| Agricultural Fallow | 0.25 | 2.56 | 0.15 | 240.86 | 402.30 | 2.06 | 0.72 | 7.78 | 0.09 | 1.72 | 658.49 | |
| Aquaculture | - | 0.01 | - | 0.03 | 0.11 | 0.92 | - | - | 0.03 | 0.01 | 1.11 | |
| Forest | 0.49 | 0.05 | - | 0.44 | 0.08 | 1.1 | 988.90 | 0.1 | 0.12 | 0.01 | 991.29 | |
| Rocky / Barren Land | 0.28 | 1.8 | 0.07 | 11.73 | 57.48 | 0.9 | - | 117.14 | 2.7 | 1.48 | 193.58 | |
| River | - | 0.02 | 0.1 | 0.07 | 0.39 | 0.08 | 0.35 | 1.1 | 9.51 | 1.86 | 13.48 | |
| Tanks / Reservoir | - | 0.02 | 0.01 | 1.41 | 6.14 | 0.01 | 0.92 | 0.9 | 0.55 | 3.07 | 13.03 | |
| LU/LC class area in 2002 (Km2) | 38.89 | 12.23 | 8.87 | 619.90 | 786.46 | 9.03 | 992.87 | 143.71 | 13.14 | 9.12 | 2634.22 | |
Table 1: Land use change matrix (confusion matrix) for Year 2002 and 2012.
Land use/land cover change pattern analysis was done with the help of confusion matrix generated to record the temporal changes in land use/land cover during the 10 year period of time. NDVI analysis was carried out using IRS-P6 (ResourceSAT-1) LISS-III Satellite Imagery and Spatial Analyst tool in ArcGIS v.10 software through the basic equation of NDVI. Quality control was done to ensure the quality of the output generated. The flow chart (Figure 4) mentioned below shows the methodology adopted for the land use and land cover change pattern analysis.
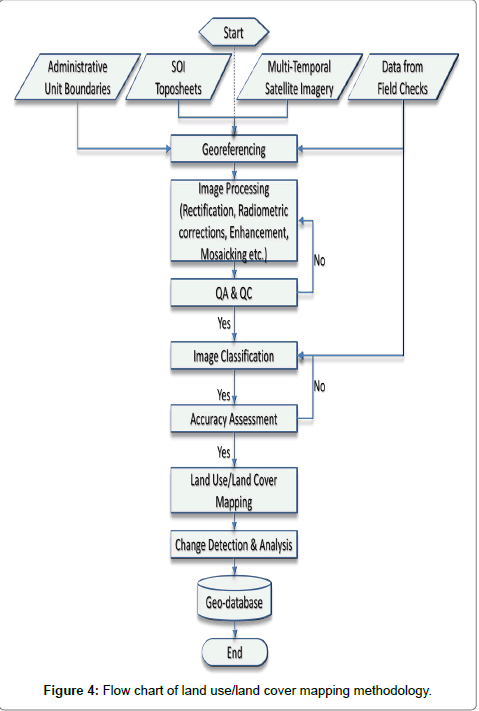
Figure 4: Flow chart of land use/land cover mapping methodology.
Land use/land cover mapping
The study has adopted the four levels (IV) land use/land cover classification scheme suggested by National Remote Sensing Agency, Hyderabad NRSA [16], which is flexible in using various types of remote sensing data products and can be applied very well in land use mapping under Indian conditions. This system is based on physiography (based on landform) and physiography sub units (based on slope, erosion etc.). Therefore, this system is most useful in land management of river watersheds. Keeping in view of the aforementioned objectives, the land use/land cover maps have been prepared for both the years 2002 (Figure 5) and 2012 (Figure 6) using the remote sensing data.
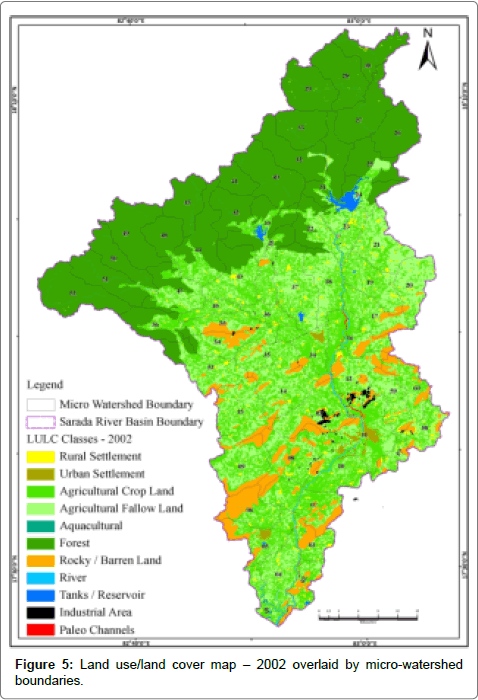
Figure 5: Land use/land cover map – 2002 overlaid by micro-watershed boundaries.
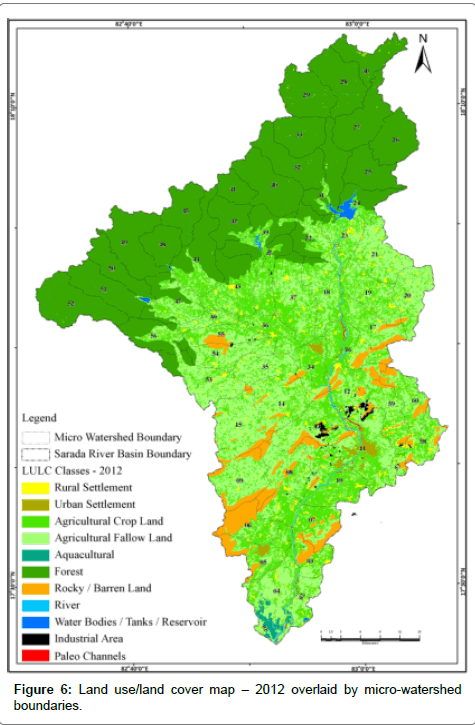
Figure 6: Land use/land cover map – 2012 overlaid by micro-watershed boundaries.
Land use/land cover change detection
Change detection analysis was performed to see the land use/ land cover changes occurred during 2002 – 2012. This was done by intersecting both the land use/land cover themes and mapping the changes based on 2002 land use/land cover theme (Figure 2) using the query process. The resultant image has a total of 49 classes, for instance, agricultural land to forest land, agricultural land to settlements, agricultural land to aquaculture, barren / rocky to Industry, so on and so forth.
NDVI mapping
Land use/land cover modifications, especially, changes in vegetative cover could have an influence on the albedo and is related to microclimate change in terms of rainfall and temperature variations Sarma et al. [17]. In order to assess the vegetation health of each micro-watershed of the basin Normalized Difference Vegetation Index (NDVI) analysis is carried out for the study. NDVI techniques have been chosen, because out of the numerous vegetation indices in use such as, NDVI, TNDVI, VI etc., NDVI happens to be the most widely used technique to understand the vegetation health status. This technique not only highlights the vegetated areas of an image, but also gives an idea regarding as to how healthy the plants are. The basic equation behind this operation can be expressed as:
NDVI = (NIR – R) / (NIR + R)...... Equation I
Where, NIR stands for Near Infra-Red band value and R stands for Red band value, recorded by the satellite sensor.
An important fact about the obtained values is that for a given NDVI image the resulting NDVI pixel value always ranges from -1 to +1. It is also important to note that the areas devoid of any vegetation give a negative value or a value close to zero. In simpler words a –ve number or a number close to zero means no vegetation and a number close to +1 (0.8 - 0.7) represents well-appointed vegetation. NDVI can serve as an indicator for many physiological and ecological parameters and can help draw conclusions on the surface, vegetation, albedo and photosynthetic activity [18].
Land use/land cover-2002
Study of land use/land cover pertaining to the year 2002 suggests that, the study area, mostly comprises of agricultural land of 52% and forest land of 37.63% (Figure 5). The agricultural land, includes, both crop land (27%) and agricultural fallow (25%). The observations are (Figure 7) mapped and tabulated (Table 2) for further analysis. The built-up land in the form of settlements (rural as well as urban) accounts for a 37.86 Km2 which is only 1.66% of the total area, while water features accounts for 1.01%. Other land use/land cover categories noticed in the area are rocky / barren land with 7.35%, industrial area with 0.31% and aquaculture with 0.04%.
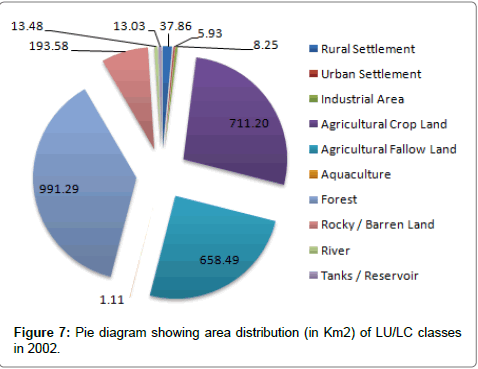
Figure 7: Pie diagram showing area distribution (in Km2) of LU/LC classes in 2002.
| S. No. | Land use/land cover Class | Area - 2002 | Area - 2012 | Area Change | |||
| Km2 | % | Km2 | % | Km2 | % | ||
| 1 | Rural Settlement | 37.86 | 1.44 | 38.89 | 1.48 | -1.03 | -0.04 |
| 2 | Urban Settlement | 5.93 | 0.23 | 12.23 | 0.46 | -6.30 | -0.24 |
| 3 | Industrial Area | 8.25 | 0.31 | 8.87 | 0.34 | -0.62 | -0.02 |
| 4 | Agricultural Land | 711.20 | 27.00 | 619.90 | 23.53 | 91.30 | 3.47 |
| 5 | Agricultural Fallow | 658.49 | 25.00 | 786.46 | 29.86 | -127.97 | -4.86 |
| 6 | Aquaculture | 1.11 | 0.04 | 9.03 | 0.34 | -7.92 | -0.30 |
| 7 | Forest | 991.29 | 37.63 | 992.87 | 37.69 | -1.58 | -0.06 |
| 8 | Rocky / Barren Land | 193.58 | 7.35 | 143.71 | 5.46 | 49.87 | 1.89 |
| 9 | River | 13.48 | 0.51 | 13.14 | 0.50 | 0.34 | 0.01 |
| 10 | Tanks / Reservoir | 13.03 | 0.49 | 9.12 | 0.35 | 3.91 | 0.15 |
| Total Area in Km2 | 2634.22 | 100.00 | 2634.22 | 100.00 | |||
Table 2: Land Use/Land Cover Change Pattern.
Land use/land cover-2012
The various land use/land cover categories (Figure 6) belong to 2012 have been computed and the areas and their percentages are presented in the Table 2. The land use/land cover (Figure 8) pertaining to the year 2012 mostly (53.39%) comprise of agricultural land with an area extent of 1406.36 Km2, which includes both the crop land (619.9 Km2) and agricultural fallow 786.46 Km2). Forest land, which occupies an area of 992.87 (37.69) is almost the same as that of 2002. The built-up land in the form of rural and urban settlements accounts for 51.12 km2 which is only 1.94% of the total area, while the water features accounts for 0.85%. Other land use/land cover categories identified in the basin are, rocky/ barren land with 5.46%, industrial area with 0.34% and aquaculture with 0.34%, respectively. The comparison results obtained from the integrated analysis of land use/land cover scenario pertaining to 2002 and 2012 are summarized below.
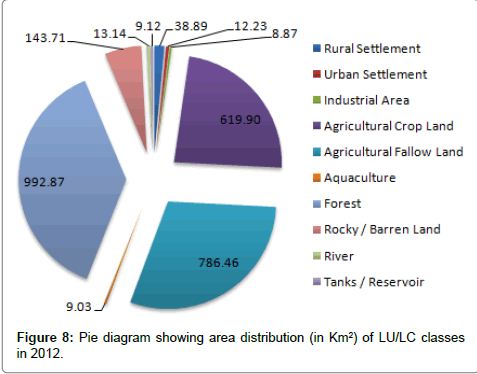
Figure 8: Pie diagram showing area distribution (in Km2) of LU/LC classes in 2012.
Land use/land cover change pattern: year 2002 and 2012
Due to various developmental activities which took place during the period of 2002-2012, the dynamic change is obvious and prominent in the Sarada river basin, especially in case of agricultural land (Table 2). Interestingly agricultural land was decreased by 91.30 Km2 from 711.20 Km2 in 2002 to 619.90 Km2 which accounts for nearly 3.47% of the overall area. On the other hand, the total area covered by the agricultural fallow has shown a steep increase in its area by 127.97 Km2 from a total area of 658.49 Km2 in 2002 to 786.46 Km2 in 2012, which accounts for almost 4.86% increase. Similarly, forest area, which was 991.21 Km2 in 2002 increased to 992.87 Km2, showing a growth of 0.06%.
Rural settlement, urban settlement and industrial area classes which accounted for 37.86, 5.93 and 8.25 Km2 in 2002, are increased to 38.89, 12.23 and 8.87 Km2, with a growth of 0.04%, 0.24% and 0.02 respectively. It was noticed that water features like, river and tanks/ reservoirs, which were occupying 13.48 and 13.03 Km2 of area in 2002 have decreased to 13.14 and 9.12 Km2 in 2012, marginally shrinking by 0.01% and 0.15%, respectively. Aquaculture, which was confined to only 1.11 Km2 in 2002, has increased to 9.03 Km2 in 2012 with a growth rate of 0.30%.
A change matrix popularly known as a confusion matrix has been generated to exactly assess, how various land use/land cover classes in 2002 have been converted to various land use/land cover categories in 2012. The change matrix also helps in accurately tracking the changes occurred, in terms of, what the class of 2002 have been converted to what class in 2012.
A Chi-square test (x2=Σ [Observed Frequency - Expected Frequency]2 / Expected Frequency) was conducted on the data generated through the confusion matrix to determine the difference of the association or relation between two different land use/land cover categories. The area of each land use/land cover category expected in each cell of the Table 1 if the null hypothesis is true, is calculated.
NDVI trend
According to the results obtained from the NDVI analysis, the values found in the range between +0.514 to -0.815 in the Sarada river basin. Though the basin is experiencing a change in its land use/land cover pattern, it is observed that, the majority of the micro-watersheds are manifested with healthy vegetation due to the extensive presence of forest and agricultural crops in the basin. Out of 60 micro-watersheds in the area around 26 watersheds, (nearly half of the total microwatersheds) mostly confined to the northern parts (hilly terrain) of the basin have shown a +ve trend in NDVI values confirming no land use practices as the area is covered by a thick forest. The remaining micro-watersheds in the plain areas have shown the NDVI values between +0.1 to -0.8 due to the reason that the areas are covered with various land use/land cover practices, especially, agricultural practices mixed with settlements, industries, rocky/barren areas indicating the imperviousness. The following map (Figure 9) shows the NDVI values of the micro-watersheds in the Sarada river basin.
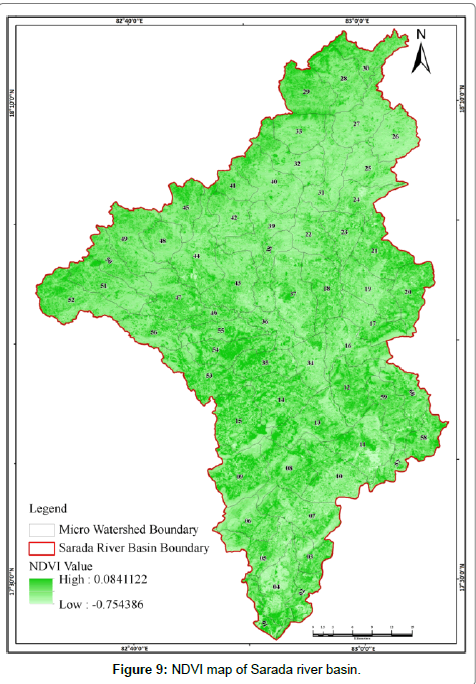
Figure 9: NDVI map of Sarada river basin.
The study emphasizes to establish a close relationship between land use/land cover (LU/LC) changes and normalized difference vegetation index (NDVI) using the data obtained from moderate resolution remote sensing data pertaining to Landsat and IRS LISS-III. The geographic understanding of land use/land cover change near the settlements as well as industrial areas in the basin is a key aspect of this study. The change analysis presents the summary of changes in the land use/land cover pattern during the period between year 2002 and year 2012. The analysis has shown considerable change in land use/land cover practices in 2012 as compared to 2002.
The analysis of confusion matrix suggests that the agricultural fallow has undergone a major change compared to any other land use/ land cover categories in the basin with an overall change in the area (from 658.49 Km2 in 2002 to 786.46 Km2 in 2012) of about 127.97 Km2 which is almost 4.86% of the total area. Out of total 658.49 Km2 of the area in 2002, in fact, 402.3 Km2 of the area only remained as agricultural fallow while the remaining area of about 384.16 Km2 has been included from other classes, such as, 319.96 Km2 of area from agricultural crop land, 57.48 Km2 from rocky/barren land, so on and so forth. Similarly, the other major land use/land cover class of the basin, agricultural crop land, has also undergone a major change. Out of a total 711.2 Km2 of agricultural crop land area in 2002, only 365.36 Km2 of the area remained as it is, while the remaining 254.54 Km2 of the area have been added to this class from different land use/land cover classes, such as, 240.86 Km2 from agricultural fallow, 11.73 Km2 from rocky/barren land, 1.41 Km2 from tanks/reservoirs, so on and so forth. The decrease in the total area under agricultural fallow, especially in plain areas, could be due to other developmental activities in the basin, such as, urban settlements, industry etc. On the other hand, the rocky/ barren land has been reduced by 1.89%, which is a significant change in terms of land use practices in the study area. It is noticed that, due to increase in population rural settlements have undergone a marginal increase in their area from 37.86 Km2 in 2002 to 38.89 Km2 in 2012 with 0.04% overall change. At the same time, there is a steep increase in the urban settlements area and is almost doubled (6.30 Km2 or 0.24%) in a decade from 5.93 Km2 in 2002 to 12.23 Km2 in 2012 which is 0.24% of overall change. The increase in the urban settlements area was mainly due to the inclusion of other classes to it, importantly, 2.56 Km2 from agricultural fallow and 1.84 Km2 from agricultural land. There is another land use/land cover class whose area has been increased drastically is, aquaculture. In fact, out of 1.11 Km2 of aquaculture area in 2002, only 0.92 Km2 of area is remained as it is, while 3.96 Km2, 2.06 Km2. 1.11 Km2 of area from agricultural crop land, agricultural fallow and forest land, respectively have been contributed for its overall growth. The area under tanks/reservoirs has been reduced by 3.91 Km2 (0.15%). The decrease in tanks/reservoirs was mainly because of the reason that its land has been converted to other land use/land cover areas, mainly to agricultural land (crop land and fallow land).
The Chi-square result shows a value of 12019 with a degree of freedom (df) 81 and p-value 0. The high Chi-values and low p-values (probabilities to determine the likelihood of observed deviations) 0 (less than 0.5) indicates that a low probability that the observed deviations are due to random chance alone and the association found in the data is significant and would be regarded as evidence that there is an association between the land use/land cover categories. The df values indicates that the land use/land cover categories in the basin are not independent.
On the other hand, NDVI showed positive values for majority of the micro-watershed areas, especially the areas in the northern hilly regions which are almost covered with protected forest land. However, majority of the micro-watersheds in the plain areas have shown low to moderate values of NDVI correlating with the land use and land cover results which have shown significant increase in agricultural fallow with less or no vegetation. This suggests that the basin is experiencing considerable change which is evident from the decrease of vegetative cover due to increase in the intensity of land use practices, such as, urbanisation and deforestation. Areas surrounding rural and urban settlements have shown a negative NDVI trend, which indicates degradation hotspots, which could be due to reclamation of agricultural areas for residential purposes. The temporal analysis of the spatial patterns, rates of change and trends have provided insightful information on the development activities under varying social, economic and environmental conditions, which have been transforming each of the micro-watersheds of the Sarada river basin. It is to be noticed that, most of human activity, like, urbanisation, agricultural practices area directly involves various development activities, such as, road construction, diversion of the water for irrigation, withdrawal of ground water, alterations of the terrain, etc. may have a significant impact on the hydrological behaviour of the basin as these practices are widely seen everywhere in the basin area during the field checks.
The study revealed that the land use/land cover in the microwatersheds of the Sarada river basin is currently experiencing a transformation due to intensive anthropogenic activities for various development activities, like, development of settlements, agricultural activity, industry etc. It is noticed that forest land followed by agriculture, agriculture fallow and barren/rocky land classes are the major land use/land cover categories in the Sarada river basin. The change analysis has revealed that the various land use/land cover classes, such as, rural settlements, urban settlements, industrial area, agricultural fallow, aquaculture, and to a small extent forest land have increased in their area, while agricultural crop land, rocky/barren land, river and tanks/reservoir have decreased in their area during 2002 to 2012. The Chi-square test conducted on the data generated through confusion-matrix indicates that the land use/land cover classes in the basin are having high degree of association, which means, any change occurred to a particular category have a significant influence on the other. NDVI analysis of the micro-watersheds suggests that the NDVI values in the basin are ranging from +0.514 to -0.815, mostly suggesting the manifestation of healthy vegetation due to the extensive presence of forest and agriculture land. Around 45% of the micro-watersheds in the basin have shown high values of NDVI as they are located in the northern parts of the basin mostly covered by hills and with no anthropogenic activities. The remaining 55% of the micro-watersheds have shown the NDVI values range between 0.1 to -0.8 which indicates the imperviousness of the terrain due to intense land use and land cover practices. Use of remote sensing data couple with GIS analysis has provided a quantitative information on the imperviousness of surfaces which is otherwise difficult to monitor using any other ground based studies. Information at micro-watershed level land use/land cover dynamics helped in determining the status of land and ecosystem health in terms of the magnitude of land use/land cover practices and imperviousness of the surface of the river basin. It is important to note that, the combination of land use/land cover and climate change may have profound impact on human supporting capacities of the river basin which is yet to be studied and established separately.
The authors are highly thankful to the reviewers of Journal of Geology and Geosciences for the thorough review of the paper. The comments and suggestions made by the reviewers subsequently helped the authors to do necessary corrections for further enhancement of the paper.