Journal of Geology & Geophysics
Open Access
ISSN: 2381-8719
ISSN: 2381-8719
Research Article - (2015) Volume 4, Issue 5
Land surface parameters are highly integrated and have a direct effect on water and energy balance and weather predictions. Due to the difficulties in correcting the influences of the atmosphere absorbability and the earth surface emissivity diversification, the retrieval of land surface temperature (LST) from satellite data is a challenging task. To retrieve microwave land emissivity, infrared surface skin temperatures have been used as surface physical temperature. However, passive microwave emissions originate from deeper layers with respect to the skin temperature. So, this inconsistency in sensitivity depths between skin temperatures and microwave temperatures may introduce a discrepancy in the determined emissivity. In this research, six sample sites were chosen on the earth for 2013 and 2014 and then land surface temperature from AMSR-2, Landsat and ASTER brightness temperature values have been derived. The algorithm has been developed from a surface brightness temperature dataset, which has used as inputs surface parameters and atmospheric quantities. The retrieved LST has been compared within AMSR-2, Landsat and ASTER for the same period and area. Maximum time ASTER has shown higher temperature than other data and AMSR-2 has lower temperature on same area. Landsat and ASTER is closer to ground measured temperature than AMSR-2 data. It will be interesting to see how the satellite-derived surface temperature will behave in an assimilation scheme in a follow-up study.
Keywords: AMSR-2; ASTER; Landsat data; Brightness temperature
Surface temperature is a key parameter in many energy balance applications, such as evaporation models, climate models and radiactive transfer models. Land/use cover (in terms of temperature and soil moisture) affect the surrounding climate, such as the water vapours, the dust partials, the gas molecules and the clouds formation; so it directly affects rain and then land/use cover [1]. By this way, it affects the whole ecosystem and correlates with natural disasters. Land Surface Models (LSMs) are expected to lead to improved short-term to longrange forecasting models. Because the land/surface parameters are highly integrated, errors in land surface forcing, model physics and parameterization tend to accumulate in the land surface stores of these models, such as soil moisture and surface temperature [2-4]. This has a direct effect on the models’ water and energy balance calculations, and may eventually result in inaccurate weather predictions. Timely monitoring of natural disasters is important for minimizing economic losses caused by floods, drought, etc. so it’s important for emergency management during natural disasters. Consequently, remote sensing for land/surface temperature has become an important research subject to a global scale [5].
Ground observations are generally useful for local applications; however, they are highly intensive in man-power and equipment costs. Furthermore, ground observations of land surface temperature are point measurements and since variability can be high, especially in regions with discontinuous vegetation, scaling up to spatial averages is often difficult [6]. In other side satellite-generated brightness temperatures (BT) are more convenient on global level and temporal basis [7,8].
Instantaneous measures of microwave brightness temperature (BT) have been used in a variety of applications to estimate column water vapour abundance, rainfall rate, surface ocean wind speed, ocean salinity, soil moisture, freeze/thaw state, land surface temperature, inundation fraction, and vegetation structure [9-14]. Land surface properties can be inferred accurately if physical temperature and emissivity variations can be separated [15,16]. Diurnal synoptic and variations of land surface temperature, as well as the atmospheric temperature and water vapour profiles, affect the observed BT. More frequent are the observations of BT throughout the day, the better understanding of the variability of the retrieved parameters is obtained [17].
There are a very few studies dealing with the characterization of the BT diurnal variation over land. The diurnal variation of physical and brightness temperatures as a function of incident solar radiation has been modelled for the Tropical Rainfall Measuring Mission (TRMM) Microwave Imager (TMI) [18]. The characteristics of the skin temperature diurnal cycles as measured from IR over different land types were investigated. In densely vegetated areas with more moisture, skin temperature exhibits a smaller diurnal variation than in arid and desert areas [19].
The paper is organized in the sections below. Following the description of the study area in Section 2, brief discussion about datasets in section-3, the methodology of calculating LST, and a brief introduction to normalized mutual information measure are presented in Section 4. The analysis and conclusions are presented in Sections 5-6, respectively.
The study area has six training sites on earth in different continent in order to compare the temperature in different satellite datasets in same location (Figure 1). Sample sites are located in the following places: (1) Karl Stefan Memorial Airport (USA); (2) Mondai, Santa Catarina (Brazil); (3) Belgrade, Serbia (Europe); (4) Khartoum, Sudan (Africa); (5) Chengdu, China; (6) Kalgoorlie, Australia.
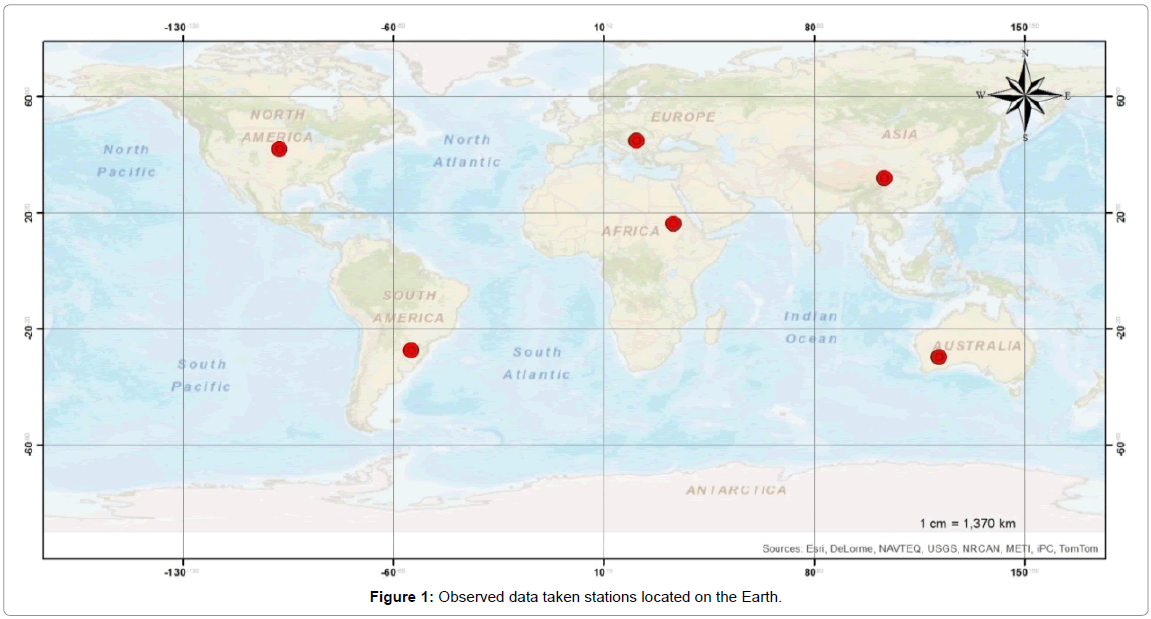
Figure 1: Observed data taken stations located on the Earth.
This research work has used thermal bands of AMSR-2, Landsat and ASTER satellite data. Technical characteristics of used satellite data are listed as it follows:
AMSR2
The Advanced Microwave Scanning Radiometer-2 (AMSR-2) on board the GCOM-W1 satellite is a remote sensing instrument for measuring weak microwave emission from the surface and the atmosphere of the Earth. From about 700 km above the Earth, AMSR-2 provides highly accurate measurements of the intensity and scattering of microwave emissions and scattering. The antenna of AMSR-2 rotates once per 1.5 seconds and obtains data over a 1450 km swath. This conical scan mechanism enables AMSR-2 to acquire a set of daytime and night time data with more than 99% coverage of the earth every 2 days. It’s had 7 frequencies with vertical and horizontal polarizations. Here 36.5 GHz vertical frequency was used for land surface temperature, get from Japan Aerospace Exploration Agency. The 36.5 GHz AMSR-2 footprint is an oval of 25 km square, where the derived surface temperature fields are resampled in a 0.25 degree grid. A subset covering the sample sites is cut from the global dataset. The choice for these location is motivated by the presence of sets of observational data for the corresponding period of time (i.e. year 2013-14) and there availability. Observed data is collected from 6 stations located on earth, spatially representative of different types of land cover [20] (Figure 1).
Landsat
In this research work Landsat 8 satellite data was used. Landsat 8 carries two instruments: The Operational Land Imager (OLI) sensor and Thermal Infrared Sensor (TIRS) sensor. The TIRS sensor provides two thermal bands. These sensors provide improved signal-to-noise (SNR) radiometric performance quantized over a 12-bit dynamic range. This translates into 4096 potential grey levels in an image compared with only 256 grey levels in previous 8-bit instruments. Improved signal-tonoise performance enables a better characterization of land cover state and condition [21]. This product is delivered as 16-bit images (scaled to 55,000 grey levels). For this research work band number 11TIRS (11.5- 12.51 μm) 100 m was used for surface temperature.
ASTER
ASTER data provides the user community with standard data products throughout the life of the mission. Algorithms to compute these products were created by the ASTER science team, and are implemented at the Land Processes Distributed Active Archive Centre (LP DAAC). Users can search and browse these products through GDS and NASA Reverb. For this research work band number 14 TIR (10.95- 11.65 μm) was used for surface temperature. It’s have 16 bit data with +/-8.55 telescope pointing capacity [22].
In our previous study, we estimated microwave land surface emissivity over the globe from AMSR-E observations at all frequencies and polarizations [23]. The previous emissivity retrieval is based on the assumption that the infrared skin temperature is the effective physical temperature, which is equivalent to assume that the microwave brightness temperature originates from the skin. This assumption is not always true, but necessary due to the lacking of general globe information on penetration depths and temperature profiles.
A physical model was proposed to account for the effect of penetration depth on emissivity retrievals by revising the physical temperature [24]. In this research work, first take sample sites and then derive land surface temperature from satellite brightness temperature by the help of following scaling factors for different satellite data [25]:
AMSR-2
For AMSR2 data scale factor is set as 0.01 [K]. For instance, if brightness temperature data is stored as 28312, original value of the data is 283.12 [K].
ASTER
ASTER surface temperatures are computed from spectral radiance so begins by converting DNs to radiance and for that equation is following:
Lλ=(DN-1) X UCC
Where Lλ is the spectral radiance, DN are the TIR band digital numbers, and UCC are the published Unit Conversion Coefficients (0.005225 w/m-2/sr-1/μm-1).
Temperature (measured in degrees Kelvin) is then given by:
T=K2 / (ln (K1/ Lλ+1)
Where K1 (641.32) and K2 (1271.22) are constants derived from Planck’s radiance function.
Landsat
OLI and TIRS band data can be converted to TOA spectral radiance using the radiance rescaling factors provided in the metadata file:
Lλ=MLQcal + AL
where:
Lλ=TOA spectral radiance (w/m-2/sr-1/μm-1)
ML=Band-specific multiplicative rescaling factor from the metadata
(RADIANCE_MULT_BAND_x, where x is the band number)
AL=Band-specific additive rescaling factor from the metadata
(RADIANCE_ADD_BAND_x, where x is the band number)
Qcal=Quantized and calibrated standard product pixel values (DN)
TIRS band data can be converted from spectral radiance to brightness temperature using the thermal constants provided in the metadata file:
T=K2/(ln (K1/Lλ+1)
where:
T=At-satellite brightness temperature (K)
Lλ=TOA spectral radiance (w/m-2/sr-1/μm-1)
K1=Band-specific thermal conversion constant from the metadata
(K1_CONSTANT_BAND_x, where x is the band number, 10 or 11)
K2=Band-specific thermal conversion constant from the metadata
(K2_CONSTANT_BAND_x, where x is the band number, 10 or 11)
In the following section, 1° × 1° spatial subsets of the products were co-registered so that the resulting subsets cover the same area as the Landsat, ASTER and AMSR-2 images in Figures 2-4. Where necessary, spatial re-sampling was performed using the ‘nearest neighbour’ method. The gravel plains are highly homogenous in space and time and outside globe two seasons (around September and June) the chances for precipitation are remote therefore, it is safe to assume that the land surface was completely dry for the results presented in this paper. The following section briefly discusses the actual land surface temperature on the same area and time from different satellite datasets (Figures 2-4).
AMSR-2
Figure 2 shows an example of the AMSR-2 surface temperature retrievals at day time in June 2014 and September 2013, when observational data have been sampled.
AMSR-2 June 2014 data show minimum 166.67 K and highest 305.34 K temperature and for September 2013 minimum is 170.78 K and highest is 305.34 K temperature. In June highest temperature is present in Sahara desert, western centre of North America and north-eastern part of Brazil, western sector of India and China. In September 2013 is the same like 2014 but high temperature is also present in Australian desert, in reduced areas of India and China but increased areas of South Africa and South America (Figure 2).
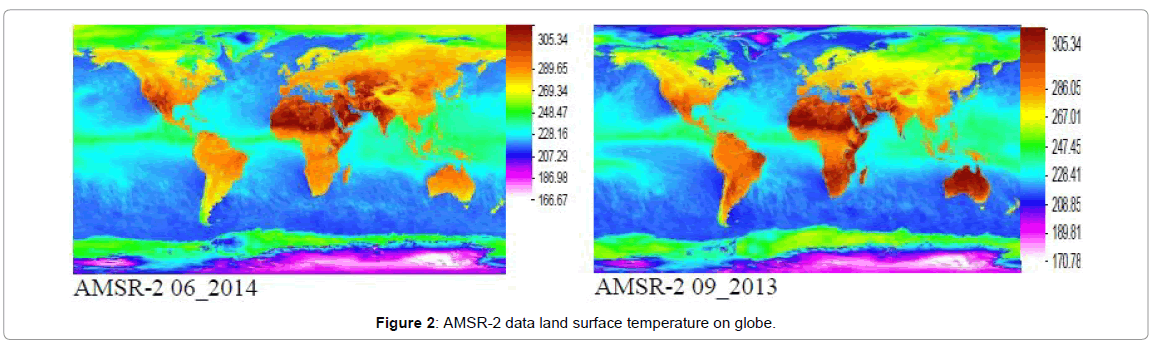
Figure 2: AMSR-2 data land surface temperature on globe.
Landsat
In 2014 sample site in Europe, Landsat 8 band number 11 shows 267.11 K as lowest temperature and 312.92 K as the highest temperature. Maximum region show around 290 to 300 K temperatures. In North America its 287.73 to 310.57 K and in South America is 274.34 to 293.71 K but maximum region have high temperature, above than 285 K (Figure 3).
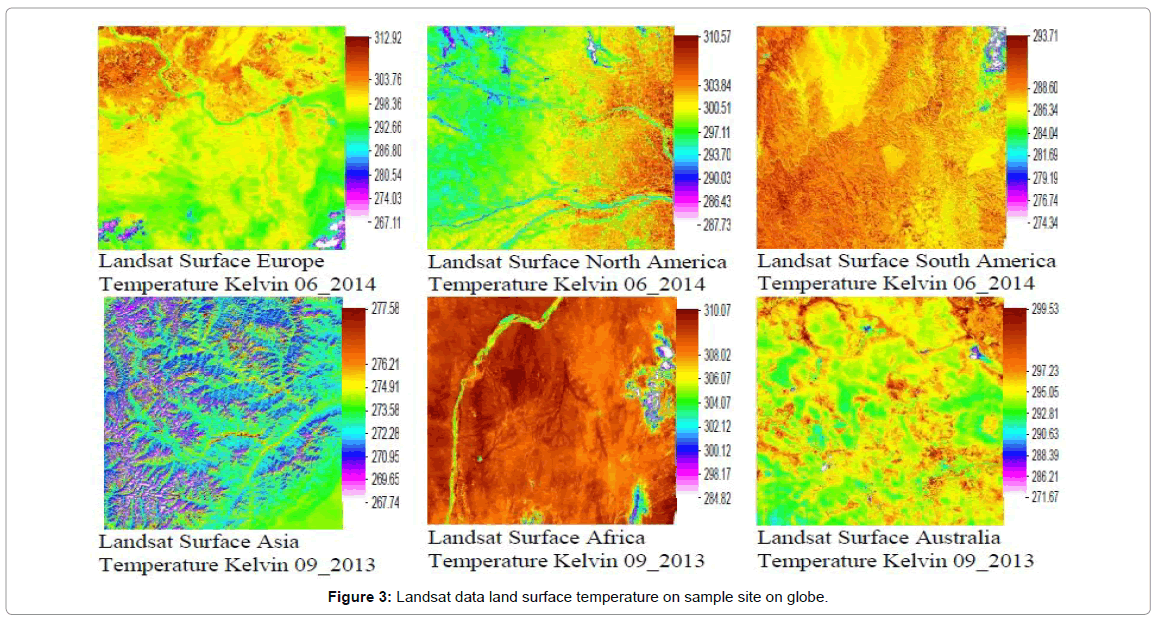
Figure 3: Landsat data land surface temperature on sample site on globe.
In 2013 in Australia the range of temperature is between 271.67 and 299.53 K. For Africa it is 284 to 310 K but a maximum area has above than 305 K temperature, which shows a high temperature. In Asia it’s from 267.74 to 277.58 K and maximum area has average temperature (Figure 3).
ASTER
In ASTER data on same location in 2014 in Europe, temperature range is in between 289.31 to 318.16 K and for North America is from 277.88 to 300.22 K. In both regions, maximum area is cool. In South America and Asia temperature range is 277.88 to 300.22 K and 256.85 to 300.68 K respectively. Maximum area has average temperature. In Africa and Australia it`s 275.14 to 320.80 K and 285.79 to 303.80 K respectively (Figure 4).
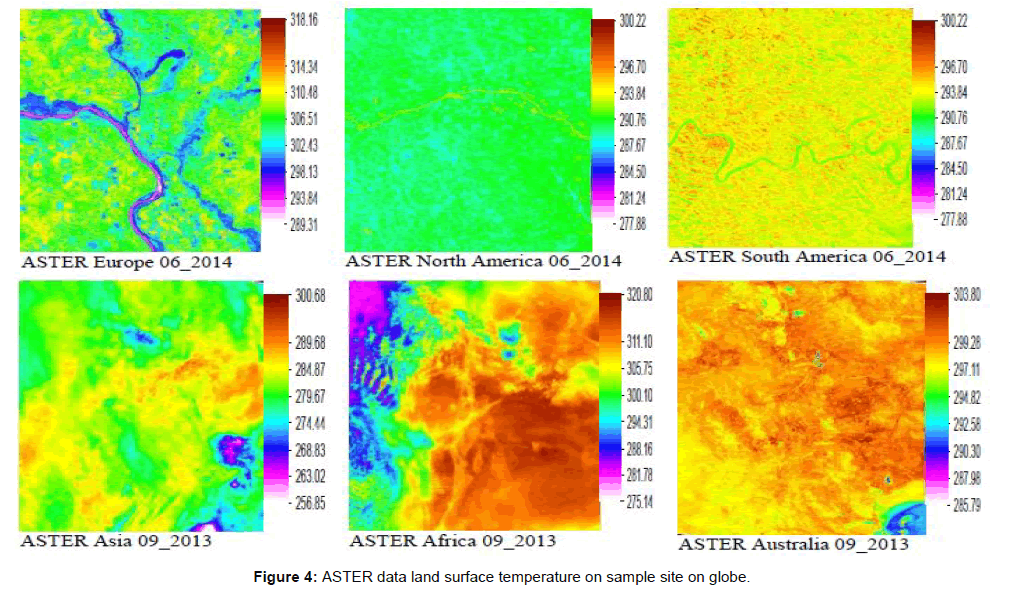
Figure 4: ASTER data land surface temperature on sample site on globe.
Comparing in land surface temperature in AMSR-2, Landsat and ASTER satellite data
In North America Landsat data showing highest and AMSR- 2 data is showing lowest temperature in all locations. ASTER data temperature values are in between in North America. In South America ASTER show highest temperature and AMSR-2 lowest and Landsat is in between (Figure 5).
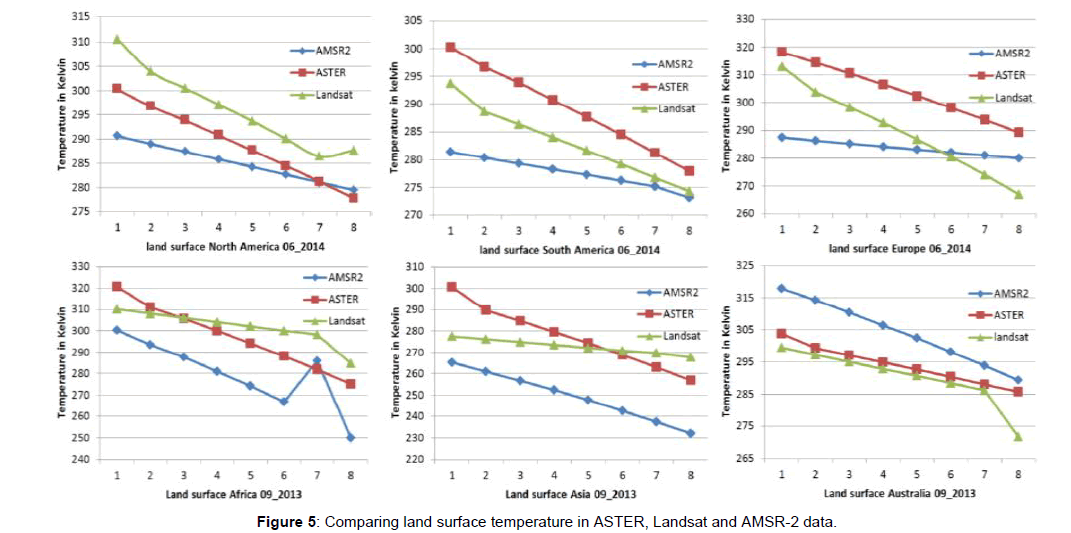
Figure 5: Comparing land surface temperature in ASTER, Landsat and AMSR-2 data.
For Europe is same like South America (Table 1). In Africa Landsat have highest and AMSR-2 lowest temperature and ASTER data temperature is in between. In Asia ASTER is highest, than Landsat and AMSR-2 is the lowest temperature. For Australia, Highest is AMSR-2 than ASTER and Landsat is lowest temperature (Figure 5).
| AMSR2 Tem. K | ASTER Tem. K | Landsat Tem. K |
|---|---|---|
| North America 06_2014 | ||
| 290.63 | 300.22 | 310.57 |
| 288.99 | 296.7 | 303.84 |
| 287.43 | 293.84 | 300.51 |
| 285.83 | 290.76 | 297.11 |
| 284.27 | 287.67 | 293.7 |
| 282.67 | 284.5 | 290.03 |
| 281.11 | 281.24 | 286.43 |
| 279.55 | 277.88 | 287.73 |
| South America 06_2014 | ||
| 281.39 | 300.22 | 293.71 |
| 280.33 | 296.7 | 288.6 |
| 279.32 | 293.84 | 286.34 |
| 278.28 | 290.76 | 284.04 |
| 277.27 | 287.67 | 281.69 |
| 276.23 | 284.5 | 279.19 |
| 275.45 | 281.24 | 276.74 |
| 273.16 | 277.28 | 274.34 |
| Europe 06_2014 | ||
| 287.44 | 318.16 | 312.92 |
| 286.33 | 314.34 | 303.76 |
| 285.27 | 310.48 | 298.36 |
| 284.19 | 306.51 | 292.66 |
| 283.14 | 302.43 | 286.8 |
| 282.06 | 298.13 | 280.54 |
| 281.01 | 293.84 | 274.04 |
| 279.95 | 289.31 | 267.11 |
| AMSR2 Tem. K | ASTER Tem. K | Landsat Tem. K |
|---|---|---|
| Africa 09_2013 | ||
| 300.22 | 320.8 | 310.07 |
| 293.6 | 311.1 | 308.02 |
| 287.6 | 305.75 | 306.07 |
| 281.07 | 300.1 | 304.07 |
| 274.3 | 294.31 | 302.12 |
| 266.75 | 288.16 | 300.12 |
| 285.87 | 281.78 | 298.17 |
| 250.07 | 275.14 | 284.42 |
| Asia 09_2013 | ||
| 265.13 | 300.68 | 277.58 |
| 260.93 | 289.68 | 276.21 |
| 256.75 | 284.47 | 274.91 |
| 252.36 | 279.67 | 273.58 |
| 247.71 | 274.44 | 272.28 |
| 242.63 | 268.83 | 270.95 |
| 237.47 | 263.02 | 269.65 |
| 232.05 | 256.85 | 267.74 |
| Australia 09_2013 | ||
| 317.96 | 303.8 | 299.53 |
| 314.34 | 299.28 | 297.23 |
| 310.48 | 297.11 | 295.05 |
| 306.44 | 294.82 | 292.81 |
| 302.43 | 292.58 | 290.63 |
| 298.13 | 290.3 | 288.39 |
| 293.76 | 287.98 | 286.21 |
| 289.31 | 285.79 | 271.67 |
Table 1: Sensor measured temperature in kelvin.
The analysis results show that Landsat and ASTER data temperature is close to ground measurements in compare of AMSR-2 data temperature due to their high resolution and scale (Tables 1 and 2).
| North America | 302.10-289.10 |
| South America | 293.1-288.10 |
| Europe | 303.10-289.10 |
| Asia | 300.10-268.10 |
| Africa | 311.10-296.10 |
| Australia | 302.10-285.10 |
Table 2: Ground measured temperature in kelvin.
Evaluation of different data sources of surface temperature indicates that satellite derived passive microwave surface temperature is not necessarily a superior estimate compared to simulated surface temperature, if evaluated against a data set of observed point measurements. In general, data assimilation systems take into account observational errors and are able, despite errors in the observations, to obtain improvement of land surface temperature results, as long as the temporal trends are well represented. This research work show that Landsat and ASTER is close to ground measurements in compare of AMSR-2 data due to their high resolution and scale.
It should be pointed out that the atmospheric forcing data sets used in the present study are mainly reanalysis data making use of in-situ observations. As a consequence, the simulations over the globe with a dense observation network are relatively accurate. However, no or little observation data are available for all sample sites and the quality of the forcing data and the simulations decreases. Hence, in these areas more scope is present for remote sensing data to constrain this type of research [26,27].
A further consideration is that the retrieval of passive microwave satellite derived surface temperature is hampered by weather conditions: frozen soil conditions in winter and (precipitating) clouds in summer. These phenomena appear to put some emphasis on ‘near’ in the assessment of the passive microwave retrieval of surface temperature as a ‘near all-weather’ technique. Consequently, this also applies to the passive microwave soil moisture algorithm retrieval, in case the passive microwave surface temperature estimate is used [28,29].