Journal of Geology & Geophysics
Open Access
ISSN: 2381-8719
ISSN: 2381-8719
Review Article - (2017) Volume 6, Issue 1
In this study we delineate the subsurface structures within an area of about (35 × 25) km2 in the Western part of Qarun Concession, using magnetic method. The main goal is to understand the role of subsurface structures and tectonics in the petroleum processes. Land magnetic survey has been carried out along profiles covering the area under study. The magnetic data set is processed using horizontal Gradient and tilt derivative. Also, 3D Euler deconvolution and 2D power spectrum have been used as fast techniques for depth estimation. The results indicate that the most predominant tectonic trends are generally aligned in NE-SW for the major structures, while the minor structures are aligned in NW-SE. The depth to the regional basement estimated range around 3900 m, and the shallower structures range around 750 m. The obtained results are in good agreement with the data from drilling wells in the area under study. The RTP magnetic anomalies range between -116 nT and 145 nT. The high values strongly suggest that the near structures (ferromagnetic minerals) accompany the basement along the West Qarun concession. There is good correlation between the structures deduced from the magnetic analysis and the known geological information. Most of these oil accumulations are restricted to the major tectonic trends with a NW-SE and NW-SE directions. We conclude that oil accumulation is structurally controlled by faulting, probably as a result of tectonic regimes during Cretaceous and Jurassic periods.
Keywords: Land magnetic survey, West Qarun oil field, Subsurface structures
The Western Desert of Egypt covers an area more than 600,000 km2 and comprises almost two thirds of the whole area of Egypt. The North Western Desert represents an important part of the unstable shelf of Northern Africa. It has been subjected to different tectonic regimes since the Paleozoic time, which were able to form the construction of many basins, sub-basins, ridges, troughs and platforms. The West Qarun concession is located to in the north part of the Western Desert (Figure 1). It is close to the Nile Delta region and the convergence boundary of three plates (Euroasian, Africa and Arabian). Also, it is affected by the opening of the Red Sea and its branches (Gulf of Suez and Gulf of Aqaba). Thus the seismic activity there is due to the interaction between the three plates. These structural features encourage foreign companies to establish condensed exploration works in this region. The Western Desert still has a significant hydrocarbon potentiality as some oil and gas discoveries indicate [1,2]. The geologic information of the Qarun oil field and its reservoir are summarized in Table 1. El-Nady [3] reported that the oils from Khatatba and Alam El Bueib formations are mature, derived from source rocks containing marine and terrestrial organic matter, respectively. The source environments and maturity of the oil from Khatatba reservoir are similar to the Khatatba source rock. The Khatatba formation is ranging in age from Upper Cretaceous to Middle Jurassic. Figure 2 represents the potential source rocks of the studied oilfield. In the present work, land magnetic survey is carried out for the 1st time, covering an area of about 800 km2 around West Qarun oil field and lies between latitudes 29.70°-30.00° and longitudes 30.45°-30.85°. The area is not leveled and the ground elevation ranges between 116 and 175m above the sea level. There are major faults and minor folds; the land rises to the complex geological history [4]. The complicated structure and the great sedimentary deposition (2) are similar to the Abu Ghardig basin [5]. In the Qarun concession both shallow and deep structures are present along faulted anticlines that generally aligned in NE-SW direction [6].

Figure 1: Location map of the Qarun oil field.
| Depth (ft) | 17786 |
| Reservoirs | KhatatbaFm. |
| Age | M. Jurassic |
| Lithology | Sandstone |
Table 1: Geologic information of the Qarun oilfield in the North Western Desert, Egypt [15].

Figure 2: Generalized stratigraphic column of the North Western Desert, Egypt [5].
The area is characterized with different tectonic events, affecting the north western desert and occurred during the Late Cretaceous to Quaternary. It is related to the movement of the North Africa plate towards Europe. This compression movement caused the elevation, major faulting and minor folding in the northern western desert. Historically, the west Qarun oil field was discovered in 1994 by Phoenix and its partner Apach companies. The first significant hydrocarbon zones were found in kharita and Baharia formations as primary reservoirs at depths between 2900-3200 m. They lie between northwest flank of the Ginidi basin and Kattaniya uplifts. Previous seismic and gravity studies suggested that these thrusts faults are nearly vertical (Figure 3) and rooted in the basement rocks [7]. The reverse faults and the associated echelon fold are bisected by two NW-SE trending normal faults, downthrown to the SW [6].

Figure 3: comparison of seismic and gravity interpretation of the Qarun oil field [7].
This work is done on behave of the geological understanding of the site settings that associated with hydrocarbon and subsurface structures. Generally, this work represents a part of the geological and geophysical studies conducted in West Qarun concession. The magnetic method is shearing in the work to resolve the subsurface structure pattern and the ambiguity between the available geological and geophysical data. The land magnetic survey has two objectives: the first is to obtain the subsurface structures of the fracture basement, while the second is to estimate depth of hydrocarbon reservoir zone.
The magnetic method has an advantage that it is a fast and effective technique for mapping the fracture basement [8]. The field strength is measured with a magnetometer placed a few meters above the ground level. Measurements can be taken either along profiles or on a grid (mesh of points). High sensitivity devices are utilized Proton Precision Magnetometers for the measurement of the total magnetic field of the earth. In homogeneities in the magnetic properties of soils will cause variations in the measured field which can easily be detected.
Data acquisition
Before the survey, a base station, for diurnal correction is placed at a homogenous place lying near the investigated area. The magnetic survey is conducted using two proton magnetometers (Figure 4). One of them is used to survey the area (mobilized), while the second magnetometer is considered a base station to record the magnetic field diurnal variations. The magnetic profiles are taken along the available Paths around and crossing the Qarun oil field. Figure 5 shows the profiles and stations positions using GPS system navigation and the direction of traverses of each profile.
The measured magnetic data have been subjected to two kinds of corrections: removing the diurnal variation and subtracting 3.8 nT/km toward north direction (latitude correction). However, the survey area is not leveled but has gentle slope as the topography has minor variations from 144 to 175 m above sea level. The profiles are choosing along tracks and main roads (Figure 5). Once that data has been carried out along 13 profiles and has corrected from diurnal and latitude corrections, we are able to produce the variation in magnetic field which directly is related to the magnetic materials within the area (Figure 6).

Figure 5: Showing the magnetic profiles and stations location.

Figure 6: The total magnetic anomaly map of West Qarun Concession. The color background represents the corrected magnetic data. The red color represent high magnetic anomaly while the blue color represents low magnetic anomaly.
Magnetic data analysis and interpretation
The present study is based on qualitative and quantitative analysis of the magnetic data to delineate both shallow and deep structures. In that regards, reduce to the magnetic pole (RTP) is applied to the magnetic data using [9]. The RTP magnetic anomaly map (Figure 7) displays a major high magnetic anomaly about 145 nT (red color) in the eastern side and low magnetic anomaly about-116 nT (blue color) in the western side. The high values strongly suggest that the near structures (contact/fault) contain ferromagnetic materials that accompany the basement along the West Qarun concession. It should be stated that magnetic structures do not occur randomly, but are generally aligned along definite and preferred axes forming trends that can be used to define fracture basement. These anomalies could be related to significant susceptibility contrast between the highly magnetic basement rocks and the non-magnetic sediments.

Figure 7: The RTP magnetic anomaly map of West Qarun Concession. Black lines represent the fractures basement.
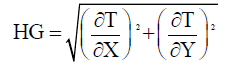
In order to trace the high magnetic anomaly from the RTP map, the Horizontal Gradient (HG) method has been used intensively to locate the contacts of magnetic susceptibility contrast. It is also robust method to delineate shallow and deep sources in comparison with the vertical gradient, which is useful only for the shallower structures. The amplitude of the horizontal gradient [10] is expressed a
 (1)
(1)
Where  the horizontal derivatives of the magnetic are field in the x and y directions. The amplitude of the horizontal gradient of the magnetic data of the West Qarun field area is calculated in (Figure 8). It shows a tentative qualitative interpretation of the horizontal gradient data. Generally, the area under study may be dissected by major faults striking in the NE-SW and NW-SE directions. The most interesting result is that the location of the reservoir field is well correlated with the horizontal gradient anomalies. This indicates that hydrocarbons in West Qarun concession area are structurally controlled, especially for the shallower basement.

Figure 8: The horizontal gradient map of the West Qarun concession. Black lines represent the tentative shallower structures.
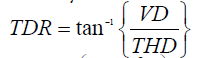
The tilt derivative filter (TDR) is estimated by dividing the vertical derivative by the total horizontal derivative Verduzco [11] as
 (2)
(2)
Where 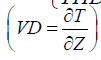 and
and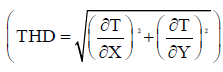 are first vertical and total horizontal derivatives, respectively.
The most advantage of the TDR is that its zero contour line is on or close to the fault/contact location. Figures 9 and 10 shows the TDR map and the faults interpretation of the magnetic data. The most prominent trend is NE-SW and NW-SE directions (Figure 10).

Figure 9: The TDR magnetic map. The zero contours (yellow color) represent Faults.

Figure 10: The Faults and structural map deduced from TDR magnetic map.
Depth of the fracture basement zone
The depth to the source of magnetic anomalies is valuable and important information in any geophysical interpretation of subsurface structures. In order to estimate the depth of fractures basement zone, 3D Eulardeconvolution and 2D Power Spectrum methods are applied to the magnetic data. The 2D Power Spectrum has been applied to land magnetic survey data [12]. It is used to determine the depths of basement complex. The Fast Fourier Transform (FFT) is applied on the magnetic data to calculate a two-dimensional power spectrum curve (Figure 11) shows two main average levels (interfaces) at depth 750 m (shallow intrusions) and 3900 m (deep basement layer).

Figure 11: 2D average power spectrum of Qarun region.
The 3D form of Euler’s equation can be defined [13] as
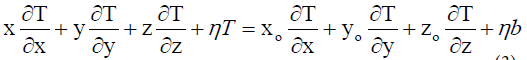 (3)
(3)
Where  are the derivatives of the magnetic field in the x, y, and z directions, η is the structural index value that needs to be chosen according to a prior knowledge of the source geometry. The results of the 3D Eular solutions are shown in Figure 12 using structure index 1.0 for dikes and faults. The depths are between 500 3750 m. The Eular’s depths are calculated from analytical signal magnetic map using Roest et al. [14] formula.

Figure 12: Euler method solutions of West Qarun oil Field projected to analytical signal map using a structure index of 1.0.
The previous magnetic maps should be converted in terms of local structures in the area (Figures 7-10). The solid black lines are expecting extensions of fractures in the basement rocks with the major trend NE-SW and NW-SE. The study is based on application of Horizontal gradient, tilt derivative, 3D Euler and 2D Power Spectrum methods. Results of these methods help to define the main geological trends and depths of subsurface structures. Also add a new insight on the subsurface structural settings of West Qarun concession from the land magnetic data.
