Journal of Geology & Geophysics
Open Access
ISSN: 2381-8719
ISSN: 2381-8719
Research Paper - (2019)Volume 8, Issue 6
2D electrical resistivity imaging, vertical electrical sounding and magnetic methods have been conducted for site characterization for large building foundations at Samara University, one of the emerging institutions of learning in Ethiopia. The main objective of the study was to examine the suitability of the subsurface geological formations and structures for foundation on the on-going construction and future expansion of the university. From the results of the survey, it has been possible to map the stratification of the subsurface layers, areas of weakness in the subsurface and the vertical as well as lateral extents of the different lithologies. Moreover, the depth to the substratum suitable for foundation is determined. From interpretation of the geophysical survey results, the near surface geology of the study area includes three layers: a first layer, which is the top soil having considerably varying thickness over the area; a second layer which is interpreted as a layer of vesicular basalt which is the best lithology for the foundation purpose. This layer extends to depth of about 6 m on the north and eastern parts of the area whereas it goes up to 11 m depth on the south and south-western part of the survey area. The third layer which is characterized by very low apparent resistivity response is interpreted as weathered basalt and clay. From a combined interpretation of the geophysical data, three weak zones have been identified over the survey area. Out of these one is oriented N-S while the other two are oriented in a near NW-SE direction. From all the above interpretations, it was possible to suggest that the university must expand towards the northern part of the campus compound. Moreover, special considerations should be taken during designing and implementation of buildings in the eastern and southern part of the area, where the weak zones detrimental to foundation of large buildings are mapped.
Building foundation; 2D electrical resistivity imaging; Magnetic anomaly; Weak zones
Ethiopia has been building many new universities and their number has increased drastically from 5 to 40 in the last decade. The emergence of these new universities has increased the number of students joining higher education in many folds. Samara University is one of these new universities, which is situated in Samara, Afar Regional State, Ethiopia (Figure 1). The area is accessible through an asphalted road that runs from Addis Ababa to Djibouti. The town, on which the university is situated, has a flat topography and is known for its warm climatic condition.
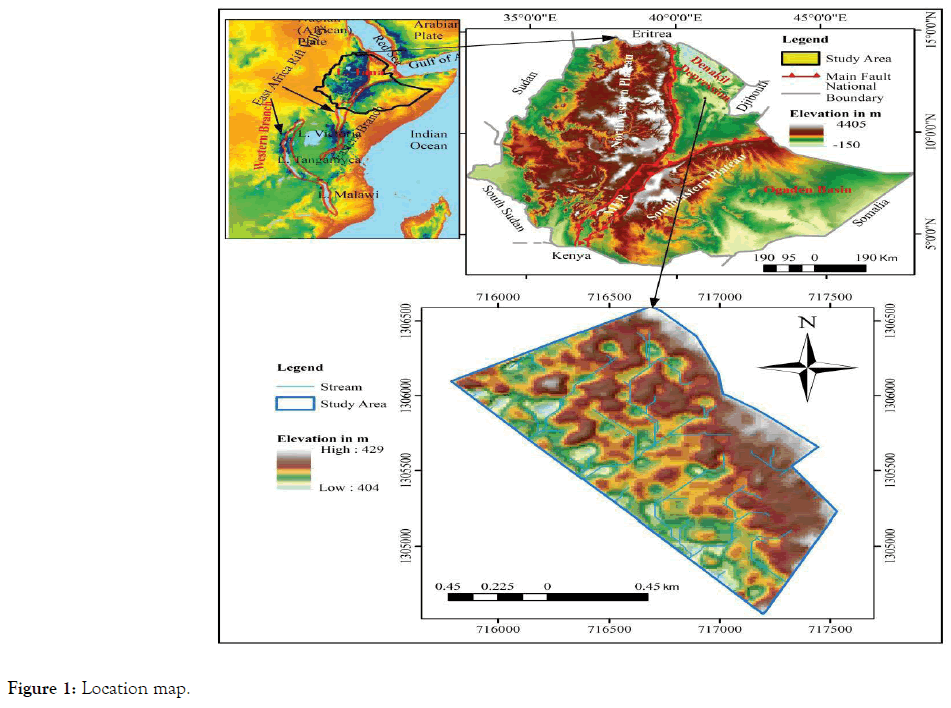
Figure 1. Location map.
Furthermore, the whole Afar Region, for which Samara town is the capital, is known for its active volcanic and earthquake activities. The near surface geology of the University compound, on which many of the buildings are constructed, is dominantly covered by unconsolidated and thick sand to sandy silt deposits and younger basaltic flows. Moreover, the area being tectonically active, there are a number of major geologic structures that cross the university area that need to be mapped and understood for the long term wellbeing of the buildings.
These human shelters must be safely designed and founded over suitable Earth materials for which proper and careful foundation design is an integral part of a structure. For these reasons it is vital to investigate the subsurface characteristics of soils and rocks as well as the presence and pattern of the weak zones in the university compound. The applications of geophysical methods are able to investigate and determine the subsurface characteristics such as rock type, depth to the bedrock, layer boundaries, and availability and pattern of weak zones [1].
Geophysical methods are used to determine the geological sequences and structures of subsurface rocks through the measurement of certain physical properties. Of these methods, the resistivity method is based on the fact that any subsurface variation in conductivity alters the pattern of current flow in the ground and therefore changes in the distribution of electric potential at the surface. Since the electrical resistivity of such factors as superficial deposits and bedrock differ from each other, the resistivity method may be used in their detection and to give their approximate thicknesses, relative distributions, depths and to some extent their physical characteristics [2].
To investigate the subsurface structures and determine the individual formation resistivity, a series of measurements must be made with the measuring set up in different positions. There are different techniques developed for different applications, like Vertical Electrical Sounding (VES): A technique used to examine the vertical change in resistivity. The variation in resistivity with depth is interpreted quantitatively to provide resistivity and thicknesses of the subsurface layers. Electrical Imaging is a recent development, which involves a combination of both traversing and sounding, to produce an image along a section through the subsurface. The magnetic method, on the other hand, involves the measurement of variations in the total magnetic field of the earth, caused by local differences in the magnetization of the subsurface rocks and soils. A magnetic survey is rapid and easy to carry out. In the geological field, the magnetic method locates boundaries between rocks, which display magnetic contrasts, as well as geologic structures such as faults or dykes [3].
In the present study, a combination of surface geophysical investigations which are 2-D electrical resistivity imaging, Vertical Electrical Sounding and magnetic surveying were used to determine the subsurface electrical stratification, the presence of structures, the depth to the possible foundation substratum and the substratum morphology over the surveyed area.
Geological setting
The main geological units in Ethiopia fall into one of the three major categories which are Precambrian basement, late Paleozoic to early tertiary sediments and the Cenozoic volcanic and associated sedimentary rocks [4]. The Afar Triangle, to which the study area is in close proximity, is an area of active extensional tectonics and basaltic magmatism from which the Gulf of Aden, the Red Sea and the Ethiopian rift systems radiate. Normal faults and open fissures are the principal elements of the Afar tectonics [5]. The tectonic and magmatic active part of the Southern Red Sea Rift in the Afar Depression ends in the Tendaho graben and Goba’ad Rift near Lake Abhe. Most of the Afar Triangle is covered by a Pliocene to Early Pleistocene basalt suite with minor rhyolite centers, which is named as the Afar Stratoid Series.
Afar stratoid series, rhyolite, basaltic fissure flows and quaternary deposits are the main lithology found in the study area and its surrounding. However, the university compound is mainly constructed on the quaternary deposits (alluvial) and basaltic fissure flows. The quaternary deposits consists clay, sand and sandy silt sediments. Whereas the basaltic fissure flows, characterized by vesicular features, are dark gray in colour and are highly fractured with minor weathering. Some of the vesicles are filled with white secondary materials which is calcite. This basalt unit is inter-bedded with sediment deposits indicating the cycles of flows.
Seismicity of the area
Seismic risk exists because of the convolution of three factors: seismic hazard, exposure to the hazard and vulnerability. The key to mitigating seismic risk therefore lies in controlling the vulnerability in the built environment by designing and building structures and facilities with sufficient resistance to withstand the effects of earthquakes [6].
Based on the seismicity, knowledge of the geology and tectonics the region can be broadly divided into three seismic source zones. These are the Afar Depression, the Escarpment and the Ethiopian Rift System; each zone distinguished by its own specific tectonic, geologic and seismic characteristics [7].
Earthquake activity in Eastern and Southern African region is characterized by the occurrence of destructive earthquakes which are controlled by the well-known regional tectonic feature, the East Africa Rift System [8]. The Ministry of Work and Urban Development of Ethiopia has established the Code of Standards for Seismic Loads in 1995 [9]. Accordingly, the country is divided into five zones depending on the known distribution of earthquakes which are non-damaging zone (0 zone), less damaging zone (zones 1 and 2) and zones of major damaging (zones 3 and 4). Moreover, the ground acceleration ratio (α°) depends on the seismic zones as given in Table 1 [9].
| Zone | 4 | 3 | 2 | 1 |
|---|---|---|---|---|
| α° | 0.1 | 0.07 | 0.05 | 0.003 |
Table 1: Ground acceleration ratio (α°) (Ethiopian Building Code Standard, 1995).
Specifically, the study area is in Afar depression seismic source zone and at sites of earthquake with epicenter which have higher magnitude that ranges from 6.0 to 6.9 [8]. Moreover, based on the Ethiopian Building Code Standard zoning [9], the site falls in zone 4, which is a zone with maximum damaging zone, with ground acceleration of 0.1. This shows that the study area and its surrounding are so near to seismically active area. Hence, considering the alluvial deposit, which is able to magnify the amplitude of earthquakes in the site and its vicinity to seismically active area of the Afar depression, the foundation design should incorporate all necessary conditions to withstand any seismic hazard.
Methodologies and instrumentation
The objective of the research was to establish the vertical electrical stratification of the subsurface geology around the present and future expansion sites of the University, to determine the depth to the substratum, to see the variation in lithology with depth and laterally over the area and to determine the presence of subsurface structures over the construction site. Hence, to achieve these objectives preliminary secondary data was collected from respective offices, different literatures were reviewed and finally geophysical methods, in combination, were deployed to collect primary data.
The geophysical methods which are applied on the site include Electrical Resistivity Tomography (ERT), Vertical Electrical Sounding (VES) and magnetic surveys. The electrical survey techniques employed here have been extensively used for geotechnical investigation in determining the subsurface geologic stratification of the different subsurface layers, contact between rock units, locate fault zones, zones of deep weathering and cavities [10]. In relation to the ERT survey employed, recent advances in instrumentation, data acquisition and interpretation have resulted in the development of the electrical resistivity imaging technique which has made it possible to systematically acquire large volume data in a short time whose interpretation yields a much refined and better picture of the ground. Owing to its high resolution, the technique as such is suitable for geotechnical problems like building foundation studies. It can also be used in the exploration of alluvial deposits where permeable gravel and sand beds can be distinguished from low permeability clays or rock. This capability has been applied for foundation materials at the construction site where significant sand deposits occur [11]. On the other hand, the application of magnetic method in engineering studies is to locate boundaries between different lithologic units and geological structures that display magnetic contrasts such as faults or dykes.
The instrument employed for the Electrical Resistivity Tomography and Vertical Electrical Sounding surveys is the IRIS SYSCAL Pro R1 Plus Switch-72, IP and resistivity unit working in both ‘‘multielectrode’’ and ‘‘rho’’ modes for the electrical resistivity imagining and sounding surveys respectively. A Scintrex made Integrated Geophysical System (IGS-2) proton precession magnetometer working in ‘‘total field’’ mode has been used for the magnetic surveys. A GPS has been employed for position location as well as timing the magnetic surveys.
Data were collected along selected profiles and over random points (especially for the magnetic method) well distributed to cover the investigation site. Electrical data that are collected using the above methods are analysed using appropriate interpretation software like ProsysII, RES2DINV, IpI2Win and Microsoft Excel. For the magnetic data, the analysis and plotting software used for this research are the Oasis Montaj (version 6.4.2), Surfer (version 9) and simple plotting software like Paint. Accordingly maps and models are produced and interpreted to obtain information set out in the project objectives.
Data acquisition and processing
Data acquisition: The 2D Electrical resistivity imaging data are acquired systematically along traverses which were selected to collect representative as well as detailed information about the study area and the foundation beneath. Totally five profile lines were selected for the survey, in which three of the profiles are oriented nearly NW-SE while the other two profiles are perpendicular to the former profiles and are with NE-SW orientation (Figure 2).
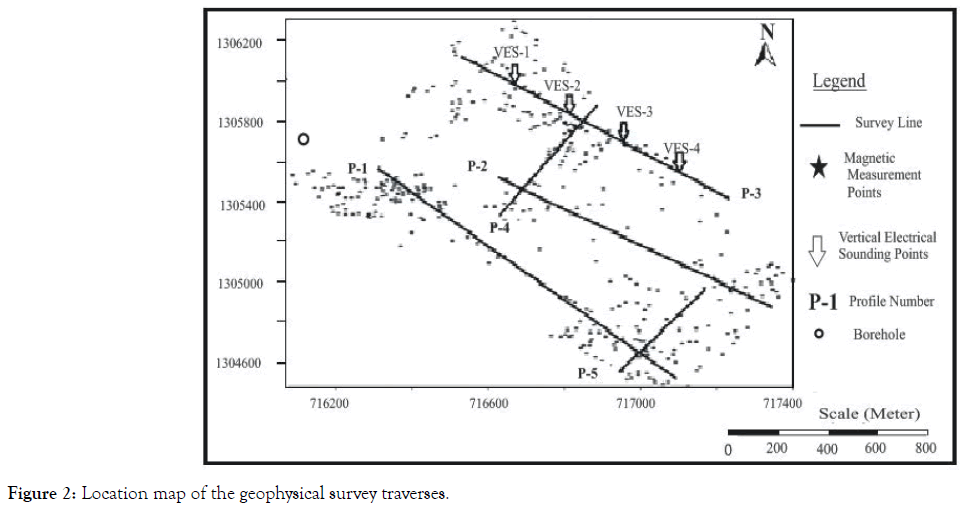
Figure 2. Location map of the geophysical survey traverses.
The interspacing between the three parallel profiles is about 250 m. The first profile (P1) is surveyed by one main and thirteen roll along sequences which cover a horizontal distance of about 918 m. The other two profiles (P2 and P3) are surveyed by one main and eleven and seven roll along sequences and, hence, have ahorizontal distance coverage of 810 m and 594 m respectively. While the fourth and fifth profiles (P4 and P5) are oriented nearly perpendicular to the three profiles (Figure 3). These two profiles (P4 and P5) are covered by one main and six and three roll along sequences respectively covering a horizontal distance of 540 m and 378 m respectively.
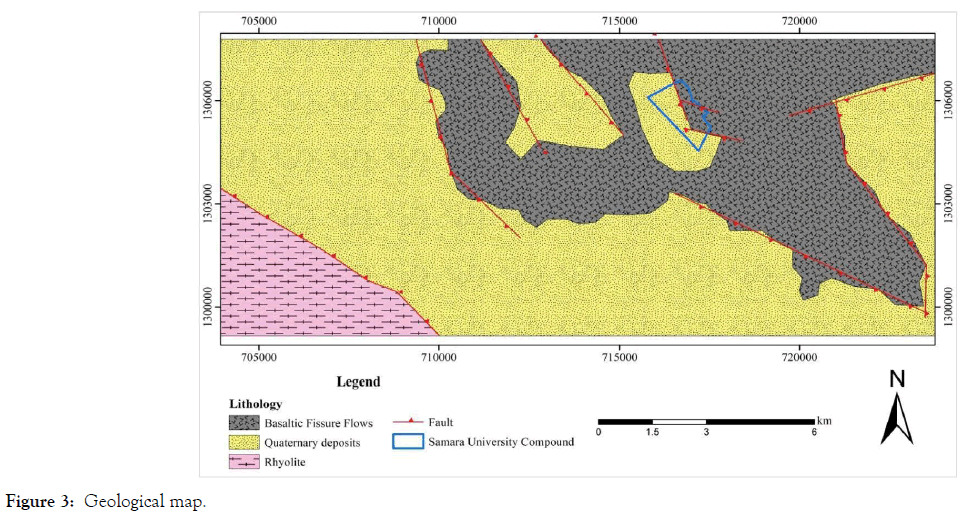
Figure 3. Geological map.
Each main sequence contains 648 data points covering 216 m horizontal distance while each of the roll along sequences contain 297 data points covering a horizontal distance of 54 m to give the above profile lengths of the respective traverses. These long profile lengths and the associated data density ascertain the large volume of data acquired to characterize the site. The ERT data was collected using Wenner-Schulumberger array with electrode spacing of 5 m. A typical setup of the instrument layout for the ERT survey is as given in Figure 2.
The Vertical Electrical Sounding data were collected using Schulumberger array from four sounding points in which all the points (VES 1, VES 2, VES 3 and VES 4) lie over a single profile (P3) of the 2D electrical resistivity imaging. These VES points are E-W orientated with about 150 m interspacing. For all surveys, a maximum AB/2 distance covered at field is 220 m. Location of the vertical electrical sounding points is also shown in Figure 2.
The surveying for magnetic data was started by establishing a base station within the study area at a place which is easily accessible and as far as possible free from magnetic noise. In addition to the magnetic readings, the geographic coordinates of the point at which the readings are taken and the time at which the reading has been taken were also recorded using Global Positioning System (GPS). Similar to that of the 2D imaging data, magnetic data were collected along the predefined profile lines (P1 to P5). Furthermore, magnetic data were also collected randomly within the study area. A total of 164 points were occupied along the five profiles for magnetic data collection and the points have an average of 20 meter spacing. Moreover, magnetic data were taken from 688 points randomly in the area. Therefore, magnetic data were collected on a total of 852 points during the field survey. The distribution of the magnetic data in the study area is also shown in Figure 3.
Data processing: The ERT data were retrieved from the instrument, filtered and analysed following standard procedure. The resulting 2D inverse model resistivity section gives the vertical as well as lateral resistivity variation of the subsurface and this plot is subjected to interpretation.
The individual VES data is processed using the IpI2win software to obtain subsurface layer parameters (ρi, hi) and the combined 2D map is developed for the profile (VES 1 to VES 4) using Surfer software.
As attested by the RMS error of less than 8% obtained for the interpreted curve, a very good correlation between the field data and the interpreted model sections are obtained for the given VES; and this is also observed to be the case for all the rest of VES indicating good quality data. A 3 to 4 subsurface layers are seen to represent the ground well in all the sounding curves (with the AB/2 of 220 m used for the survey).
The magnetic data were corrected for diurnal variation using a simple program on Microsoft excel spread sheet using the repeated readings of the base station. In addition to the diurnal correction, the magnetic data required geomagnetic main field correction which effectively removes the effect of the total geomagnetic field over the survey area. A practical method of geomagnetic main field correction is the use of the International Geomagnetic Reference Field (IGRF) value [12]. Therefore, the correction was made using the 2005 IGRF epoch value for the study area obtained from the data of IGRF application software. Finally the magnetic field anomaly- obtained by subtracting the diurnal variation and IGRF values from the survey data was used for processing to produce maps and profile plots using Oasis Montaj software.
Interpretations were made based on the results from the joint application of 2D electrical resistivity imaging, vertical electrical sounding, magnetic and a borehole log data. A borehole dug at the boundary of the University compound by Hela Construction PLC [13,14] for water supply purpose to the university community was used to assist in the interpretation of the data. The total depth of the borehole is 100 m while the depth of investigation of the 2D electrical imaging is 39 m so that the correlation is made only for the top 39 m depth. Furthermore, a correlation between the inverse model resistivity section and the magnetic anomaly profile plot, which (for Profiles 1-3) is surveyed along the same survey line with the 2D electrical resistivity imaging, is done. Moreover, data presentation in the form of apparent resistivity sliced-stacked depth map is used to assist in the interpretation of magnetic anomaly and analytical signal maps.
ERT along profiles-1, 2 and 3
These three profiles are aligned in a nearly NW-SE orientation covering a horizontal distance of 918 m, 810 m and 594 m respectively. The corresponding electrical resistivity imaging data collected are from 4509, 3915 and 2727 data points. However, after filtering the noisy data through automatic filtering and through visual/manual inspection and removal of spurious data, only 3915, 3321 and 2430 data points were used for the inversion purpose for the corresponding profiles. The least square inversion, done using RES2DINV software have resulted in a good quality inversion model section (Figures 4-6) with RMS error range of 7.8%-14% after five iterations.
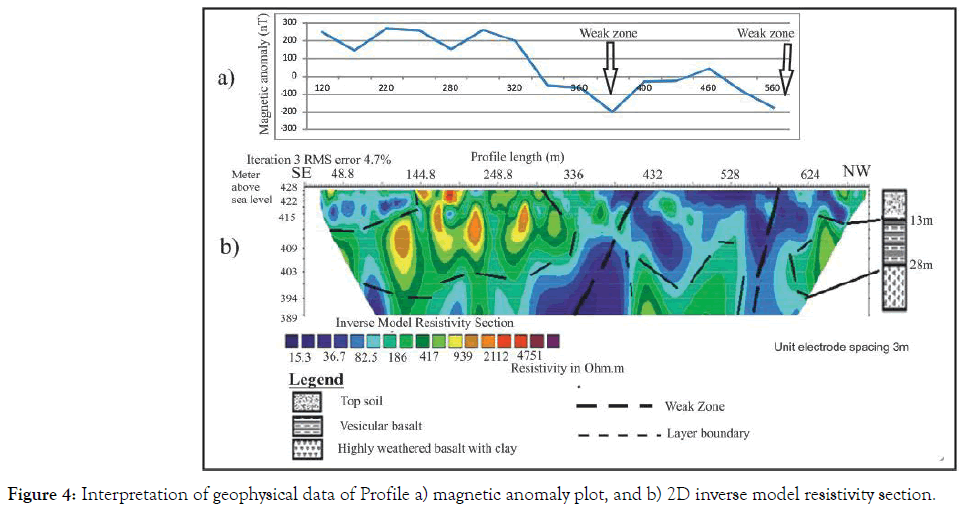
Figure 4. Interpretation of geophysical data of Profile a) magnetic anomaly plot, and b) 2D inverse model resistivity section.
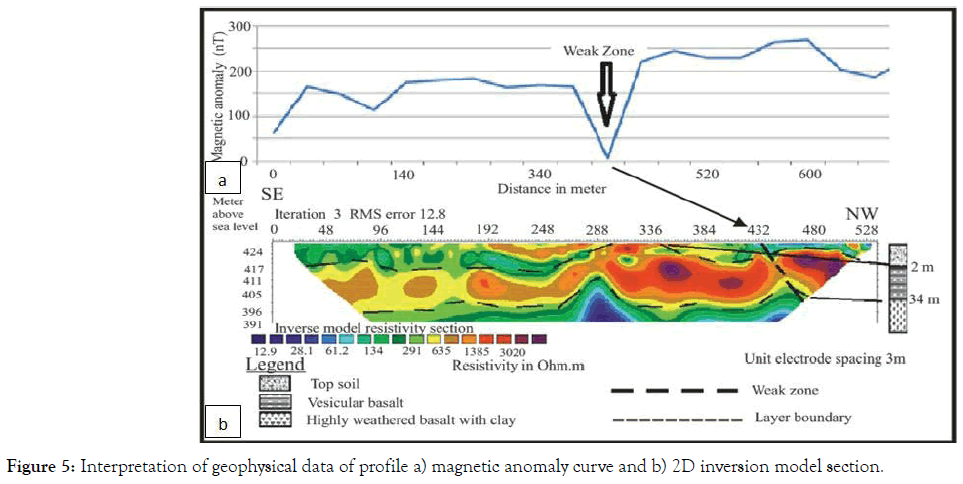
Figure 5. Interpretation of geophysical data of profile a) magnetic anomaly curve and b) 2D inversion model section.
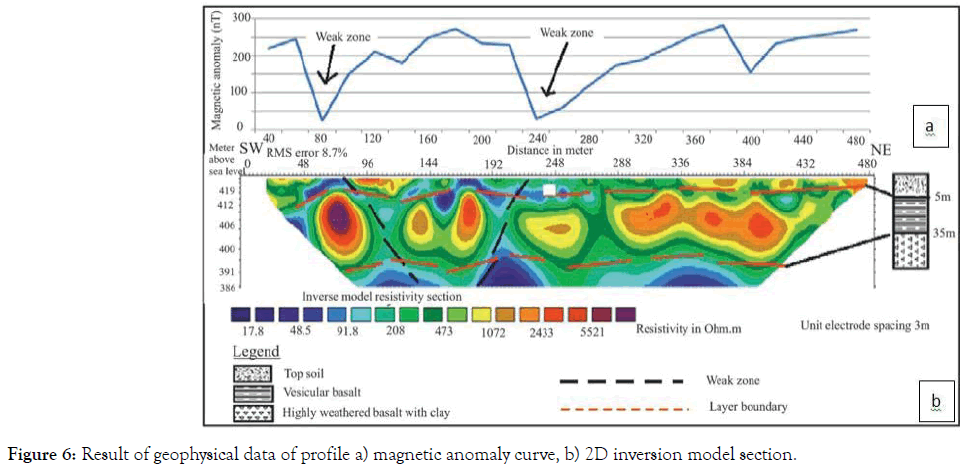
Figure 6. Result of geophysical data of profile a) magnetic anomaly curve, b) 2D inversion model section.
The different segments of the inversion model section are clustered into three layers. The first layer which extends from 6 m up to 17 m depth has intermediate apparent resistivity value that ranges from 27.6-134 Ωm. This resistivity value is the response of the top layer which is dominated by sand and sandy silt with some moisture. The second layer extends on average up to 25 m depth and has an apparent resistivity value ranging from 180 Ωm to 3000 Ωm. This higher apparent resistivity value is a response of the vesicular basalt forming the competent rock. The depth from surface to this competent rock varies on average from 6 m to 18 m in specific locations. Contrary to the upper layer, this bed gets thicker on the eastern part of the building site while it is thin on the western part. The third layer has lower apparent resistivity values ranging from 6 Ωm to 61 Ωm. This lower resistivity value is due to the weathered and fractured basalt with layers of clay or fluid saturation.
The amplitude variation of magnetic anomaly profile plot for the profile (1-3) ranges nearly form 250 to -200 nT (Figures 5-7). The lower peaks, which indicate the presence of weak zone(s), almost coincide with the discontinuites depicted on the 2D inversion model section of these three profiles.
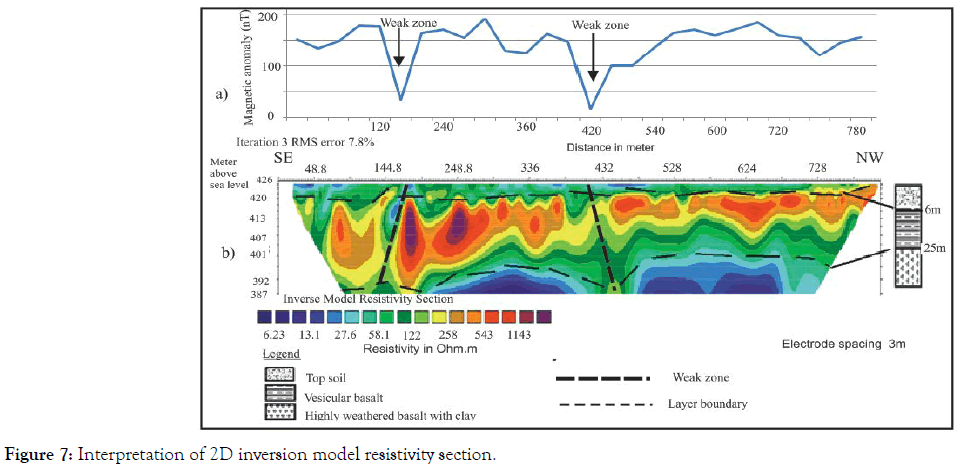
Figure 7. Interpretation of 2D inversion model resistivity section.
ERT along profiles 4 and 5
These profiles are surveyed in NE-SW orientation, nearly perpendicular to the three survey traverses (Profiles 1, 2 and 3). These profiles have a length of 540 m and 378 m and the corresponding data volume for each profile respectively is 2430 and 1539. However, after filtering and removing the noisy data 2133 and 1242 data points were used for inversion. The inverse model resistivity sections (Figures 8 and 9) produced by the least square inversion of the collected raw data has RMS error of 8.8% to 11.8%.
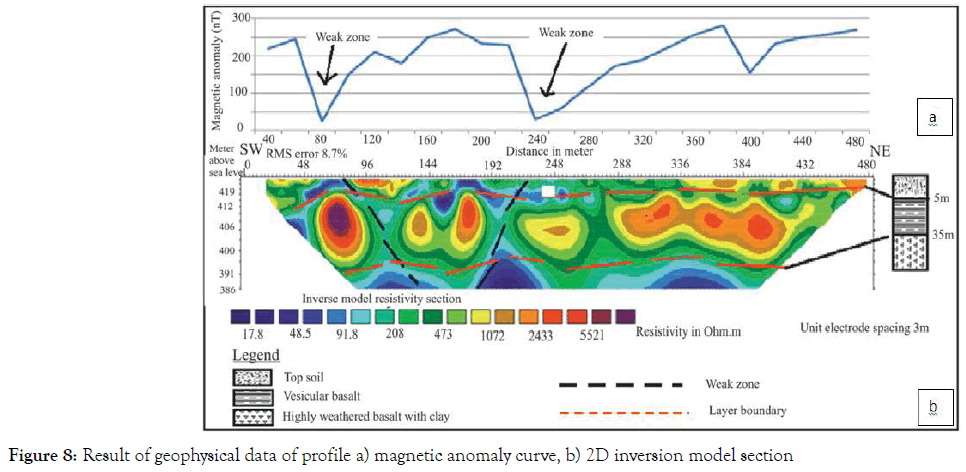
Figure 8. Result of geophysical data of profile a) magnetic anomaly curve, b) 2D inversion model section
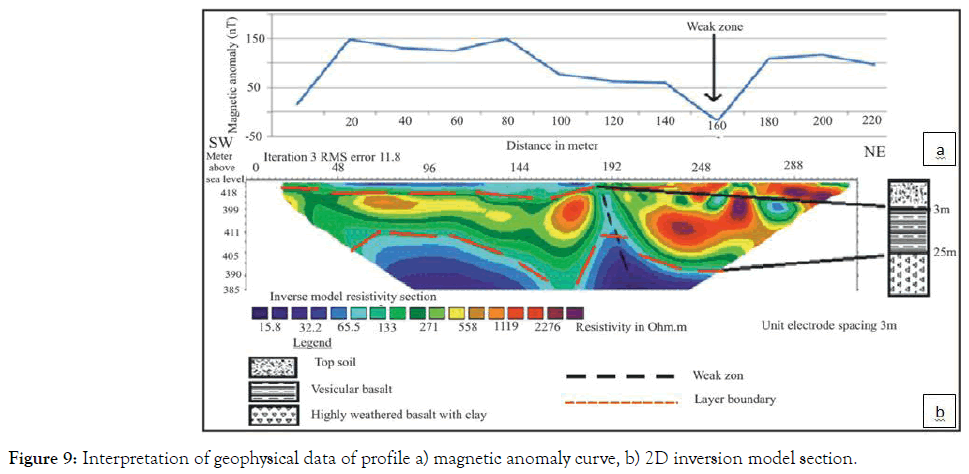
Figure 9. Interpretation of geophysical data of profile a) magnetic anomaly curve, b) 2D inversion model section.
Similar to the three profiles above, the inverted 2D model section of these two profiles is also seen to be conveniently divided into three subsurface layers, and it is presented along with the magnetic anomaly profile plot for the corresponding lines (Figures 8 and 9).
A relatively higher resistivity response of the top layer is obtained in the north eastern end of the study area. The apparent resistivity of this layer ranges from 289 Ωm to 1000 Ωm. The very high resistivity region within the top layer, which is in the northern part of the survey, is the response of near surface vesicular basalt whereas the relatively lower resistivity is the response of the top soil with some moisture. This layer extends to about 15 m in the southern end whereas it has less than 5 m depth extent on the northern end. The second layer extends on average up to 34 m depth and has an apparent resistivity value ranging from 133 Ωm to 5000 Ωm. This higher apparent resistivity value is a response of the competent rock, vesicular basalt. The depth from surface to this competent rock varies from 5 m on the north to 14 m in the south. The third layer of this profile has lower apparent resistivity values ranging from 15 Ωm to 91 Ωm. This low apparent resistivity value is a response of the weathered and fractured basalt and the clay.
The lower peak of the magnetic anomaly profile surveyed along similar survey line with Profile 4 and 5 (Figures 8 and 9) consides with the weak zone of the 2D inversion model of the profiles.
Correlation of the 2D inversion model sections
It is advisable to combine the three surveyed profiles (Profiles 1, 2 and 3) as in Figure 10 for better understanding and visualization of the subsurface condition in the study area. These three profiles are parallel to each other and the surveys were conducted from the northwest to southeast direction on all the lines.
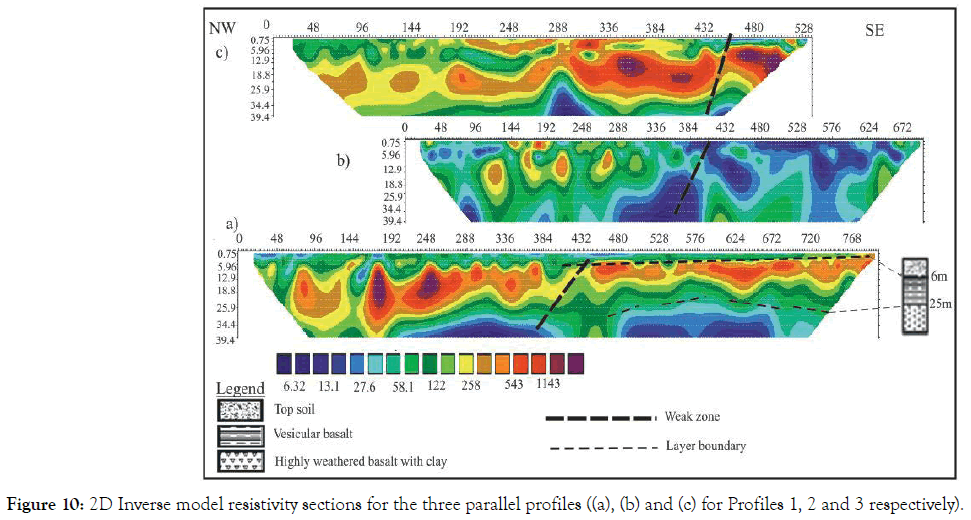
Figure 10. 2D Inverse model resistivity sections for the three parallel profiles ((a), (b) and (c) for Profiles 1, 2 and 3 respectively).
As it can be visualized from the Figure 10, the first layer with intermediate apparent resistivity value is relatively thick in the western part of the study area in profiles one and three with a decreasing coverage from south to north. The thickness of the second layer is significant in the north western part as compared to the southeast on all the profiles. However, the thickness of this layer also considerably decreases as going southeast wards.
The third layer has undulating nature on all the profiles and it is found at a relatively shallow depth in the south-eastern part of the area compared to the north-western part. This layer is also found at shallow depth on profile one and two with comparative to the other profiles.
The correlation of these 2D inverse model sections shows that the depth to the sound foundation is relatively shallow in the southeastern side of the study area whereas the material which is poor for foundation purpose is thicker in the north-western side of the surveyed area.
Furthermore Figure 11 shows the existence of a weak zone, probably a fault line that cuts profiles two and three at nearly similar locality from the north-western side of the study area and this is the place where the existing open structure is expected to pass through.
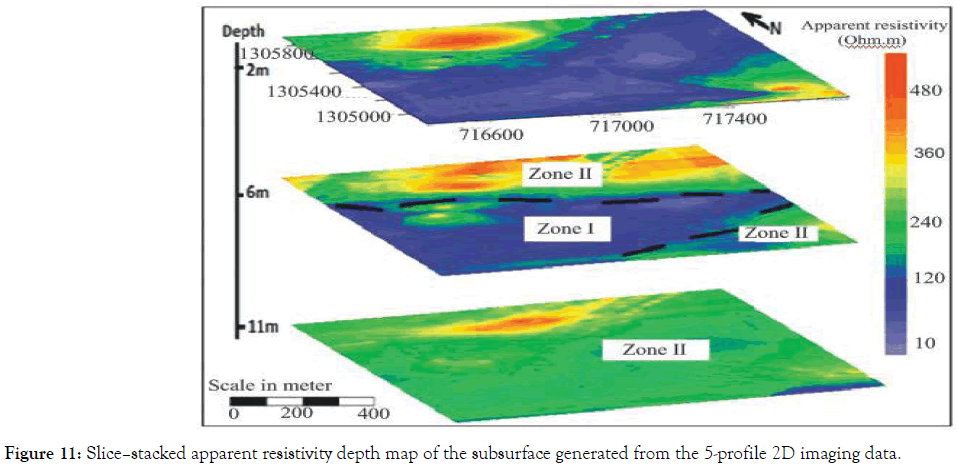
Figure 11. Slice–stacked apparent resistivity depth map of the subsurface generated from the 5-profile 2D imaging data.
Apparent resistivity sliced–stacked depth map
The sliced–stacked depth map of apparent resistivity (Figure 11) was prepared at selected depth from the 2D electrical imaging data and this representation aids to clearly visualize the apparent resistivity distribution over the surveyed area laterally as well as vertically which are expected to correlate with the subsurface variation in lithology, degree of weathering and fracturing, the presence of moisture and/or weak zones.
The sliced–stacked depth map (Figure 11) shows that, at 2 m depth a geological formation with very low apparent resistivity covers almost the entire subsurface. However, with increasing depth the sections depict a clear zoning in resistivity variations both horizontally and vertically. Accordingly the study area is subdivided into two zones (zone I and zone II).
Zone-I is the area with very low apparent resistivity value ranging from 10 to 180 Ωm and this is the response of the thick moist top soil composed of sand and sandy silt. This zone starts at 2 m depth and extends up to 6 m depth covering most of the central and south-eastern part of the study area specially the south western portion. However, the extent of coverage of this low resistivity region in both locations gradually decreases with depth.
Zone-II is described by relatively higher apparent resistivity value ranging from 180 Ωm to 500 Ωm which is likely to be the response of the vesicular basalt. This zone covers most of the northern to north western part of the study area starting from 2 m up to 11 m and its coverage increases with depth.
Generally this map shows that the southern and south-western part of the area comprises of subsurface formations which have very low resistivity as a result of the thick and moist top soil. Hence, it is not recommended for foundation purpose and/or it requires special attention in design and construction. However, most of the northern and north-eastern parts are covered by a formation which has intermediate to high resistivity value. This higher resistivity values are the responses of relatively harder formations as a result it will be advisable to construct buildings in these parts of the area for the future. This result is similar with the results drawn from the 2D inverse model resistivity section. The orientations of the profiles from which the data have been extracted are shown on the top slice.
Magnetic anomaly map One of greatest application of magnetic method in engineering studies is to locate boundaries between different lithologic units and the presence of geological structures such as faults or dykes that display magnetic contrasts. After applying the necessary reductions, the magnetic anomaly map is prepared as shown in Figure 12. According to this map the study area is classified in to three zones. Zone-I is characterized by very higher magnetic anomaly and it covers the northern part of the study area. Zone-II, which have intermediate magnetic anomaly covers most of the central the western part of the study area. The area designated by Zone-III show very low magnetic anomaly and covers the eastern part of the area. Moreover, this zone shows a N-S trend on the eastern part of the survey area. This N-S trending zone with low magnetic anomaly is interpreted as weak zone on the analytical signal map.
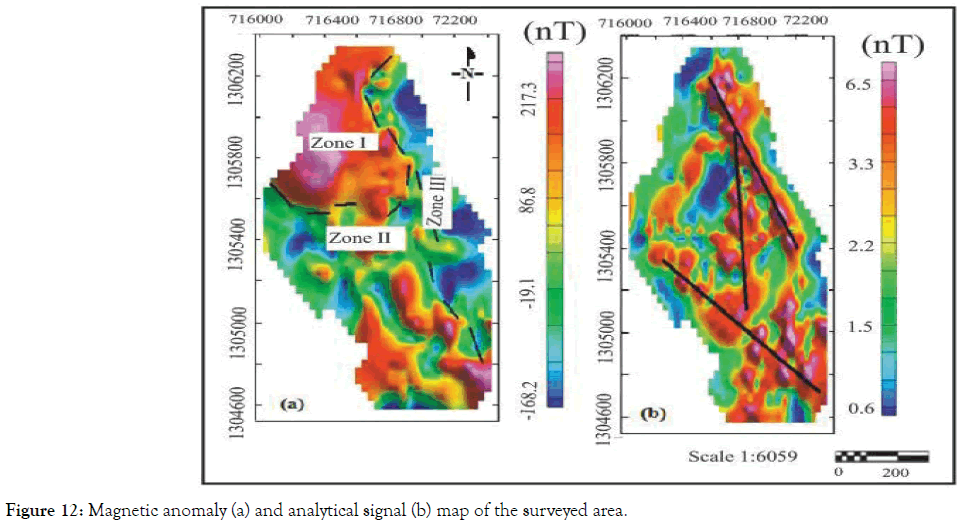
Figure 12. Magnetic anomaly (a) and analytical signal (b) map of the surveyed area.
Analytical signal map
As it is displayed in Figure 12, analytical signal map is developed from the magnetic data collected at field. Since analytical signal map shows the response of anomalous bodies from their upper portions, it is very help full to visualize the near surface conditions. Furthermore the analytic signal map shows maximum contrast over magnetic contacts. Accordingly, there are three distinct and aligned weak zones in the surveyed area. As indicated on the map one of the weak zones which passes along the eastern side is nearly N-S oriented whereas the other two are with orientation of NW-SE at specific locations of northeast and southwest part of the area.
A joint geophysical investigation for engineering site characterization of a foundation construction site at Samara University has been conducted. The methods employed included electrical resistivity tomography, vertical electrical sounding and total field magnetic surveys. Different maps, models and curves including inverted 2D inverted model resistivity section maps, apparent resistivity slicestacked depth map, interpreted parameters of vertical electrical sounding curves, magnetic anomaly map, analytical signal map and magnetic anomaly profile plots were developed using different mapping and interpretation software from the resistivity and magnetic data. Interpretation of the imaging data that shows variation in subsurface resistivity stratification observed on the 2D inverse models is done using supporting information obtained from lithological well logging data and by correlating the models with magnetic anomaly profile plots.
Accordingly, the study area is interpreted to comprise of three subsurface layers in which the first layer is a top soil horizon composed of sand and sandy silt. This layer is found to be thick in the western part of the area with its thickness gradually decreasing going east. Similarly the thickness of this layer is seen to decrease from south to north ranging from six meter in the south to about two meters in the north.
The second layer which is interpreted as vesicular basaltic horizon has considerable thickness in the western part. This layer extends to a depth ranging from 25 m in the south to 37 m in the north side with decreasing thickness from north to south like that of the first layer. The third layer, the weathered basalt and clay, is a layer with very low resistivity and depth to its top surface ranging from 25 m in the east to 37 m in the west.
Moreover, it was possible to outline the areas with high magnetic contrasts which indicated the presence of basaltic high magnetic material at shallower depth and associated with the presence of weak zones. Three major structures have been located within the construction site that could be worth considering during design and construction of large structures. The orientation of the two structures is nearly NW-SE whereas the other is oriented almost N-S. Considering the current location of the major built infrastructures, these structures are seen to potentially cross two or more buildings. Especially the N-S trending structure mapped at eastern side of the study area is expected to be the continuation of the open structure suited on northern side of the university compound. The area being tectonically and seismically active, great attention has to be taken during geo-hazard on the building which are aligned through it. Moreover, safe design should be made for future contractions.
Based on the interpretations made in this study, the second layer is best for foundation with some enhancements in design to prevent problems associated with the weak zones. From all the results of the applied geophysical methods in this work future large buildings are proposed to be concentrated on the northern and northwestern part of the study area. Finally excavation of weak material particularly in the southern part must proceed as much as possible and up to 11 m depth.
Citation: Atsbahaa S, Gebrub H, Haileb T, Legessec A (2019) Joint Application of Geophysical Techniques for Engineering Site Characterization of Samara University Area, Ethiopia, J Geol Geophys 8:467. doi: 10.35248/2381-8719.10.8.467
Received: 12-Sep-2019 Accepted: 31-Oct-2019 Published: 06-Nov-2019
Copyright: © 2019 Atsbahaa S, et al. This is an open-access article distributed under the terms of the Creative Commons Attribution License, which permits unrestricted use, distribution, and reproduction in any medium, provided the original author and source are credited.