Journal of Thyroid Disorders & Therapy
Open Access
ISSN: 2167-7948
ISSN: 2167-7948
Research Article - (2015) Volume 4, Issue 1
Iodine deficiency disorders are among the most significant public health problems in the world at the present time, especially among children and pregnant women, considered the highest risk population. These disorders hinder socio-economic development in the affected areas. IDD are a permanent natural occurrence that affects the entire planet, which means that the people living in iodine-deficient areas will always be exposed to the consequences of that deficiency, in particular increased perinatal mortality, mental retardation and brain developmental delay. Consequently, it is the major cause of preventable brain damage in childhood, and its elimination is one of the biggest challenges in public health. Iodine is present in small amounts in the body and its main role is to act as the substrate for thyroid hormone synthesis. When dietary requirements are not met, the frequency of IDD increases. In general, these disorders are underdiagnosed and, in many countries, there is no awareness of the associated problems or of the iodine status in the population.
Methods: Accurate methodological review of the medical literature included in the MEDLINE database using the MeSH terms “iodine”, “disorders”, “iodide”, “deficiency”, combined with the logical operators “AND”, “OR” and “NOT” and the “also try” characteristic of data published in “any date”, limiting the search to results including the link with abstracts and full text, exclusively in humans and regardless of gender. For the preliminary evaluation, the following types of studies were selected: clinical trials, meta-analyses, randomized controlled trials, clinical practice guidelines, and review articles. The search was limited to papers published in English, and related to the population between 0 and 18, and adults 19 and over, from January 1974 to November 2014.
<Keywords: Iodine; Deficiency; Hypothyroidism; Hyperthyroidism; Goiter, Thyroid hormones, Ioduria; Salt
Iodine deficiency is a public health problem in 54 countries, occurring equally in marginal economies as well as in industrialized regions of the world. Close to 2 billion people are at risk globally as a result of the low intake of this halogenated trace element, including one third of school-age children. A minor iodine deficiency still prevails approximately in 50% of continental Europe, and the problem has reappeared in industrialized countries like the United States (US) and Australia. In the US, although the general population is iodine-“sufficient”, it is not clear whether iodine intake during pregnancy is appropriate; and in other geographical areas such as Australia, deficiency has increased as a result of a lower use of iodophors in the food industry (an iodophor is defined as an iodine complex with non-ionic tension active agents that act as iodine transporters and solubilizers in water; additionally, iodophors are capable of increasing iodine’s bactericidal activity). This lower industrial use of iodophors may also explain –at least in part– minor iodine deficiencies in the United Kingdom and the Republic of Ireland. In marginal economies such as southern Asia and Sub-Saharan Africa, the problem is greater. The lowest frequency is found in the Americas. The most vulnerable groups are pregnant mothers and children, and the consequences of the lack of iodine during brain development in utero were the trigger that led the International Public Health Community, with the support from United Nations (UN) agencies, particularly the World Health Organization (WHO) and the United Nations Children’s Fund (UNICEF), to adopt sustainable iodine deficiency elimination as a goal. Iodine is an essential element that cannot be synthetized by the body; therefore, food products such as fish and shellfish are the sole source available. Food iodine content depends on the amount of iodine in the soil, and soil degradation as a result of erosion, excess cattle grazing and cutting of trees is associated with significant losses of this trace element. Consequently, food grown in degraded soils has alow iodine content [1,2]. The term Iodine Deficiency Disorders (IDD) is used to define a group of diseases resulting from a relative loss of iodine in the diet, including multiple defects. For example, iodine deficiency during the peripartum period is associated with a higher rate of miscarriages, perinatal mortality and congenital malformations; in the newborn, it is associated with low birth weight, neonatal goiter and cretinism; in children, it is associated with mental retardation, deafness, failure to grow and develop, goiter, motor abnormalities and hypothyroidism; in the adult, the deficiency is associated with an increased rate of goiter, hypothyroidism, diminished working ability and productivity, and cognitive impairment. Latent at any age is also the risk of an increased thyroid susceptibility to nuclear radiation. The definition also encompasses the concept that those disorders are preventable by means of an adequate iodine intake [3,4].
In an analysis of data collected in 2003, the WHO estimated that the Americas and Western Pacific had the lowest proportion of people with insufficient iodine intake (9.8% and 24%, respectively). In the other WHO regions, the figures were 56.9% for Europe; 54.1% for Eastern Mediterranean; 42.6% for Africa; and 39.8% for Southeast Asia [3,4]. Between 1990 and 2003, the proportion of households using iodized salt increased from 10% to 66%. As a result, the WHO estimated that the number of countries where iodine deficiency disorders were a public health problem had dropped from 110 to 54; and later it dropped from 54 to 30. On the other hand, the number of “iodine-sufficient” countries increased from 67 to 112. In 2006, 15 countries had reached the goal of sustainable elimination of iodine deficiency disorders. The prevalence of iodine deficiency was published in 2008 on the basis of the world population estimated for 2006 –without including data from countries such as the US and Western Europe (Table 1) for the general population–using iodine urinary excretion (ioduria) <100 µg/L as the criterion. The highest prevalence was found in Europe (52%), followed by Eastern Mediterranean (47.2%) and Africa (41.5%), taking into consideration that iodine deficiency in school-age children in countries like Ethiopia is unacceptably high. The lowest prevalencewas found in Southeast Asia, Western Pacific and the Americas–30%, 21,2% and 11%, respectively– [5,6]. Despite efforts to achieve universal salt iodization, there are still areas where results are conflicting–in some cases there is improved reduction of IDD and in others there are signs of inadequate performance of the iodization programs– [7-10].
| WHO regions (193 member states) | General population | School age children | Households with access to iodized salt (%) not including Western Europe or the UN |
|---|---|---|---|
| Africa | 312.9 (41.5%) | 57.7 (40,8%) | 66.6% |
| Americas | 98.6 (11%) | 11.6 (10,6%) | 86.8% |
| Eastern Mediterranean | 259.3 (47,2%) | 43.3 (48,8%) | 47.3% |
| Europe | 459.7 (52%) | 38.7 (52,4%) | 49.2% |
| Southeast Asia | 503.6 (30%) | 73.1 (30,3%) | 61% |
| Western Pacific | 374.7 (21,2%) | 41.6 (22,7%) | 89.5% |
| Total | 2000 (30.6%) | 263.7 (31,5%) | 70% |
Table 1: Prevalence of iodine deficiency in numbers (millions) and percentages, in the general population (all age groups) and in school children (6-12 years) for 2007. The percentage of households with access to iodized salt is also shown.
On the other hand, iodine intake is more than adequate and even too high in at least 34 countries globally. Over the past decade, the number of countries with excess iodine intake increased from 5 to 10 as a result of very high levels of salt iodization or poor monitoring and follow-up of the iodization programs, creating the risk of hyperthyroidism and autoimmune thyroid disease. These points to the fact that even minor changes in iodine intake (above or below the normal population reference range) in the different geographical regions are associated with marked differences in the frequency of thyroid disorders. It has even been found that primary elimination of IDD achieved in some regions may be accompanied by “overiodization” of salt, resulting in a substantial increase in ioduria, and highlighting the need for permanent monitoring of all IDD prevention programs. In summary; currently, 111 countries have adequate iodine dietary intake; of these, thirty remain iodine-deficient, nine are moderately deficient, twenty-one are mildly deficient, and none are currently considered severely iodine-deficient. Ten countries have excess iodine intake [10-13].
Considering that every type of health intervention requires monitoring to ensure that it works as planned, and that there is a need to have all the available information required to take the necessary corrective actions to ensure goals and objectives are achieved, it is clear that salt iodization programs, like any other health intervention, behooves an effective monitoring and evaluation system. Based on this concept, the WHO, together with UNICEF and the International Council for the Control of Iodine Deficiency Disorders (ICCIDD) have proposed some questions that need to be answered when it comes to evaluating different measurements in IDD [14-16]. These questions are:
• Does all salt produced locally or imported meet iodization requirements for the country?
• Is there access to adequately iodized salt in those countries that are at risk of iodine deficiency, and is it used in those populations?
• Is there a group in the population that requires attention because it has no access to iodized salt?
• What is the impact of salt iodization and of other additional interventions on the iodine status of the population?
• What is the relative contribution of iodine intake from various sources?
In some countries, where information and programs related to IDD have not been implemented yet, the questions to be asked include the following:
• Have IDD as a public health problem been eliminated?
• What is the prevalence of IDD among specific population groups (pregnant women and children) based on geographic, administrative of physiological criteria?
• What are the steps required to guide actions on IDD, such as an analysis of the situation of salt?
Iodine deficiency emerges when iodine intake is below the recommended levels. The term IDD refers to the consequences of iodine deficiency in a population, and which may be prevented by ensuring adequate intake [14,15]. WHO-UNICEF-ICCIDD recommends an adequate daily intake of iodine aimed at reducing IDD in the population to the largest extent (Table 2). For the USA and Canada, the Institute of Medicine established Dietary Reference Intakes (DRI) for iodine, and specifically an Adequate Intake (AI) for infants, which is defined as a recommended daily intake level that is expected to meet or exceed the requirement in essentially all individuals of a specific life-stage and sex group.
| WHO-UNICEF-ICCIDD (RNI) (µg/d) |
USA Institute of Medicine |
Tolerable Upper Intake Levels for iodine (µg/d) |
|||||
| Children 0-59 months | 90 | Life Stage Group | EAR (µg/d) | AI or RDA (µg/d) | Age Group* |
USA Institute of Medicine |
ECSC ** |
| Children 6-12 y |
120 | Infants aged 0–12 months | ̶ | 110-130 | 1-3 | 200 | 200 |
| >12 y and adults | 150 | Children aged 1–8 y | 65 | 90 | 4-6 | 300 | 250 |
| Pregnancy and lactation | 250 | Children aged 9–13 y | 73 | 120 | 7-10 | 600 | 300 |
| *Age categories in parenthesis are for the Tolerable Upper Intake Level defined by the US Institute of Medicine. ** ECSC: European Commission/Scientific Committee on Food. |
Adults aged ≥14 y | 95 | 150 | 11-14 | ̶ | 450 | |
| Pregnancy | 160 | 220 | 15-17 and (14-18) y | 900 | 500 | ||
| Lactation | 200 | 290 | Adults, pregnant and lactating women | 1100 | 600 | ||
Table 2: Recommendations for iodine intake by age or life-stage group and tolerable upper intake levels for iodine.
Estimated Average Requirement (EAR) which is defined as the average daily dietary intake level estimated to meet the requirement of half of healthy individuals in a particular life-stage and sex group; and the Recommended Dietary Allowance (RDA) which is defined as the average daily intake level sufficient to meet the requirements of nearly all (97-98%) healthy individuals in a particular life-stage and sex group for children, adolescents, and adults. The WHO established Recommended Nutrient Intakes (RNI) that cover the needs of nearly all healthy individuals in a specific life-stage group. On the other hand, programs focusing on universal salt iodization have increased the risk of overiodized salt. This has led to the recommendation of the Tolerable Upper Intake Levels for iodine, bearing in mind that some populations with profound iodine deficiencies may respond adversely to intakes far below recommended levels [15,16].
Disorders caused either by iodine deficiency or excess intake (measured using median ioduria or ioduria concentrations) occur in ranges between <100 µg/L (insufficiency) and more than 300 µg/L (excess). The epidemiological criteria for the evaluation of iodine nutrition in a population –based on median ioduria and ioduria concentration (or both)– are shown in Table 3 [17].
| Iodine intake | Dietary iodine contribution | |
|---|---|---|
| School-age children | ||
| <20 µg/L | Insufficient | Severe deficiency |
| 20-49 µg/L | Insufficient | Moderate deficiency |
| 50-99 µg/L | Insufficient | Mild deficiency |
| 100-199 µg/L | Adequate | Optimal |
| 200-299 µg/L | More than adequate | Risk of iodine-induced hyperthyroidism in susceptible groups |
| >300 µg/L | Excess | Risk of harmful consequences for health (hyperthyroidism, autoimmune thyroid disease) |
| Pregnant women | ||
| <150 µg/L | Insufficient | - |
| 150-249 µg/L | Adequate | - |
| 250-499 µg/L | More than adequate | - |
| ≥500 µg/L | Excess* | - |
| Breastfeeding women** | ||
| <100 µg/L | Insufficient | - |
| ≥100 µg/L | Adequate | - |
| Children< 2 years of age | ||
| <100 µg/L | Insufficient | - |
| ≥100 µg/L | Adequate | - |
| There is no information on dietary iodine contribution in pregnant and breastfeeding women in the UN evaluation table. *The termexcess means that it exceeds the amount required to prevent and control iodine deficiency. **In breastfeeding women, median ioduria numbers are lower than iodine requirements due to iodine excretion in breast milk. | ||
Table 3: Epidemiological criteria for dietary iodine contribution in a population, based on median ioduria or ioduria concentration ranges (or both).
The consequences of iodine deficiency on health and the community may be disastrous and irreversible. For the WHO, iodine deficiency is the primary preventable cause of brain injury –both in fetuses and infants– as well as of delayed psychomotor development in children; however, consequences reach beyond brain disorders, as shown in Table 4 [18,19].
| •All ages:Goiter (even nodular hyperthyroid disease); hypothyroidism in areas with moderate-to-severe deficiency; lower presence of hypothyroidism in areas with mild-to-moderate deficiency; hyperavidity of the thyroid for iodide (which increases the risk of thyroid irradiation in the event of a nuclear accident). |
| •In-utero and perinatal state: Miscarriages, increased risk of fetal death, congenital abnormalities, increased perinatal mortality. |
| •Neonates:Endemic cretinism, increased risk of infant mortality. |
| •Children and adolescents: Growth delay, reduced intellectual and mental abilities. |
| •Adults:Diminished intellectual and mental abilities, hypothyroidism, apathy, significant reduction of working capacity and productivity leading to poor social and economic development. |
Table 4: Consequences of iodine deficiency for health.
WHO-UNICEF-ICCIDD describes several indicators used for monitoring and assessing IDD control programs; these indicators are divided into three main categories [14,20,21].
Process indicators
These are the indicators used for monitoring and assessing salt iodization processes. They reflect the monitoring of iodine content in the salt at the production/import site and in households. In some cases, levels are also assessed when required in retail or wholesale operations.
Impact indicators
These indicators assess iodine status and are used for monitoring and evaluating the impact of salt iodization on the population (using, for example, ioduria or goiter determination by means of palpation or ultrasound).
Sustainability indicators
These indicators are used to determine whether iodine deficiency has been eliminated successfully, and assess whether the elimination may be sustained and maintained over coming decades. This determines the need to measure median ioduria in the population, the possibility of adequately iodizing salt for household use, as well as other indicators that yield evidence of sustainability.
Iodine is present on the surface of the earthin very small amounts and it is known as a trace element. As a non-metallic element, its atomic number is 53, it belongs under group 17 in the periodic table with a relative massof 126.904, and it is considered the heaviest among halogensfound in nature. Under normal conditions, it is found in the form of a black, volatile, shiny solid. The chemistry of iodine, as that of other halogens, is dominated by the ease with which the atom acquires an electron to form the iodide ion (I-) or a single covalent bond, and the formation, with more electronegative elements, of compounds in which the formal iodine oxidation state is +1, +3, +5 or +7; however, like the rest of halogens, it may form a large number of compounds with other elements although it is in fact the least reactive of the whole group. Iodine is more electropositive than other halogens, and its properties are modulated by a) the relative weakness of the covalent bonds between iodine and more electropositive elements; b) the large-size iodine atom and iodide ion, which reduces enthalpies in the crystalline network and iodide dissolution and increases the importance of van der Waals forces; and c) the relative ease of iodine oxidation. Despite the low concentration of iodine in seawater, some algae species may extract and accumulate this element. In the form of calcium iodate, iodine is found in saltpeter beds in Chile, and it is also found as iodide ion in some oil well brines in California, Michigan and Japan. Iodine may be obtained from iodides found in seawater and some algae, or in the form of iodates from niter. Iodine exists in the form of diatomic molecules (I2) in solid, liquid and vapor phases, although dissociation for atom formation is quite significant at high temperatures (>200ºC). Although it is less strong in its reactions with other halogens (halogenides), iodine combines directly with most of the elements, important exceptions being noble gases, carbon, nitrogen and some noble metals [22,23].
Close to 95% of the crust of the earth is made of igneous rocks that form when magma (molten rock) cools and solidifies. Those rocks contain a definite amount of iodine –approximately 500 µg per kilogram of dry material (considering that these rocks consist mainly of silicates and are covered by a fine layer of sedimentary and metamorphic rocks)–Soils derived from igneous rocks contain substantial amounts of iodine, as is to be expected. Once the rocks have formed from molten magma that rises to the surface, they may go through different transformation processes. On the one hand, they may be turned to dust by erosion, or their fragments may give rise to sedimentary rocks. On the other hand, they may sink or never rise to the surface, and become transformed by heat and pressure, giving rise to metamorphic rocks. The two types of rocks and the soils they give rise to contain varying amounts of iodine. The planet that we know today looks very different from what it was like shortly after its birth. At that time, it was a huge clump of molten rock; eventually, the crust cooled and turned solid. Water pooled in the lower areas and a layer of gas began to form above the surface. In the meantime, lava leaked abundantly though multiple cracks in the crust and this volcanic activity released a huge amount of gas that ended up forming a layer above the surface. Oxygen and hydrogen produced water vapor during the eruptions; as water vapor rose through the atmosphere, it condensed, giving rise to the primordial rainfall. As the first rains fell on the planet, they pushed iodine into the sea, hence its substantial concentration in seawater [21-23]. Certain marine plants and animals have developed mechanisms that enable them to concentrate large amounts of iodine in their tissues and when they die and fall to the bottom of the sea, iodine becomes part of the sediment and the sedimentary rocks that may form later on. Part of the iodine contained in seawater evaporates and rises to the atmosphere, probably attached to dust particles. When water vapor forms clouds and then falls in the form of rain or snow, the latter also contain iodine, completing the entire circulation cycle [24,25]. Seawater has the highest iodine concentration – close to 58 µg/l, iodate (IO3) being the most stable form which is reduced to iodide in the water surface through the biological activity mediated by algae and phytoplankton, both of which release iodine-containing organic gases (especially methyl iodide [CH3I] and diiodomethane [CH2I2]) that rise to the atmosphere and undergo chemical changes under the action of sunlight (Figure 1). In the atmosphere, iodine migrates to other parts of the earth and is deposited by wet or dry precipitation, dependingon climatic and topographic conditions; as a result, areas near coastal regions tend to have a more iodine-rich environment. For example, soils within 0-50 km from the sea have a higher –though variable– level of iodine when compared with those found far from the sea. Iodine may become “revolatilized” from the soil and the plants, probably due to biological conversion to organic forms, allowing it to travel far from the coasts until it precipitates down to the earth again. Although organic matter plays an important role in fixing iodine in the soil, in areas known to be rich in organic matter soils with a high iodine content are not a good source of this trace element for the food chain because of strong binding of iodine to the soil, precluding its bioavailability. This means that any consideration regarding iodine status in the population and its relationship with the environment must be evaluated in accordance with the bioavailability and not on the basis of the total iodine content. Water surfaces may be the best indicator of iodine status in the environment, considering that they represent its bioavailability (Figure 2). It is suggested that a level below 3 µg/L defines iodine deficiency [23-25].
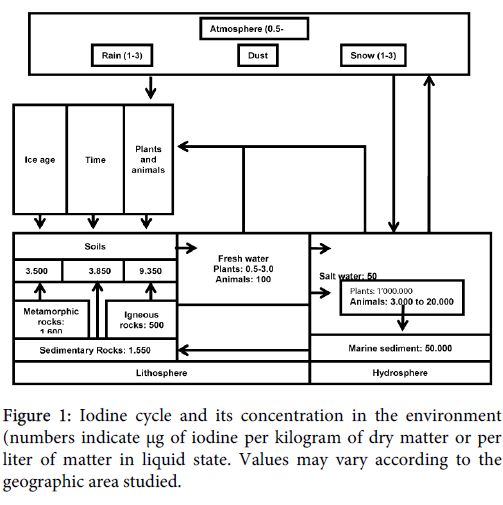
Figure 1: Iodine cycle and its concentration in the environment (numbers indicate μg of iodine per kilogram of dry matter or per liter of matter in liquid state. Values may vary according to the geographic area studied.
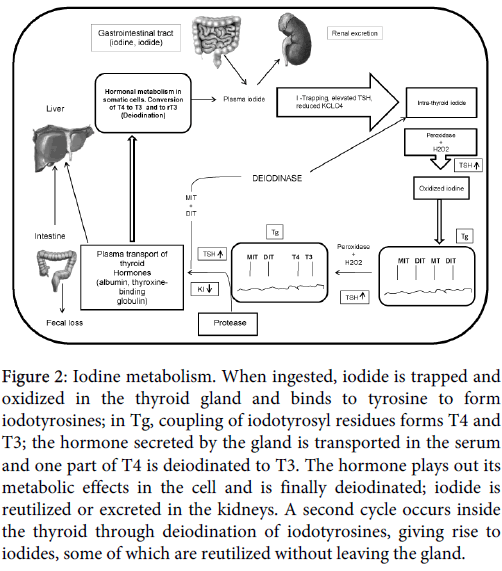
Figure 2: Iodine metabolism. When ingested, iodide is trapped and oxidized in the thyroid gland and binds to tyrosine to form iodotyrosines; in Tg, coupling of iodotyrosyl residues forms T4 and T3; the hormone secreted by the gland is transported in the serum and one part of T4 is deiodinated to T3. The hormone plays out its metabolic effects in the cell and is finally deiodinated; iodide is reutilized or excreted in the kidneys. A second cycle occurs inside the thyroid through deiodination of iodotyrosines, giving rise to iodides, some of which are reutilized without leaving the gland.
Iodine sources from the diet may vary broadly. Certain food sources are associated with various effects on iodine metabolism in the population. Generally, foods with a high content of iodine include iodized salt, eggs, seafood and some baked products. Universal restrictions regarding salt intake (as a way to prevent and manage diseases like blood hypertension) have been associated with iodine deficiency, particularly in women; and the growing consumption of soy products that may contain isoflavones (genestein and daidzein) may be associated with iodine deficiency and hypothyroidism, the most plausible explanation being that isoflavones inhibit thyroid peroxidase (TPO). Perchlorate content in food and its intake may affect the SymporterNa/I (SNI) in the thyroid gland and reduce active intra-thyroid iodine transport, leading to hypothyroidism [26,27]. Thiocyanates are mainly the result of the reaction of free cyanide with sulfur. Like perchlorate, these compounds may reduce active intrathyroid iodine transport through SNI involvement. Thiocyanate is the main product that forms when cyanide enters the body, and it is the way the body gets rid of cyanide. Thiocyanates are found in water, mainly due to discharges from coal processing, gold and silver extraction, and mining. Thiocyanates in the soil come from the direct application of herbicides, pesticides and rodenticides, and the disposal of industrial by-products. Some vegetables like cabbage, cauliflower and Brussels sprouts are part of a large genus called Brassica which, apart from their high content of diet fiber and vitamins, also contain detectable levels of thiocyanates. In individuals that eat large amounts of these vegetables, this might lead to an increased vulnerability to iodine deficiency and hypothyroidism [26]. Most foods and beverages for human consumption have a low iodine concentration; foods of marine origin have the highest content, due to their higher concentration capacity. In general, iodine concentrations in frequently consumed foods are highly variable (3 to 80 µg per serving). In the mid 90’s in the US, mean iodine intake was estimated at 190-210 µg/day for women, the most abundant sources being milk and bread. The situation is similar in other countries like Switzerland where the mean iodine intake measured directly from food is 140 µg/day. Other food sources of iodine are shown in Table 5. It is important to bear in mind that some iodophors and fertilizers may modify iodine content in food. In countries like Japan, iodine intake from food is among the highest in the world, most probably because of the high consumption of algae in the diet. It is estimated that the daily iodine intake in this population ranges between 5.280 and 13.800 µg, 5 to 14 times higher than the upper safety limit of 1mg for the United States. In Japanese women, this high iodine intake is associated with low rates of goiter, autoimmune thyroid disease, breast cystic disease, or breast cancer [28,29]. Some additional sources of iodine are iodized contrast media, water purification tablets and medications such as multivitamins, anti-arrhythmics like amiodarone (that contains close to 75 mg in each 200 mg tablet), topical disinfectants like povidone (10 mg/mL), and Lugol solution, with a content of 6 mg of iodine for every drop, and saturated potassium iodide solution which contains 38 mg of iodine per drop.
| Foods | Iodine content |
|---|---|
| Red mullet (150 g) | 150 |
| Salmon (150 g) | 60 |
| Clams, cockles and bi-valve mollusks in general | 120 |
| Fresh fish (150 g) | 45 |
| Allioids (garlic) | 94 |
| Crustaceans such as shrimp, prawns and scampi | 90 |
| Perciform fish (grouper) | 52 |
| Tuna, bonito, sardines in oil (100 g) | 37 |
| Lobsters and decapode crustaceans like king crabs | 40 |
| Green beans, chards | 35 |
| Pineapple (150 g) | 45 |
| Eggs | 20 |
| Herbaceous plants like onions | 20 |
| Edible mushrooms | 18 |
| Pleuronectiform or flat fish (sole) | 17 |
| Fabaceous plants like dry faba beans and peanuts | 14 |
| Cow’s milk | 9 |
| Carrot-type vegetables | 9 |
| Solanaceous plants (tomatoes) | 7 |
| Prunes | 7 |
| Spanish ham (20 g) | 2.2 |
| Lean pork | 5.2 |
| Lettuce | 5 |
| Yogurt | 3.8 |
| Potatoes | 3 |
| Whole rice (80 g) | 18 |
| Lime | 3 |
Table 5: Iodine content in some foods, in μg for every 100 gof the product (content may vary according to the geographical area and the content of iodine in the soil.
Iodine, as a component of thyroid hormones, accounts for 65% and 58% of the weight of T4 and T3, respectively. When ingested, iodine is absorbed through the small intestine and transported in plasma to the thyroid where it is concentrated, oxidized and incorporated into thyroglobulin (Tg) to form monoiodotyronine (MIT) and diiodotyronine (DIT), and then gives rise to T3 and T4 formation. Of the total iodine used by the body, 96-99% is metabolized in the thyroid gland, while the rest is used by other organs or systems like the retina and the choroid plexus. The thyroid and the kidneys remove most of the iodine from plasma, regardless of the amount of iodine or other anions present [30,31]. Renal clearance of iodine depends mainly on the glomerular filtration rate, with no evidence of a tubular secretion mechanism or phenomenon, or of active transport. Reuptake is partial and passive, hypothyroidism may impact renal clearance, and hyperthyroid states increase. Using a mean value of iodine intake in the diet of 150 µg/day, the thyroid clears serum iodine at an average rate of approximately 17 mL per minute, but rates could be as high as 100 mL/min in iodine deficient areas. A normal thyroid gland maintains a free iodine concentration 20-50 times higher than plasma levels–depending on the amount of iodine available and gland activity–, the concentration gradient may be greater than 100:1 in primary hyperthyroidism. SNI mediates iodine transport to the inside of follicular cells in what is considered the first step in thyroid hormone biosynthesis. This active sodium-dependent process constitutes an iodine transport vector from the bloodstream to the thyroid colloid [32-34]. In sum, ingested iodine is absorbed and transported in the circulation in the form of “iodide” which is concentrated by the thyroid in the lateral basal membrane of thyrocytes with the help of SNI; intra-cellular iodide is transported to the lumen of thyroid follicles, while proteins like thyroid peroxidase (TPO) and Tg are synthetized. In the latter, tyrosyl residues act as a substrate for iodination and T3 and T4 formation. TPO settles into the apical plasma membrane where it stimulates iodide oxidation and hands over iodine to tyrosyl in Tg. Tg iodination produces MIT and DIT and, later, iodination couples to DIT residues to produce T4. When a certain amount of thyroid hormone is required, Tg is internalized in the thyrocyte apical pool and undergoes a protease-mediated digestion process. After digestion, T4 and T3 are released into the bloodstream [35-38].
There are four generally accepted and recommended methods for assessing the nutritional aspects of iodine in a population: urine iodine concentration, goiter rates, Tg levels, and thyroid stimulating hormone (THS) levels. These measurements are not exclusive but complementary since ioduria is a sensitive indicator of recent iodine intake (days), while Tg levels show iodine status in the population (over weeks to months), and changes in goiter rates show long-term iodine nutritional status in a population (over months and years).
Ioduria
Essentially 90% of the total iodine content absorbed is cleared through the urine. This is why measuring this trace element in urine is considered a way to assess recent intake, although concentrations may vary from day to day and even throughout the same day. Iodine urine concentration may be expressed in µg/L, or in relation with creatinine (µg/g creatinine), or also as 24 hour urine concentration (µg/day). Considering that 24-hour urine is impractical in population studies, it is usually recommended to measure ioduria in a urine sample taken either in the morning or at random (0,5-1 mL) in a specific group, and it is expressed as median ioduria in µg/L. Although median ioduria does not reflect thyroid function, it is clear that a low urine concentration points to an increased risk of suffering thyroid disorders [25,39]. Creatinine and creatinuria are not taken into consideration in the vast majority of studies designed to determine iodine status in a population, given that creatinine concentration is low in those regions with a significant frequency of malnutrition. Ioduria may be used to extrapolate daily iodine intake in the population using the estimated 24-hour mean urinary volume and assuming an average iodine bioavailability of 92% on the basis of the following formula:
Daily iodine intake =urinary iodine (µg/L) × 0.0235 × body weight (Kg)
Using this formula, a median ioduria of 100 µg/L would correlate with an average mean intake of 150 µg. Several methods for measuring ioduria have been described; however, these methods are not universally available. The method most widely available is “Method A” which uses ammonium persulfate and requires the use of spectrophotometry. The second is “Method B” which uses chloric acid, although it has the drawback of explosion risk during the test. There are other tests, but Method A is preferred in population studies, followed by Method B [16,27,39].
Thyroid Volume
There are two methods for assessing thyroid volume: physical inspection and palpation, and thyroid ultrasound. On palpation, goiter is considered to be present when each lateral lobe is longer that the distal phalanx of the examiner’s thumb. According to the WHO classification system, grade 0 is non-palpable or visible thyroid gland; grade I is palpable but non-visible goiter with the neck in normal position; and grade II is evidently visible goiter with the neck in a the normal position. This is perhaps the most widely accepted classification because it is easy to use and interpret even in the hands of an inexperienced examiner. Goiter prevalence may be determined also with the use of thyroid ultrasound. In those areas with mild IDD, goiter prevalence may be low, hence the low diagnostic sensitivity and specificity of palpation alone [27,33,40]. Moreover, classification error may be as high as 40%, and in those situations ultrasound may be more reliable than palpation. However, there are few data comparing ultrasound with palpation in areas where IDD is more prevalent. In fact, thyroid ultrasound is considered to have lower accuracy in areas with severe IDD and, consequently, palpation is a better way to estimate goiter prevalence. In areas with moderate-to-severe IDD, goiter screening using palpation must be the option of choice because of ease of application, reproducibility and low cost [34,40]. Goiter rate in school children is an indicator of IDD severity in a specific population. A rate ≥5% in this age group is an indicator of a public health problem; thyroid volume interpretation requires validated reference ranges in children living in iodine “sufficient” areas. In 1997, the WHO together with ICCIDD proposed reference values for thyroid volume based on data of European children, but those reference values were much higher than they actually are. Thyroid volumes in other areas of the world (Switzerland, the United States, Malaysia) were shown to be much lower than those referenced in the European school population, although this could be explained on the basis of the residual effect from iodine deficiency prevailing in Europe in the early 1990s [33,39,40]. Later, thyroid volumes were measured in children between 6 and 12 years of age in areas that had been “sufficient” for a long time in Northand South America, Central Europe, Eastern Mediterranean, Western Pacific and Africa, and sites from the five continents were selected, including children from most ethnic majorities in the world. The sample consisted of 3.529 children, divided by age and gender; the median ioduria range was 118-288 µg/L among the 6 sites assessed. Significant differences were found in mean thyroid volume adjusted by age and body surface, suggesting that reference values for a specific population in countries with longstanding iodine “sufficiency” may be more accurate than an international reference standard. These reference values are recommended for goiter screening during IDD monitoring, and they are more conservative than those previously used, although it is clear that inter-observer variability with this method is high –up to 26%– [32-34,40-43]. In order to improve thyroid volume data reliability and comparability on ultrasound when monitoring for IDD, a standardized approach has to be adopted worldwide [33,41]. Thyroid volume is calculated by adding the volume of each lobe, and it does not include thyroid isthmus volume. The following formula is used to calculate the volume of each lobe:
Volume (mL) = 0.479 × D × w × 1 (cm)
Where D is depth and W is width.
For classification purposes, body surface calculation in IDD screening programs uses the Dubois and Dubois formula:
Body surface area (m2) = W0.425× H0.725× 71.84 × 10-4
Where W is weight and H is height.
In accordance with the ultrasound criteria, goiter is considered to be present when thyroid volume is above the 97th percentile of the volume found in an area where the population is iodine “replete”[16,32,33]. Table 6 shows the reference values for the 97th percentile of the thyroid volume as a function of age and body surface area.
| Boys | Girls | Boys | Girls | ||
|---|---|---|---|---|---|
| Age | 97th P | 97th P | Body surface area (m2) | 97th P | 97th P |
| 6 | 2.91 | 2.84 | 0.7 | 2.62 | 2.56 |
| 7 | 3.29 | 3.26 | 0.8 | 2.95 | 2.91 |
| 8 | 3.71 | 3.76 | 0.9 | 3.32 | 3.32 |
| 9 | 4.19 | 4.32 | 1.0 | 3.73 | 3.79 |
| 10 | 4.73 | 4.98 | 1.1 | 4.2 | 4.32 |
| 11 | 5.34 | 5.73 | 1.2 | 4.73 | 4.92 |
| 12 | 6.03 | 6.59 | 1.3 | 5.32 | 5.61 |
| 1.4 | 5.98 | 6.4 | |||
| 1.5 | 6.73 | 7.29 | |||
| 1.6 | 7.57 | 8.32 |
Table 6: Specific 97th percentile for thyroid volume (mL) by age and body surface area, measured by ultrasound in iodine “sufficient” school children 6-12 years of age.
TSH
TSH is not a sensitive indicator for IDD either in school-age populations or in adults. However, in neonates, where iodine concentration is very low, iodine turnover is very high and this increased iodine turnover is exaggerated in iodine deficient areas. When it is present, an increase in TSH levels is required, explaining why in iodine deficient areas TSH rises far above normal in the first weeks of life, creating a state called “transient hyperthyrotropinemia” [14,40-43]. Therefore, TSH elevation in this age group is of great value for determining the severity of iodine deficiency in a given population.
Thyroglobulin
Tg is the most abundant thyroid protein; in areas with endemic goiter, the major determinants of serum Tg are thyroid cell mass and TSH stimulation. Studies that have examined Tg as a potential indicator of the effects of iodine supplementation in populations with IDD show that this protein drops rapidly with iodine supplementation and, consequently, it is considered a more sensitive indicator of iodine repletion than TSH itself. The international Tg range in whole blood samples of school-age populations is between 4-40 µg/L. Tg correlates very well with iodine deficiency severity determined by ioduria and, for this reason, Tg is now considered a promising biochemical indicator of thyroid function in school-age populations after the introduction and implementation of universal salt iodization programs. However, it must be complemented with the use of ioduria and thyroid volume, although it has not yet been adopted as a universal indicator for IDD [15,28,33].
The most effective way to control IDD is universal salt iodization, which refers to iodization of all salt used for human consumption (industrial and household use) and for cattle. This strategy is recommended because salt is used essentially in all foods and its intake is consistent throughout the year. Iodization is a simple, inexpensive technique, and does not affect salt color or flavor. The amount of iodine in the salt may be monitored in production, retail and in the home. The WHO/UNICEF/ICCIDD recommendation is to add iodine to the salt at a concentration of 20-40 mg of iodine per kilogram of salt. Iodine may be added in the form of potassium iodide or iodate; however, considering that potassium iodate is more stable than iodide when in contact with moisture and impurities, it is the recommended iodization form in tropical countries. Iodine is usually added once the salt has gone through a “drying” process. Bread may be a good vehicle for adjusting salt intake by introducing iodine-enriched salt in the baking process. Iodization of water and irrigation systems may also be useful, but this requires costly methods that limit its application. Countries like Switzerland and the United States have additional iodine sources through milk in the diet, more because of the use of iodophors in the food industry than the deliberate addition of iodine. In countries affected by IDD, it is considered that iodine must be added routinely to complementary foods in order to increase iodine content derived from daily intake [44-48].
In remote areas or areas of difficult access, or where small-scale salt producers exist, salt iodization programs may not work or create the expected social impact. In those situations, the recommendation is to replace iodine by means of iodized oils administered orally or intramuscularly. The oral route is easier, but the intramuscular route is more effective and has longer lasting effects. The oral dose ranges between 200 and 400 mg of iodine per year and it is usually administered to the most vulnerable population (pregnant women, children and women in childbearing age). Iodine may also be given in the form of potassium iodide or iodate drops or tablets; the monthly (30 mg) or biweekly (8 mg) dose of potassium iodide may be sufficient to provide the adequate amount of iodine, in particular to the population at risk [37,46].
In areas where the majority of the people are iodine “sufficient”, there is high tolerance to iodine intake. In general terms, the thyroid carries a pool of iodine and may regulate iodine uptake within a broad margin, allowing a specific level of thyroid hormone synthesis (in normal thyroids). In areas where dietary iodine intake is very high –e.g. Japan– adults may tolerate amounts greater than 1,000 µg/day; however, in children, amounts greater than 500 µg/day are associated with goiter [35-39]. If iodization programs are not appropriate or there is excess dietary salt consumption, the population will have a given risk of disorders due to excess iodine intake. The main consequence is iodine-induced hyperthyroidism, which usually occurs in people with endemic goiter due to iodine deficiencies supplemented with the trace element. This response is known as the Jod-Basedow effectand occurs only in a small proportion of the patients at risk [36-38]. The best documented experience was described in Tasmania, where a temporary increase in the diagnosis of thyrotoxicosis occurred shortly after the addition of small amounts of iodine to bread as the selected method selected for addressing iodine deficiency. The analysis of that population revealed two patterns of underlying thyroid dysfunction. The first pattern was the presence of nodular goiter with autonomous function areas, especially in elderly individuals, with no finding of TSH receptor antibodies. The second pattern occurred in the younger population in the form of diffuse goiter and the presence of TSH receptor antibodies, suggesting that the Jod-Basedow effect occurred only in thyroid glands where function was independent from TSH-mediated stimulation. However, iodine-induced hyperthyroidism is a metabolic disorder that is relatively frequent in areas with very high iodine intake; in fact, in those areas where iodine intake is marginal –although not iodine-deficient– moderate increases in iodine intake may induce hyperthyroidism in individuals with autonomous thyroid nodules. Consequently, clinicians must be aware of the risk of inducing hyperthyroidism when prescribing iodine-containing drugs –amiodarone, iodinated contrast media, etc. [39,40,48]. Iodine-induced hyperthyroidism may be confirmed by means of ioduria –which appears elevated– and also by means of thyroid scan with I-131 uptake, described in those instances as “hypo-avid”.
Iodine organification will depend on the excess amount of iodine provided in a process that exhibits a biphasic response to iodine excess: an initial phase of increased organification, and a second phase of reduced organification in response to a relative blockade of this phenomenon. This reduced iodine organification due to increased supplementation is known as the “Wolff-Chaikoff effect”, a TSH-independent self-regulated blockade based on an intracellular iodine molar concentration ≥10-3. Susceptibility to this phenomenon may be due either to iodine “trapping” mechanisms, as is the case in Graves-Basedow disease, or to the inability to form organic iodine, as is the case after giving radioactive iodine therapy or during thionamide treatment, or in patients with Hashimoto’s disease. Goiter or hypothyroidism may develop in those situations if iodine supply is maintained for long periods of time. The exact biochemical mechanism underlying the “Wolff-Chaikoff” effect is still unclear, but it could be explained on the basis of triiodide reaction:
I-+I2↔I-3
At high iodide concentrations, this reaction is displaced to the right due to mass action, trapping I2, considered to be an intermediary in iodine organification [41]. When moderate or high iodine doses are given repeatedly, organification and thyroid hormone formation inhibitionis partially corrected; this “escape” or “adaptation” mechanism occurs because iodine transport diminishes and thyroid iodine concentration is insufficient to maintain the complete “Wolff-Chaikoff” effect. This response is a manifestation of the thyroid self-regulated inhibition of iodine transport, preventing the development of hypothyroid goiter in the normal population [40,41]. On occasions, the “escape” or “adaptation” phenomenon does not occur, giving rise to the persistent inhibition of thyroid hormone formation, leading to hypothyroidism and goiter (myxedema). The “Wolff-Chaikoff” effect is short-lived because SNI biosynthesis comes quickly to a halt, intracellular iodine drops below the molar concentration of 10-3, and iodine organification resumes. This marked drop in SNI activity occurs through TSH-independent self-regulation [41,49-51].
Adequate iodine intake during pregnancy, breastfeeding and early childhood is extremely important for optimal brain development in utero and in infants 6-24 months of age. While the primary strategy for sustainable elimination of IDD continues to be universal salt iodization, international agencies have recommended the complementary strategy of providing iodine supplements on a temporal basis in those cases where iodization cannot be implemented. Consequently, salt iodization is the most sustainable approach to eliminating IDD in the long run, and iodine supplementation must be considered as a short-term measure, especially in those areas where salt iodization cannot be implemented promptly [14,52].
The following are topics that need to be considered by countries that are planning to implement an iodine supplementation program for IDD prevention:
Commitment of all political entities
Universal salt iodization is the most cost-effective strategy for IDD control and elimination, and political commitment to this form of intervention is critical.
Effective and efficient supplement management programs
Supplements need to be distributed monthly on a regular and timely basis.
Maintenance of continuing education and communication programs: Persuasion is an essential component of any national strategy for IDD elimination. Authors involved in healthcare must be trained and provided with the necessary knowledge regarding the programs.
Strong monitoring systems
Monitoring of nutrition status in relation to iodine is a way to ensure that results and achievements are used for appropriate decision-making; hence the need to share results with the general public.
Establishment of supplementation goals
Vulnerable groups must be the main targets for the intervention. These include pregnant women, breastfeeding mothers, and children under 2 years of age. In pregnant women, programs must be instituted as early as possible during gestation.
Additionally, there are 10 program indicators for sustainable IDD elimination [14,53]. Of these, at least eight must be met in order to consider that eradication objectives are being achieved.
1. Existence of a multi-stake holder coalition responsible for managing the national IDD elimination program, of the following characteristics:
• National scope.
• All stakeholders, including the salt industry, represented with their own roles and responsibilities.
• Call to action at least twice yearly.
2. Evidence of political commitment in the form of: Inclusion of IDD in the national budget
3. Adoption of legislation and regulation to support universal salt iodization that provides for a consistent mechanism to assure external quality.
4. Establish evaluation methods to measure progress in IDD elimination (program reports at a national level designed to assess progress every three years).
5. Access to laboratories with the ability to provide accurate data on iodine levels in soil and urine, and thyroid function tests.
6. Establish an education and social awareness program consisting of information about the importance of iodine and the use of iodized salt, provided as part of an education curriculum.
7. Consistent and routine availability of data on iodine content in salt, in the form of regular data coming from producers at least every month, and from households at least every 5 years.
8. Availability of population data regarding ioduria values, at least every five years.
9. Evidence of continuous cooperation from the salt industry, in the form of consistent quality control measurements and lowering of iodide and iodate costs.
10. Existence of a national database for registering the results of regular monitoring procedures, including coverage of household and ioduria levels, together with other iodine indicators in the population, and assessment of thyroid function, when available.
Impact of iodine supplementation in deficient populations:
A review of the evidence of the health consequences of mild iodine deficiency reveals that:
• There is a limited number of published studies investigating the health consequences of mild iodine deficiency.
• There is reasonable evidence of an association between mild iodine deficiency and sub-optimal neurological development, specially reduced Intelligence Quotient (IQ).
• Of the studies that have attempted to investigate the effects of mild iodine deficiency, many have limitations. Consequently, the current literature does not provide unequivocal evidence for significant health effects for populations with urinary iodine in the upper range of mild iodine deficiency.
• There is sufficient evidence to suggest that the known association between neurological outcomes and moderate and severe iodine deficiency is likely to extend to mild iodine deficiency; however, there is a suggestion of a dose response relationship with increasing effects on neurological development with higher iodine deficiency levels. Neurological effects associated with mild iodine deficiency include reduced IQ, increased auditory threshold and increased rates of attention-deficit hyperactivity disorder. Although the relation between iodine intake during pregnancy, thyroid function, and child neurodevelopment needs further evaluation, theevidence on the safety and effectiveness of iodine supplementation during pregnancy is needed before it is systematically recommended in iodine-sufficient or mildly deficient areas; this is due to various limitations in study design and analysis, including small sample size and possible attrition, lack of accommodation for intra-cluster correlation, and inattention to confounding variables.
• In constructing a reasonable health-based standard using the precautionary approach, it is clear that urinary iodine levels below 100 μg/L, which are in the mild iodine deficiency range, warrant intervention.
Iodine requirements are increased ≥50% during pregnancy, and iodine deficiency can cause maternal and fetal hypothyroidism and impair neurological development of the fetus. The consequences depend upon the timing and severity of the hypothyroidism; the most severe manifestation is cretinism. In moderate-to-severely iodine-deficient areas, controlled studies have demonstrated that iodine supplementation before or during early pregnancy eliminates new cases of cretinism, increases birthweight, reduces rates of perinatal and infant mortality and generally increases developmental scores in young children by 10-20%. Mild maternal iodine deficiency can cause thyroid dysfunction but whether it impairs cognitive and/or neurologic function in the offspring remains uncertain.
To date, measures to address iodine deficiency in populations with mild-to-moderate deficiencies have been shown to prevent (during gestation) increases in maternal thyroid volume and in Tg levels. On the other hand, the impact of iodine supplementation for the mother on the neurological development of the newborn is yet to be ascertained given the absence of clinical trials designed to evaluate those outcomes appropriately. In school-age children, iodine supplementation has been associated with modest benefits in terms of cognitive development; iodine supplementation has proven to be an effective method for reducing goiter rates and improving iodine status in this age group. Moreover, there is some indication of positive effects on the physical and mental development and on mortality, although the results of the studies have not always been statistically significant [54-57].
Recently, WHO proposed a guideline aims to help member states and their partners in their efforts to make informed decisions on the appropriate nutrition actions to achieve the Millennium Development Goals, in particular, reduction of child mortality and improvement of maternal health, that guideline provides global, evidence-informed recommendations on fortification of food-grade salt with iodine, for the prevention and control of iodine deficiency disorders, with the purpose of improving iodine nutrition and preventing iodine deficiency disorders in populations [58].
These recommendations recognize that:
• Salt reduction and salt iodization are compatible. Monitoring of sodium (salt) intake and iodine intake at country level is needed to adjust salt iodization over time as necessary, depending on observed salt intake in the population, to ensure that individuals consume sufficient iodine despite reduction of salt intake.
• The level of iodine fortification may need to be adjusted by national authorities responsible for the implementation and monitoring of universal salt iodization, in light of their own data regarding dietary salt intake.
• The national distribution of salt consumption must provide key guidance for the concentration of iodine in salt; sufficient iodine should be supplied to most members of the population, even those with the lowest salt intake, while at the same time preventing excessive iodine supply to those individuals whose salt intake remains high.
• Iodized salt should reach, and be used by, all members of the population after 1 year of age. Infants and young children are assumed to be covered via breast milk or iodine-enriched infant formula milk when this is prescribed. Addition of salt to products consumed by young children may need regulation, to avoid insufficient or excessive consumption of either sodium (salt) or iodine.
• Since pregnant women have a daily iodine requirement of 250 μg/d, other interventions such as iodine supplementation could be considered if iodine inadequacy is found. Intake of salt correlates with caloric intake, and pregnant women usually increase their energy intake during this physiological stage.
• Policies for salt iodization and reduction of salt to <5 grams/day are compatible, cost effective and of great public health benefit. Although salt is an appropriate vehicle for iodine fortification, iodization of salt should not justify promotion of salt intake to the public.
• Monitoring of food-grade salt quality is essential to ensure both efficacy and safety of the process of iodine fortification. Monitoring of urinary iodine excretion and urinary iodine concentration is useful not only to detect deficiency but also to detect excessive intakes and therefore prevent the health risks of iodine excess, by adjusting the level of iodine fortification accordingly, as part of a monitoring system. Countries should determine iodine losses from iodized salt under local conditions of production, climate, packaging and storage. For these reasons, iodine losses may be extremely variable and influence the additional amount of iodine that should be added at factory level.
• Fortification of salt with iodine should be appropriately regulated by governments and harmonized with other local or country programmes, to ensure that fortified food-grade salt is delivered safely within the acceptable dosage range. Particular attention should be given to identifying potential barriers to equitable access for all population groups needing iodine-fortified salt.
• Country programmes should be culturally appropriate to the target populations, so the intervention is accepted, adopted and sustained.
• Clear legislation should also be established for food producers and distributors; especially where the main source of dietary salt is processed foods and meals consumed outside households. Legislation should cover not only proper iodization of salt, but also the salt content of industrialized food products.
• Establishment of an efficient system for the ongoing and routine collection of relevant data, including measures of quality assurance and household use of iodized salt, and measures of programme performance, is critical to ensure programmes for iodized salt are effective and sustained.
• Regular monitoring and evaluation can identify barriers that may be limiting equal access to fortified salt and thus preserving health inequities. Sustained implementation and scale-up derive great benefit from appropriate monitoring mechanisms.
Although substantial progress has been made, iodine deficiency remains a significant public health problem worldwide, even in developed countries. Consequently, good quality population data on iodine status are required to assess population status and design strategies to correct deficiencies without introducing excessive intakes. If programs of iodine prophylaxis are carefully monitored for both iodine deficiency and excess, the relatively small risks of iodine excess are far outweighed by the substantial risks of iodine deficiency. In addition to monitoring iodine nutrition, effective surveillance systems should also include monitoring of iodized salt quality at all levels (industrial, retail, and household) to ensure that salt iodization programs are safe and effective in their control of iodine deficiency.