Journal of Ergonomics
Open Access
ISSN: 2165-7556
ISSN: 2165-7556
Research Article - (2017) Volume 7, Issue 4
A new application of laser shadowgraphy in automotive design and driver’s ergonomics investigation is described. The technique is based on generating a characterizing plot for the vehicle’s Field of View (FOV). This plot is obtained by projecting a high divergence laser beam from the driver’s eyes cyclopean point, on a cylindrical screen installed around the tested vehicle. The resultant shadow-gram is photographed on several shots by a narrow field camera to form a complete panoramic seen for the screen. The panorama is then printed as a plane sheet FOV plot. The obtained plot is used to measure and to analyse the areal visual field, the eye and nick movement ranges in correlation with FOV, the horizontal visual blind zones, the visual maximum vertical angle and other related ergonomic parameters. This work enable comparative FOV testing for many candidate cars to ease the evaluation of the automotive interior design from the ergonomics point of view, and helps car designers to enhance the preventive safety and ergonomics of their designs.
Keywords: Field of View (FOV); Ergonomics; Laser shadowgraphy
The investigation of automotive field of view Field of View (FOV) has recently become a crucial issue in the field of ergonomics and automotive design [1-4]. This correlation can be explained in light of the heavy competition in automotive market between cars of similar price and features. Hence, the criteria of differentiation must judge every design related discomfort, through standard procedures and reliable tests. Unfortunately, car manufacturers never supply their customers with FOV data in spite of its great importance in driving safety and comfort. In this work, we used laser shadowgraphy to design an efficient and sufficient FOV test, enabling the generation of a panoramic FOV plot that reduces all essential ergonomic parameters related to the driver’s visual kinetics. At first, we shall mention the basic methods for plotting automotive FOV, which are [5] photographic object sighting method, pole sighting method, light bulb method, and portable coordinate measurement apparatus method. In the first method, a photographic camera placed at the driver’s cyclopean eye position (top of the front seat of the tested car), is allowed to photograph both the direct and the indirect (through mirrors) FOV, to determine the missing zone of a specific gridded outer seen. The method depends strongly on the ability of the examiner’s eyes to compare between photos. This method is apparently not practical. In the second method, a driver is sighting a test pole around the tested car, in order to plot the blind zones in his FOV. This method also seems to be very exhausting. In the third method, a lamp placed at the driver’s cyclopean eye position is used to illuminate a test car interior, parked in the middle of a rectangular test shelter to allow white light projection of transparent areal field of the cabin on the gridded shelter walls. The described method easily enables the visualization of the blind field due to cabin body obscuration, on a box shape Cartesian screen around the tested car. The forth method is purely relying on geometrical optics, where a special optical probe is used to scan the car cabin in order to simulate the FOV. The later method is using fancy apparatus in combination with complex skeleton software, making such solution very expensive. Hence, we decided to take advantage from the simplicity of reverse ray based methods including light bulb method to design a laser based FOV plotting system having four mean features; the first, is its capability to generate a characteristic FOV plot for every tested car. The second feature is its capability to reduce driver’s ergonomic visual-muscular kinetics. The third feature is its ability to determine blind zone metrics and angles directly from the plot. The last feature is the possibility to diagnose the interior design drawbacks on FOV due to obscuration by seats, mirrors and other in-car components.
On light bulb technique, Haselgrave [6] was able to obtain a threedimensional shadow-graph for the car interior, projected on a gridded screen (Figure 1a). The shadowgraph metrics is reduced in Cartesian coordinates, where the origin is the driver’s cyclopean eye position (Figure 1b). This method was the first attempt for applying a reverse ray tracing technique to simulate driver’s FOV.

Figure 1: The light bulb method used by Hasselgrave. (a) Gridded screen shadowgraph for the car interior generated by light bulb illumination (b) Cartesian coordinates modelling.
Unfortunately, this method has many drawbacks where the most important are the absence of test field standardization, the difficulty to study indirect FOV through mirrors and the complicity of data analysis in Cartesian space. In a complimentary work, McIsaac and Bhise [7] used polar coordinates to simulate the driver’s FOV by generating polar plots used to analyse direct and indirect FOV by angular correlation. This type of simulation is possible by coordinate’s transformation of Cartesian data. However, the practical application of such plot may be obstructed by the complicity of mathematical analysis. In our work, we decide to use cylindrical coordinates as base of analysis instead of Cartesian, polar or spherical [1] frames and plots, in order to develop a more reliable test based on reverse ray method. In this test, the examined car is placed inside a circular test field equipped by a cylindrical wall screen with height L and radial span ρ. The screen is surrounding the car such that, the vertical line passing along the centre of the cylinder, intercepts the driver's eyes cyclopean centre (Figure 2a). We used a one-watt semiconductor green laser source with adjustable divergence, as a back lighting illuminator emitting from the same cyclopean centre. The divergence of the beam is trimmed to 2 Radian wide in order to simulate the human eye binocular field (Figure 2b) a laser shadow-gram representing the car interior is then projected on the screen. Unlike the method of light bulb point source illuminator, our shadow-gram has the ability to differentiate between the forward direct FOV (projected on the screen in front of the car) and the backward indirect FOV formed by mirrors reflections (Figure 2c).

Figure 2: Laser enhanced reverse ray method: (a) Cylindrical coordinate's method. (b) Cylindrical screen shadowgraph for the car interior generated by laser beam. (c) Illustration of the imaging setup.
Mathematical modelling
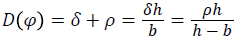
Let us consider the geometrical illustration of the direct FOV test shown in Figure 3, where the distance from the driver’s position to the end of the horizontal blind zone is obtained by triangular symmetries and given by the equation:

Figure 3: (a) Geometrical representation of the direct FOV. (b) Geometrical analysis of indirect FOV through rear view mirror.
 (1)
(1)
Where ρ is the radius of the circular test field, h is the vertical distance from the ground (road level) to the driver’s eyes; b is the distance from the ground to the lower laser shadow boundary as measured on the cylindrical screen at φ ranging from π/2 to 3π/2 passing by 0, and δ is the distance from the screen to an imaginary point ω representing the horizontal front blind zone boundary at road level.
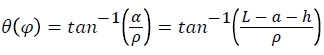
The driver’s maximum vertical sighting angle is given by the equation:
 (2)
(2)
Where (a) is the distance from the top of the cylindrical screen to the upper shadow boundary, α is the upper half of the illuminated segment and limited by cyclopean eye level. Similarly, by considering the case of indirect vision through rear view mirror (Figure 4), where the camera is oppositely aligned with the laser beam, there exists two optical centres representing the cyclopean centre o and the mirror centre o*.

Figure 4: Top view of the test field.
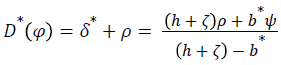
Hence, the rear blind distance is calculated by the equation:
 (3)
(3)
Where ζ is the vertical elevation of the rear mirror above the cyclopean eye level, and ψ is the horizontal separation between the rear view mirror and the cyclopean centre, b* is the distance from the ground to the lower laser shadow boundary as measured on the cylindrical screen at φ ranging from π/2 to 3π/2 passing by π, and δ is the distance from the screen to an imaginary point ω* representing the horizontal rear blind zone boundary at road level. Noting that equation 3 tends to be similar to equation 1 as ζ and ψ tends to be zero.
Graphical representation
If we consider the top view of the test field (Figure 4), where laser reflections and transmissions are represented by geometrical ray tracing, then, a group of about ten illumination zones appears to be projected on the screen. These zones represent all direct and indirect FOV possibilities.
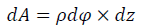
But we can illustrate the total seen on the cylindrical screen in 2 dimensional panoramic seen, if we imagine that we unwrapped the cylinder into a rectangle plan sheet. where the short side represents the screen’s height on the z axis and the long side represents the screen’s perimeter, related to the radiant angle φ by the equation of the area element dA in cylindrical coordinates such that:
 (4)
(4)
Hence, dz=L, ρ=Constant and φ=2π, then the rectangle’s sides are L and 2π ρ.
Therefore, we can devise the longer side into 360 divisions, representing the FOV sighting angle starting from φ=0 to φ=2π (the same point) beginning from the first left quarter of the rectangle. Then, will obtain an FOV cylindrical plot for the tested car (Figure 5). Moreover, a three appended linear color bars representing the prediction of driver’s direct, indirect and combined FOV. The color scale represents the eye, neck and body movements’ comfortdiscomfort [8,9]; correlated to the angular FOV as obtained from the standard visual and skeletal ergonomics, where the total binocular horizontal sighting angle of the human eyes [1] equals 120°.

Figure 5: Illustration of a cylindrical FOV/ergo plots for the imaginary car of Figure 4.
It worth to mention that, the plot of Figure 5 can reduce the most essential information about the tested car FOV and its related ergonomics, revealing important parameters, such as; the number of visual-through segments for the tested car, the relative area of each segment, the shading in the FOV due to pillars, mirrors, glass stickers and other in-car components, the drivers eye level, rear view mirror level, the length of the blind zones, the maximum vertical forward sight angle, the angular range of direct, indirect and combined FOV, the effect of mirror type and shape on FOV and finally, the driver’s FOV related ergonomics limited by the design of the car interior.
We have chosen 3 candidates test cars belonging to different manufacturing decades. The first was designed just before the year 2010, the second was designed just before the year 2000 and the third was designed before the year 1990. Figure 6 shows the blue print and outlines of these cars from side, top, rear, and front view. We used a semi-professional digital camera type Nikon D610 DSLR with zoom lens 28-300, we used the Photoshop impact 6 as panorama maker.

Figure 6: Blue prints and outlines of the test cars from different views.
We built a test field with a cylindrical screen of L and ρ equalled 2.5 and 4 meters consecutively (Figure 7). The screen is made from hard polymeric printing sheets fixed to 12 wooden Holders as shown in Figure 7a.

Figure 7: Field tests. (a) Test screen and (b) Single laser exposure for indirect FOV.
For every test car, we fixed our laser source to the driver’s seat head rest at cyclopean eye position similar to that of driver of 175 cm tall. The laser is fixed to a rotating platform such that it has the freedom to rotate in the same way, as does the human head. Then we switch on the laser to begin scanning the car interior in stepper correlation with the photographing camera. A laser shadow-gram was then projected on the screen as shown in Figure 7b.
We constructed two panoramic seen for each test car representing the direct and indirect FOV as shown in Figures 8 and 9. We grouped every pair of panoramic seen into only one panorama

Figure 8: Direct FOV panoramic seen.

Figure 9: Indirect FOV panoramic seen.
We presented the collected panoramas after contour enhancements, on one plot to ease the comparison between competitive cars as shown in Figure 10.

Figure 10: Resultant cylindrical FOV/ergo plots for the three test cars (not into scale).
To Analyse the resultant plot we substituted L, ρ, ζ, ψ, a, b and b* by their experimental values in equations 1-3 to obtain D (φ =0), D* (φ =π) and ϴ (φ =0) for each car, as shown in Table 1. Also we can compare the direct FOV of all test cars by obtaining the net Arial visual field that equal the some of the area of all illuminated segments divided by the area of the screen.
| Parameter | Test car I | Test car II | Test car III | Unit |
|---|---|---|---|---|
| Ζ | 0.2 | 0.13 | 0.1 | M |
| Ψ | 0.5 | 0.4 | 0.25 | M |
| H | 1.2 | 1.1 | 1.08 | m |
| A | 0 | 0.1 | 0.29 | m |
| B | 0.45 | 0.48 | 0.51 | m |
| b* | 1 | 1.15 | 1.05 | m |
| D (φ =0) | 6.4 | 7 | 7.5 | m |
| D* (φ =π) | 15.25 | 21.1 | 11 | m |
| ϴ (φ =0) | More than 18 | 18 | 15.7 | deg |
| Half screen area ( π ρ L) | 31.4 | m2 | ||
| Windshield area | 3.76 | 3.14 | 5.4 | m2 |
| Right side window area | 2.7 | 4.3 | 2.24 | m2 |
| Left side window area | 5.7 | 6.3 | 8.8 | m2 |
| Total direct visual areal field | 8.96 | 13.74 | 16.4 | m2 |
| Normalized total visual areal field | 0.285 | 0.437 | 0.523 | - |
Table 1: Numerical results.
In addition, we can retrieve a lot of information about the effect of interior design on the FOV and the FOV related ergonomics as shown in Table 2.
| Remark | Test car I | Test car II | Test car III | Solution |
|---|---|---|---|---|
| Obscuration in FOV | ||||
| Pilars | Very strong obscuration | Strong obscuration | Weak obscuration | Thinner pillar width and smaller inclination |
| Head rest | Very strong obscuration | Strong obscuration | Weak obscuration | Thinner head rest |
| Stearing wheel | No obscuration | Negligible obscuration | Strong obscuration | Lowering stearing wheel position |
| Interior stop alert lamp | Minute obscuration | Large obscuration | No obscuration (no lamp) | Lower interior stop alert lamp positioning |
| Wind shield wipers | No obscuration | No obscuration | Strong obscuration | Lowering wind shield wipers position |
| Rear view mirror | Small Obscuration | Strong obscuration | Strong obscuration | Thinner mirror |
| Right wing mirror | Obscuration near sighting level | Obscuration near sighting level | Obscuration below sighting level | Higher right wing mirror Positioning |
| Left wing mirror | Obscuration near sighting level | Obscuration below sighting level | Obscuration near sighting level | Lower left wing mirror Positioning |
| Ergonomics of combined FOV | ||||
| Left wing mirror | Not easy to sight Very effective with high coverage FOV | Easy to sight Very effective with high coverage FOV | Easy to sight less effective with low coverage FOV | Must be close to the bod Plano mirrors should be avoided |
| Wind shield | Easy to sight | Easy to sight | Very easy to sight | Must be large |
| Rear view mirror | Ineffective with low coverage | Very effective with high coverage | Ineffective with low coverage | Plano mirrors should be avoided |
| Right wing mirror | Not easy to sight Very effective with high coverage FOV | Easy to sight Very effective with high coverage FOV | Not easy to sight ineffective with low coverage FOV | Plano mirrors should be avoided |
| Right side window | Small FOV | Fair FOV | Small FOV | Wider area |
| Rear right side window | fair FOV | Small FOV | Very Small FOV | Wider area |
| Rear window | Small FOV | fair FOV | Very Small FOV | Wider area |
| Left side window | Small FOV | fair FOV | Large FOV | Wider area |
Table 2: Design evaluation remarks.
We noticed that, as the pillar inclination increased in response to the aerodynamics of the automotive airframe, the driver’s FOV decreases. We noticed also, that the indirect FOV is greatly affected by the mirror type, area and pre-adjustment, such result came in good agreement with the results obtained by Boffel and Musseler [10]; Radu et al. [11] and earlier works [12-15].
The information in Table 2 is important to validate proposed method, from Table 1 one can deduce a lot of information using the cylindrical plot about the effect of interior design on the FOV and related ergonomics, Table 2 shows the most remarkable references between the internal designs of cars under test.
Comparison between current approaches and proposed method
The proposed method based on cylindrical plot, was able to reduce and present a wide variety of data on a single plot including direct, indirect and combined FOV, drivers ergonomics and car interior design effect on FOV. With an exceptional simplicity, all kind of information reduced on the plot are easily analyzed with a single eye glance. Unlikely, polar and spherical coordinate methods were not easy at all to be analyzed visually and were not able to present driver’s ergonomics neither the combined FOV. Moreover, the reduction of the image size and wrapping at edges of these plots imposes difficulties in analysing car interior components effect on FOV, the thing that was avoided in the proposed cylindrical method.
From the preceding results, conclude that the novel application of laser shadowgraphy in the field of automotive interior design has proven to be a very effective tool in investigating driver’s FOV and its related ergonomics. By reducing FOV data in cylindrical plot rather than the conventional polar and spherical plots, it was possible to obtain a reliable chart on which all-necessary information about direct and indirect FOV for a certain car are presented. In addition, it reveals many aspects about driver’s visual ergonomics. The simplicity of the mathematical modelling and analysis of such plot helps engineers in judging and enhancing their automotive designs.