Journal of Geology & Geophysics
Open Access
ISSN: 2381-8719
ISSN: 2381-8719
Research Article - (2017) Volume 6, Issue 6
This study used an integrated approach to investigate geological structure and tectonic evolution in Central Afghanistan. Several image processing techniques have been separately and simultaneously applied to data obtained from Landsat Enhanced Thematic Mapper Plus (ETM+) and Digital Elevation Models (DEM) to constrain the geological structure of the study area. Satellite images were combined with Gravity data to better understand 3D geology in the area. Analysis and interpretation of the extracted lineaments indicate that the Central Afghanistan area is controlled by two main fault systems, trending NE and EW. The two trends represent the remnants of reactivated structures that formed under the stress regimes generated during the tectonic evolution of Central Afghanistan. Gravity data indicate a NE trending basin. A two- dimensional (2D) schematic model shows that the basin deepens in the central area and gradually shallows towards the edges. The integration of the results gave insight into the tectonic evolution of the Central Afghanistan area and the adjacent areas.
Keywords: Afghanistan; Remote Sensing; Gravity; Integration; Tectonic Evolution
Integrating remote sensing data with geological and geophysical data has the potential of delineating geological structures and improving geological interpretation with the aim of formulating new geophysical models over target areas [1,2].
The purpose of this study is to investigate the effectiveness of data-integration approach for geological investigation in Central Afghanistan where field investigation is not possible in some areas due to security reasons.
This study implemented several image processes to integrate diverse data sets including ETM+ images, DEM extracted from the Shuttle Radar Topography Mission (SRTM) data, geological map, gravity data, for further geological investigations. This type of study would provide important clues about the origin and development of the central Afghanistan area which is essential for further exploration activities.
Multispectral remote sensing data used widely in mapping lithological and locate structural geological features [3,4]. Shaded relief maps were constructed from the SRTM DEM by varying the azimuth and elevation of simulated sun illumination. Shaded relief maps were generated to emphasize trends perpendicular and parallel to the sun azimuth [5,6]. ETM+ images (VIR-SWIR-NIR-TIR composites) were overlaid on the shaded relief maps to extract geological lineaments using manual extraction techniques. Additionally, slope maps were used to identify geological lineaments in the study area. Manual extraction criteria were based on image characteristics, lithological boundaries and the geomorphological features. Statistical analysis and interpretation of lineament trends and density provides useful information about the tectonic evolution of the study area.
Gravity data were used to delineate a detailed picture of the subsurface structure. Gravity data were digitally acquired and enhanced, and they were subsequently used to map the structural framework of the study areas [7]. Horizontal gradient technique (HG) was used to locate boundaries of density contrast from gravity or magnetic data [8].
The qualitative interpretation of the gravity data indicates that the majority of the study area is characterized by negative gravity anomalies. The analysis and interpretation of the gravity data revealed a basin trending NE. It is revealed that horst and graben blocks occur inside the large basin. The surface geological lineaments were mapped and overlaid on the gravity anomaly map to study their relationship to subsurface structures.
GIS and remote sensing-based methods were used for data integration. The integration of all achieved results provides useful information about the tectonic evolution of the study area.
The study area represents a complex geological history and includes specific numbers of rare-metal pegmatite fields [9,10]. Various rock types are exposed at the surface generally metamorphic and intrusive rocks ranging in age from Cambrian to Quaternary. The rest of the area is complex, with a sediment distribution of different Quaternary landcover types. Metamorphic rocks typically gneisses, schists, quartzite and marble which formed relative inliers in the Proterozoic intruded by Oligocene granite massifs of Laghman Complex which classified mainly to mica, amphibole–biotite, and biotitic granites to granodiorite. These formations are extended more sharply NNE direction in the area and contributed albitization, microclinization and muscovitization of the enclosing alum- silicate rocks known as the plutonic intrusion well (Figure 1) [9]. The study area lies in left-lateral transpressional plate boundary where the Indian plates subduction northward under Eurasia plate [11,12]. The intensity of the tectonic forces generated extremely horizontal compressive stress resulted vast mountainous structure, major strike slip or reverse faulting in the region [13]. A unilateral graben structures can be observed through the structure and surface expression in the region.

Figure 1: Map of Afghanistan showing major structural blocks (dark brown labels), plutonic (belts blue labels), faults (black lines), study area (white dotted rectangle).
The Landsat Enhanced Thematic Mapper Plus (ETM+) image tested for identifying and mapping geological lineaments in the study area. Several False Color Composites (FCC) images have been created and visually interpreted to improve the possibility of lineament extraction. The variance of different band combinations was calculated by using the optimum index factor (OIF) method [14]. The Landsat ETM+ band combinations RGB-742 (SWIR-VNIR) and RGB-748 (SWIR- NIRVIR) were overlaid on shaded relief maps to improve the possibility of lineament extraction [15]. The selected electromagnetic spectrum portions have the advantage of preserving morphological features and displaying different lithological units in vivid different colors [16]. Colored shaded relief maps were used to simulate shading effects that were caused by the sun azimuth and elevation [17]. According to the geological map of the study area, the trends of prevailing lineaments were observed to be in the NE direction. Therefore, sunlight coming from the NW direction was used to mitigate azimuth biasing effects [18]. Several azimuth and elevation angles of simulated sun illumination were tested in this study to enhance the visual detection of linear features in the dominant trend. A low sun-elevation angle (20º to 30º) proved more effective for lineament detection in all directions.
A quadratic fitted to a 3 × 3 kernel filter was used in this study for the identification of features with topographic expression. This slope filter generates data values in degrees from horizontal. The output image contains slope values that range from 0º (flat terrain) to 90º (vertical terrain). It is visualized as an 8b panchromatic image (Figure 2), in which white areas are the steepest slopes and black areas are the gentlest ones. Topographic lineaments can be distinguished by their elevation difference from the surrounding terrain. These elevation changes can be represented as changes in grayscale color in the slope map (Figure 2). The brightness of each pixel in the slope map is related to the slope angle; white areas are steep, and black areas are flat. Although the slope map is not illuminated, the results are similar to those of shaded relief maps.

Figure 2: Geological map of central Afghanistan.
The lineaments were manually extracted based on the tone, shadow and texture of the image, rock units, and the geomorphological features. The lineaments extracted from all remote sensing data were observed to run predominantly in the NE direction, while the E-W trend is subordinate (Figure 3).

Figure 3: Slope map.
A kernel density algorithm [19] was used in the calculations of the lineaments density map. The lineaments density map (Figure 4) demonstrates dense regions in the in the central and eastern parts of the study area.

Figure 4: Extracted lineaments overlaid on the DEM and geological formations with rose diagram.
The gravity data used in this study were obtained from the International Centre for Global Earth Models (ICGEM).
Data gridding was performed using Kriging method to map the gravity variations in the study (Figure 5). Gravity map values are ranging from -164 to -321 mGal. The study area shows a basin-line structure; located in the central part of the area (blue anomalies) and the upthrown parts (pink anomalies) circulated the basin. The volcanoes (Red filled traingles) are located on the basin edges. Most of the blue and pink anoamlies are shaped like ellipsoidal shapes. In terms of geology, these ellipsoidal shape were formed due to complexity structural framework. Three profiles were selected (AA, BB, and CC), crossing the basin, to show the 2D structure based on 3D inverion of gravity data. Horizontal Gradient and CET Grid Analysis were used to enhance and sharpen the structure.

Figure 5: Lineament density map demonstrates dense regions of lineaments.
The horizontal gradient method has been used intensively to locate boundaries of density contrast from gravity or magnetic data [8,20]. The horizontal gradient technique (HG) measures the variation of gravity field in a certain direction (x or y). The horizontal gradient method uses the magnitude of the horizontal gradient that defined as:
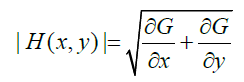
For gridded data where  and
and are the derivatives of the gravity field in x and y direction, respectively. To compute the horizontal gradient magnitude (HGM), gradient values are computed using local quadratic surface fitting in 3 × 3 data windows. Gradient values are computed to the edges of the data coverage; there are no gaps in coverage around the outside edge of the grid or around holes in the data coverage [21]. Horizontal gradient technique was used to generate horizontal gradient map of the study area deduced form gravity data (Figure 6). Trends can be traced well, taking different directions (EW, NE, and NS). The major trend is in NE direction. The volcanoes (green filled triangles) are located on edges trending in NE direction. Black filled edges show the outward edge dipping. The main basin in gravity map (Figure 6) divided into sub-basins most of which trending in NE direction which well-matched with geologic map (Figure 2). Notably, some anomalies have a circular shapes and other has elongated shapes which indicate various structural processes were occurred in the basin.

Figure 6: Gravity map of the study area. AA’, BB’, and CC’ are the selected profiles for inversion. Red filled triangles=Volcanoes.
CET grid analysis is a plugins tools for texture analysis, lineation detection, lineation vectorization, and structural complexity. These algorithms developed by Holden [22]. CET technique provides a measure of the textural information within localized windows (or neighborhoods) in a dataset. It measures the statistical randomness of a neighborhood data values by first quantizing the data into discrete bins and then analyzing the total number of distinct values resultant from that quantization.
Given a specified number of bins, n, for each cell i in a k × k sized neighborhood form a histogram and compute the entropy as follows:
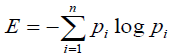
Where the probability p is obtained after the normalizing the histogram of n bins. The output grid comprises real values indicating the amount of randomness exhibited by the texture in the neighborhood center about each cell. Regions exhibiting high statistical randomness are considered high in entropy whereas regions of little randomness have low entropy.
The required parameters for such calculations are Window size and Histogram bins. In general, the window size for a grid with cell dimensions of 25 m × 25 m corresponds to an area of 125 m × 125 m. The number of histogram bins, denoted in the equation above as n. The default is 256 bins but this should be varied according to the range of data values in the grid. For gravity datasets, it is recommended to use a small milli gal (mGal) range be allocated to each bin, e.g. 0.5 m Gal. Note that the larger the number of bins, the greater the computation time.
CET phase symmetry algorithm was applied to the gravity data in the study area and the results were illustrated in Fig. 8. It shows that the main trends/lineation can easily mapped and traced. Comparison with horizontal gradient output (Figure 7), both have high level of agreement while the CET filter gave more clear results than the horizontal gradient.

Figure 7: Horizontal gradient map with interpretation faults/contacts. Black filled triangles represent the outward edges dipping.
In the texture-processed image, regions of gravity discontinuity are indicated by line-line features. One drawback with using standard edge detection methods to detect these features is that double responses are often returned for each line, as the methods are designed for locating step-edges rather than line features. Rather, contrast-invariant feature method was used to detect line-like features.
The phase symmetry edge detection was applied on gravity data of the study area (Figure 8a). Gravity data was converted to standard deviation grid from which window size of 3 × 3 was used to generate the phase symmetry map (Figure 8b). This map defined clearly the edges of the main structures where it maximizes the gradient value of gravity data. It indicates that the major trends can be traced in EW, NW, NE directions. These trends characterized the study area as compared with the geological map.

Figure 8a: Gravity map of the study area.

Figure 8b: CET edge detection phase symmetry filter, using 3x3 window size, results deduced from gravity data.
Qualitative interpretation of gravity data just provides general estimation of source parameters. More analysis are required to deeply estimate anomaly depth. A 3D gravity inversion model was constructed to further study the effect of the basement on the gravity data as well as imaging the basement relief. Due to the lack of direct constraints, simplification of the gravity properties was assumed during the modeling.
The 3D crustal structure of the study area has been defined using GMSYS-3D, Geosoft package [23] and the model was defined by one layer case in grid format (e.g. basement surface) with its physical property distribution (e.g. density). Calculations are performed in the wave number domain using the Parker algorithm [24]. The approach assumes that the gravity response of the basement layer is caused by a series of vertical, square-ended prisms of infinite depth extent. In our case, we used density value of 2.67 gm/cc for basement and 2.2 gm/cc for topography surface (sedimentary).
Figures 9a and 9b shows the basement relief map in 2D and in 3D view. The results indicate that the basement surface is deeper in the central part of the area and getting shallower on the edges of the basin shaped like basin structure. Three profiles were selected as shown in Figure 6 to extract density structure from the inversion data and illustrated in (Figure 10). It was noted that in all three profiles, at the middle part law density can be observed where on the profile edges, high density is recorded. The results indicated basin complex structure characterizing the study area.

Figure 9a: Basement map deduced from 3D inversion of gravity data.

Figure 9b: 3D view of the basement surface, Light position Horizontal= 135 degree and Vertical=45º.

Figure 10: Selected profiles extracted from 3D inversion result. Up=AA, middle=BB, down=CC as shown in Figure 1.
Structurally, two main trends of lineaments were recognized in the study area in the NE and EW directions. Reconnaissance investigations of the gravity data indicate the existence of a basin that trends NE direction. The analysis of HG map indicates that the study area is structurally controlled by lineation with EW, NE, and NS trends. The major trend in such region is in NE direction. It can be observed that the volcanoes are located on edges trending in NE direction. It is noted that the main basin in gravity map (Figure 6) divided into sub-basins most of which trending in NE direction. Variations in lineament trends can be explained by the existence of a broad synclinal form in the study area and the occurrence of several Earthquakes. Variations in lineaments frequency and lengths probably indicate renewed tectonic movement in the study area. Analysis and interpretation of the frequency and lengths of the remote sensing extracted lineaments indicate that the lineaments of NE were mainly mapped on the oldest geological formations in the study area (Cambrian). It possible that NE trending is the key structure that has played an important role in the study area. The lineaments in the E-W directions indicate reactivated faulting in the Cretaceous, Pliocene and Quaternary rocks. These lineaments probably represent the primarily trans tensional forces in the Trans-Himalayan organic belt. It is an extending of the east-west-trending fault zones in the eastern part such as Kunar fault systems. Most probably it is associated with seismicity. The analysis and interpretation of the results indicate that the contraction caused by the Indian-Eurasian plate collision was accommodated by north-northeast- trending faults, while the most recent deformation was accommodated by east west- trending faults. The recent Quaternary faults that have a different direction indicate a change in the stress field of the study area. The extrusive rocks in the study area mainly oriented to the NE trend. This indicates that the volcanic activity in the study area is related to the tectonic activity of the NE trending faults system. The density map indicates that the primary maxima lineaments are located in the central and south parts of the study area on the rocks of the Oligocene, Cretaceous, Jurassic, Triassic and Proterozoic. The secondary maxima are mostly located surround the primary maxima on the same rocks (Figure 5). This can explains the existence of volcanoes only in the south part of the study area. Notably, the primary and secondary maxima high density regions appear as north-east elongated shapes.
The interpreted faults from gravity data run dominantly in the NE, EW and NS directions, respectively. The fault system that trend NE mostly represent the edges of the basin. Extracted lineaments were overlaid on the horizontal gradient map (Figure 11). The integrated results indicate that many of the surface lineaments might be interpreted as vertical extensions of surface faults. Notably, the surface lineaments trending in the NW are mostly not clearly corroborated by the horizontal gradient maxima, which indicates that the vertical throw of these lineaments attains only a few meters. The analysis and interpretation of the gravity data indicates mostly to conformity with the surface geomorphology of the study area (Figure 12). Variations of high and low gravity anomalies observed inside the basin indicate horst and graben blocks, which could also indicate that several tectonic movements affected the basin area.

Figure 11: Extracted lineaments overlaid on the horizontal gradient map. The horizontal gradient map shows subsurface interpreted faults/contacts.

Figure 12: Gravity map overlaid on DEM image of the study area. It shows conformity between the structure of surface and subsurface.
The existence of a basin with variations in depth and trend probably indicates renewed tectonic movement in the study area and also indicates that the central part of Afghanistan was active at several stages, which probably introduced a complex fault system into the study area.
This work was supported by Japan International Cooperation Agency (JICA).