Journal of Geology & Geophysics
Open Access
ISSN: 2381-8719
ISSN: 2381-8719
Research Article - (2026)Volume 15, Issue 1
This study integrates remotely sensed and fieldwork data around the Atmur-Makhasharaf ophiolite belt in the Nubian Desert, Northern Sudan. The region's harsh, arid, rugged terrain makes spaceborne data highly effective for updating geological mapping and mineral prospecting. The optical multispectral Landsat 8 OLI, Sentinel-2, ASTER, and microwave Sentinel-1 scenes, combined with satellite gravity data, were digitally processed. The fused Landsat 8 OLI/Sentinel-2 data, processed by Decorrelation Stretched (DS), Principal Component Analysis (PCA), and Band Ratio (BR) transformations, enable lithological unit discrimination. The Sentinel-1 and fused Landsat 8/Sentinel-1 data enhanced structural lineaments and geological boundaries. The W-E and SE-trending dismembered Atmur- Makhasharaf ophiolitic nappes are of Neoproterozoic age, composed of basal ultramafic tectonites (serpentinites, talccarbonate schist) and mafic-ultramafic cumulates. The metavolcanosedimentary sequences overlain by the ophiolitic sequence consist of an immature island arc and are intruded by syn- to late-orogenic and post-orogenic granitic intrusions. The upper cretaceous sandstone formations unconformably overlie the basement rocks, extruded later by Cenozoic basalts. The satellite gravity data indicate that the ophiolites are rootless, thrusted sheets on younger units, and the post-orogenic granites are emplaced in extensional fractures. The ASTER spectral analysis identified two alteration mineral zones enriched in iron oxides, chlorite and dolomite as oxidation and propylitic zones associated with the Atmur and Makhasharaf ophiolites mafic-ultramafic rocks and sheared rocks.
Atmur-Makhasharaf ophiolite belt; Landsat 8 OLI; Sentinel-2; Sentinel-1; ASTER; Satellite gravity
The Sudanese Nubian Shield (SNS) is integral part of the Arabian Nubian Shield (ANS), comprises Neoproterozoic accreted island arc terranes formed during the East African Orogen (EAO) age (890-690 Ma). The SNS consists of microplates or terranes dominated by metavolcanosedimentary sequences, dismembered ophiolites belts, and granitoids intrusion [1,2]. These terranes (Tokar, Haya, Gebeit, Gerf, Gabgaba, Bayuda, Halfa and Butana) were welded via oblique convergence, marked by E and NE-trend ophiolites belts signifying sutures [2-5]. Significant mineral deposits, include gold, base metals, Volcanogenic Massive Sulfides (VMS), chromite and magnesite hosted in ophiolites and the associated metavolcanosedimentary sequences. Gold had been exploited since the ancient Pharaohs times, with old mines widespread in Northern Sudan and the Red Sea Hills [6-9].
Remote Sensing (RS) technology provides a robust solution, greatly reducing exploration time and costs while providing global data. In Sudan, multispectral satellite data like Landsat TM, ETM+, OLI, and ASTER data have been used for lithological mapping, structural identification, and hydrothermal alteration zones delineation [10-15].
The study area covers the Atmur ophiolite belt in the Nubian Desert of Northern Sudan. The area bounded by longitude 32° 10’-33° 10’E and latitude 20° 22’N-21° 00’N (Figure 1).

Figure 1: Location map of the study area.
The desert’s arid, harsh conditions and sparse vegetation make remote sensing an effective tool for geological mapping and mineral exploration. This study integrates optical multispectral, dual-polarization microwave, and satellite gravity remotely sensed data to map the main lithology and structures, and utilizes the spectral analysis to delineate the alteration zones by minerals signatures to define the potential gold-mineralization zones.
Geological background
The Nubian Desert (ND) basement in northern Sudan extends northward from the Bayuda Desert (BD), it is underexplored due to limited accessibility and sparse prior studies. Bayuda Desert (BD) terrane comprising poly-metamorphosed, multiply deformed crystalline rocks. The oldest units are the medium to high-grade Grey Gneiss unit (Rahaba-Absol Series), consisting of ortho-gneisses and meta-granitoids, predominantly exposed in the western and central BD, dated 930-900 Ma, with pre-Pan African crustal materials [16-20].
The low to medium-grade metavolcanic and metasediments sequences of Kurmut Series of SE Bayuda Desert overlay the Rahaba-Absol Series [21]. It representing arc turbidite volcanics, formed in a turbidity regime in active orogenic cycle of subduction-related magmatism and metamorphism with a peak around 825-800 Ma [16,17,19,21]. The biotite and biotite– hornblende gneisses of Abu Harik Series, once considered as a remnant old basement terrane, are coeval Kurmut Series and represents sheared retrograded granitoids [17,19]. The Ntrending ophiolitic Keraf Suture Zone (KSZ) is supra-subduction zone 650-600 Ma, bounds the juvenile ANS and remobilized Saharan Metacraton in BD [22,23].
The study employed integrated remotely sensed data, with ground truthing fieldwork and laboratory analysis.
Characteristics of remote sensed data and preprocessing operations
The optical multispectral Landsat 8 OLI data: Landsat 8 launched on February 11th, 2013, by NASA and USGS. Landsat 8 pushbroom platform is a 705 km sub-polar orbit, sun synchronous path with a16-day revisit. It carries two-sensor payload, the multispectral Operational Land Imager (OLI) sensor, collect the data in ultra-blue, visible NIR and SWIR spectrum (30 m spatial resolution), and the Thermal Infrared Sensor (TIRS) for two 100 m thermal bands. Additionally, a 15 m panchromatic band (band 8) and 30 m cirrus for cloud detection (Figure 2).

Figure 2: Distribution of bands and their wavelength of Landsat 8 OLI, Sentinel-2 and ASTER sensors within the atmospheric windows in VNIR-SWIR spectrum (USGS-Landsat program).
A single geometrically corrected and georeferenced scene (UTMzone 36N, WGS84 projection system) with ID: LC08_L1TP_174046_20201230_20210310_02_T1, acquired December 30th, 2020, was downloaded from USGS EarthExplorer website (https:// earthexplorer.usgs.gov/). Radiometric correction was applied using the ATCOR module of PCI Geomaica, removal noises and improving signal-to-noise ratio by the Minimum Boise Fraction (MNF) transformation, subset to the study area and pan-sharpened to 10-m spatial resolution by the Grahm Schmidt fusion with Sentinel-1 band 8 (10 m spatial resolution).
The optical multispectral Sentinel-2 data: Sentinel-2 is an optical Multispectral Imaging (MSI), it is a part of the GMES (Global Monitoring for Environment and Security) global land observation program. The MSI Sentinel-2 sensor features twelve bands covering the visible, NIR and SWIR regions of the EMR spectrum, with 10, 20 and 60-m spatial resolutions (Table 1).
| Satellite | No. of bands | Bands | Wavelength (nm) | Spectral region | Spatial resolution (m) |
| Landsat 8 OLI/ TIRS | 11 | B1 | (430-450) | Coastal aerosol | 30 |
| B2 | (450-510) | Blue | |||
| B3 | (530-590) | Green | |||
| B4 | (640-670) | Red | |||
| B5 | (850-880) | NIR | |||
| B6 | (1,570-1,650) | SWIR 1 | |||
| B7 | (2,110-2,290) | SWIR 2 | |||
| B8 | (500-680) | Panchromatic | 15 | ||
| B9 | (1,360-1,380) | Cirrus | 30 | ||
| B10 | (10,600-11,190) | TIRS 1 | 100 | ||
| B11 | (11,500-12,510) | TIRS 2 | |||
| Sentinel 2 | 12 | B1 | (443) | Ultra-Blue | 60 |
| B2 | (490) | Blue | 10 | ||
| B3 | (560) | Green | |||
| B4 | (665) | Red | |||
| B5 | (705) | Red Edge 1 | 20 | ||
| B6 | (740) | Red Edge 2 | |||
| B7 | (783) | Red Edge 3 | |||
| B8 | (842) | NIR | 10 | ||
| B8A | (865) | VNIR (narrow) | 20 | ||
| B9 | (940) | Water Vapor | 60 | ||
| B10 | (1375) | SWIR (Cirrus) | 20 | ||
| B11 | (1610) | SWIR1 | |||
| B12 | (2190) | SWIR2 | |||
| ASTER | 14 | B1 | (520-600) | VNIR | 15 |
| B2 | (630-690) | ||||
| B3N | (780-860) | ||||
| B3B | (780-860) | ||||
| B4 | (1,600-1,700) | SWIR | 30 | ||
| B5 | (2,145-2,185) | ||||
| B6 | (2,185-2,225) | ||||
| B7 | (2,235-2,285) | ||||
| B8 | (2,295-2,365) | ||||
| B9 | (2,360-2,430) | ||||
| B10 | (8,125-8,475) | TIR s | 90 | ||
| B11 | (8,475-8,825) | ||||
| B12 | (8,925-9,275) | ||||
| B13 | (10,250-10,950) | ||||
| B14 | (10,950-11,650) |
Table 1: Specifications of the optical multispectral data used in the study.
Four cloud-free, geometrically corrected and georeferenced (UTM), Top-of-Atmosphere (TOA) reflectance scenes were downloaded from the ESA’s SchHub (https://scihub.copernicus.eu), with granule IDs:
• S2B_MSIL2A_20240708T081609_N0510_R121_T36QVJ_20 240708T102129, acquisition date: 8 July, 2024.
• S2B_MSIL2A_20240708T081609_N0510_R121_T36QVH_2 0240708T103518, acquisition date: 8 July, 2024.
• S2B_MSIL2A_20240529T081609_N0510_R121_T36QVH_2 0240529T124818, acquisition date: 29 May, 2018.
• S2B_MSIL1A_20201216T082249_N0500_R121_T36QWH_ 20230324T125925, acquisition date: 16 December, 2020.
Scenes processed to remove haze effects and to Bottom-of- Atmosphere (BOA) via Sen2Cor module in ESA’s SNAP. Band 8 (NIR, 0.842 μm) was clipped and mosaicked to match the OLI extent.
ASTER semi-hyperspectral data: ASTER launched in December 1999 on NASA’s Terra platform, operates a sunsynchronous at 705 km orbit, 16-day revisit period, it captures 60 × 60 km swath scene in 14 semi-hyperspectral bands: Three VNIR (15 m), six SWIR (30 m), and five TIR (90 m) (Table 1). Six scenes, downloaded from USGS official website (https:// earthexplorer.usgs.gov/), covered eastern (i-iv), and western part of the study area (v and vi), included IDs:
• AST_L1T_00301252004083227_20150503000528_70845. acquisition date: 25 January, 2004.
• AST_L1T_00310052000083919_20150412044519_50078, acquisition date: 5 October, 2000.
• AST_L1T_00310052000083928_20150412044509_32944, acquisition date: 5 October, 2000.
• AST_L1T_00310312001083619_20150423130827_46943, acquisition date: 31 October, 2001.
• AST_L1T_00308252000084632_20150411075313_2591, acquisition date: 25 August, 2000.
• AST_L1T_00308252000084641_20150411075313_2590, acquisition date: 25 August, 2000.
Scenes were geometrically corrected and georeferenced. In each scene the VNIR and SWIR bands were stacked into nine-band images (15 m resolution), spatially clipped and mosaicked to fit the extents of the two parts. Internal Average Relative Reflectance (IARR) module in ENVI correct atmospheric and instrumental errors. MNF transformation reduced noise, enhancing signal-to-noise ratios for subsequent spectral analysis.
Sentinel-1 microwave data: Sentinel 1B (S1B) is a microwave system, uses C-band Synthetic Aperture Radar (SAR) in Interferometric Wide (IW) swath mode, with dual polarization (VV+HV) at 5 × 20 m resolution over a 250-km swath via Terrain Observation with Progressive Scans SAR (TOPSAR). Four Ground Range Detected High-Resolution (GRDH) scenes were downloaded from ESA’s ScHUb (https://dataspace.copernicus.eu)., IDs:
• S1B_IW_GRDH_1SDV_20201221T034623_20201221T0346 52_024795_02F324_4256. Acquisition data: 22December, 2020.
• S1B_IW_GRDH_1SDV_20201221T034652_20201221T0347 17_024795_02F324_5B8. Acquisition data: 22December, 2020.
• S1B_IW_GRDH_1SDV_20201228T033818_20201228T0338 43_024897_02F660_239. Acquisition data: 28 December, 2020.
• S1B_IW_GRDH_1SDV_20201228T033843_20201228T033 908_024897_02F660_9AC. Acquisition data: 28 December, 2020.
SNAP preprocessing operations include orbit refinement; radar sigma-0 backscatter coefficients conversion; topographic radiometric distortions correction; Lee Sigma speckle filtering; Range Doppler terrain correction addressed foreshortening, layover, and shadow errors; dB Backscatter coefficients transformation and rescaling using a square-root function to yield positive values [24].
SRTM 1 arc sec-1 elevation data: The Shuttle Radar Topography Mission (SRTM) 1 arc-second (30 m) elevation data, downloaded from USGS (https://earthexplorer.usgs.gov/), were processed in ArcGIS spatial analyst for geomorphological and hydrological analysis.
The satellite gravity data: High-resolution satellite gravity data from the Global Gravity Model plus (GGMplus), integrates three primary components: GOCE/GRACE satellite gravity (covering spatial scales from ~10,000 to ~100 km), EGM2008 (spanning scales from ~100 to ~10 km), and topographic gravity. This data made available at a spatial resolution of 7.2 arc-seconds (~200 m in the North-South direction) [24]. Bouguer anomaly data obtained by conversion the satellite data using SRTM2 gravity model. SRTM2 gravity model (based on the 990 m global SRTM digital elevation) is an ultra-highresolution model for gravimetric terrain correction represents the gravitational attraction of Earth's global topographic masses. This model implicitly includes the effect of the Bouguer shell, and all residual gravity terrain effects calculated with a constant mass density of 2670 kg/m³ [25].
Methods
Digital Image Processing (DIP) operations were applied to fused optical multispectral Landsat 8 OLI/ Sentinel-2 and microwave Sentinel-1 data for lithological and structural mapping. Satellite gravity data enhanced subsurface structures. ASTER spectral analysis delineated alteration minerals related to gold mineralization. GIS geodatabase integrated obtained results utilized for map layout and cartographic processing (Figure 3).

Figure 3: Flow chart of the data and methodology adopted in the present study.
Digital image processing operations
Digital Image Processing (DIP) operations extracted the geological information through image enhancement, transformation, filtering and fusion processes.
Decorrelation Stretching (DS) enhances color differentiation in highly correlated bands by linearly adjusting Digital Number (DN) values to full DN range. The resulting vivid colors indorsing visual interpretation and feature identification [26]. Principal Component Analysis (PCA) is a mathematical covariance or correlation matrices approach. PCA converts multiple correlated variables into uncorrelated (PCs) sets, revealing spectral characteristics of lithological units and alteration zones via eigenvector loadings [27-32]. Band Ratio (BR) transformation is the most utilizable transformation and highly effective technique used in RS. BR divides one spectral band(s) by other band(s) to differentiate lithological units and delineate alteration zones, based on the specific reflective/ absorptive properties [33,30]. Intensity-Hue-Saturation (IHS) fusion integrates multispectral and microwave data by decomposing RGB composites into IHS components, manipulating them, and transforming back to RGB for enhanced geological interpretation. The panchromatic or microwave band replace the Intensity represents the brightness, during the process [34].
Filtering satellite gravity data
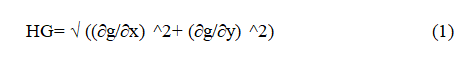
For the satellite gravity data, the widely used Horizontal Gradient (HG) method has been applied to delineate boundaries of density contrast in gravity data, as these boundaries typically correspond to zones of high HG values [35]. The greatest advantage of the method is that it is least susceptible to noise in the data, because it only requires calculation of the two first-order horizontal derivatives of the gravity field (Eq. 1).
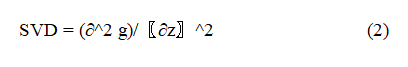
Where ∂g/∂x, ∂g/∂y are the derivatives in x and y respectively. The Second Vertical Derivative (SVD) was used as a 2- dimensional filter for the interpretation of gravity data [36], where double differentiation of the gravity field with respect to depth enhances shallow features at the expense of regional features. A zero value of the SVD, occurring where the gravity gradient undergoes its most rapid change from one level to another, is geologically interpreted as indicating shallow faults. The SVD obtained using (Eq. 2):
The Tilt Angle of the Horizontal Gradient (TAHG) is an edge detection method for enhancing interpretation of the potential field data [37]. This technique uses the tilt angle of the horizontal gradient (Eq. 3), which emphasizes source edges with amplitude maxima and balances signals from both shallow and deep sources. TAHG is obtained by following formula:

where ∂HG/∂x, ∂HG/∂y, and ∂HG/∂z are the two horizontal and vertical gradients of the horizontal gradient respectively. High values of TAHG typically highlight lithological edges or contacts.
Spectral analysis
Spectral analysis techniques of hyperspectral data are based on the fact that remotely sensed imagery is sampled with numerous spectral bands at narrow bandwidths often on the order of tens of nanometers), making it possible to construct a spectrum for each pixel in the image. The spectrum can then be compared with the spectra of known pure materials such as minerals, vegetation and atmospheric gases. These pure materials are often referred to as endmembers. The spectra of the endmembers primarily come from three different sources include image derived ‘‘pure pixels’’; in situ spectro-radiometric measurement; and laboratory based spectral libraries such as those provided by Johns Hopkins University, the US Geological Survey, and NASA’s Jet Propulsion Laboratory [31,32,38].
ASTER scenes were spectrally analyzed using a resampled USGS spectral library for map and delineate alteration minerals of oxidation zone (jarosite, goethite, hematite); phyllic zone (muscovite); argillic zone (alunite, kaolinite); propylitic zone (chlorite, epidote, dolomite) with their distinguished spectra.
Matched Filtering (MF) method: Matched Filter (MF) is rapid means detects the abundances of user-defined endmembers. The technique maximizes the response of the known endmember using a partial unmixing, suppressing backgrounds of unknown endmember, thus matching the known spectral signature via spectral library. Outputs include gray scale images and shapefiles of the spatial distribution of the selected alteration minerals (ENVI help).
Spectral Angle Mapping (SAM) classifier: The Spectral Angle Mapping (SAM) technique extends geometric interpretation to hyper-dimensional space, to quickly map spectral similarities between images spectra and reference spectral [39]. SAM measures the angle between vectors representing the center of an unknown endmember mineral and a known mineral from a spectral library, quantifying classification separability. Smaller angular separations indicate greater spectral similarity, producing a spectral similarity map. The SAM classification output includes an image showing the best spectral match for each pixel and a rule image indicating the angular distance in radians between the image spectrum and the ASTER spectral library for each unknown end member.
Fieldwork and laboratory studies
Fieldwork included ground truthing, structural measurements, and sampling of rocks, auriferous quartz veins, and orealteration zones for subsequent analysis. Polarized and ore microscopy at Faculty of Petroleum and Minerals, Al Neelain University identified mineral compositions, assemblages, metamorphism grade, textures and mineral para genesis.
Digital image processing operations
Suites of advanced image processing techniques were applied to fused Landsat 8 Operational Land Imager (OLI) data (10-meter), to enhance lithological discrimination and structural mapping. These techniques included False Color Composite (FCC), 2% Linear Stretching (LS), decorrelation stretch, Principal Component Analysis (PCA), Band Ratio (BR), and Intensity- Hue-Saturation (IHS) image fusion with Sentinel-1 microwave data. Optimized band combinations from the enhanced and transformed images were used to differentiate and map distinct lithological units. The False Color Composite (FCC) image, generated using decorrelation stretched Landsat 8 OLI 7, 5, and 2, (RGB), respectively, provides superior lithological discrimination (Figure 4). Saturated turquoise green hues reveal serpentinized mafic-ultramafic ophiolitic rocks of Atmur belt, specifically at J. Umm Fitfit and J. Makhasharaf, with a finetexture, low relief. Pyroxenite-gabbroic rocks exhibit deep reddish colors, moderate relief bodies. Basic metavolcanic rocks display light to deep reddish hues and low relief exposures. Synto late-orogenic granitic rocks, forming extensive peneplains, exhibit distinct violet-bluish spectral signatures, partially obscured by spectra from the overlying weathered materials and aeolian deposits. The granites in the southwestern sector display more reddish tints, while the have greenish-tan hues in the eastern sector due to the mafic and ultramafic weathered products. Intermittent folded carbonate belts distinguish by their cyanic hues, whereas metasediments are appearing as fine texture, low-relief ridges with brown tones. Post-orogenic granites and syenites intrusions, demarcate with a distinct highrelief inselbergs and mountain ranges, are marked by deep brown hues. Nubian Sandstone rocks exhibit reddish hues, partially masked by tan-greenish aeolian sand sheets and sand dunes, while alluvial deposits are identifiable by light yellowish green tones (Figure 4).

Figure 4: FCC of Landsat 8 OLI data, decorrelated stretched bands 7, 5, and 2 in RGB, used for lithological discrimination in the study area. Note: srp: serpentinized ultramafic rocks; pyx: pyroxenites and gabbros; gb: gabbro: mbst: basic metavolcanic: Cc: carbonate (marble); Clcs: carbonate (calc-silicates); msd: metasediments (graphite and sericite schists); s-Drt: diorites; syn- to late-orogenic granites; s-Grd: granodiorites; syn- to late-orogenic granites; s-Gr: granites; syn- to late-orogenic granites; shrd-Gr: sheared granites; syn- to late orogenic granites; p_Gr: granites, post-orogenic granites; p-Sy: syenites, post-orogenic granites; mgr: porphyritic microgranites; Sst: Cretaceous Sandstones Formations; Bst: Cenozoic basalt; snd: Superficial sand dune.
Additional image transformation processes (Principal Components Analysis (PCA), Minimum Noise Fraction (MNF) transformation and band ratio) were applied on the fused Landsat 8 OLI data to reinforce the visual lithological discrimination. The FCC image of the triplet (PCA1, PCA2, and PCA4) and triple set (PCA2, PCA3 and PCA4,) (Figure 5 a and b) in addition to MNF (MNF1, MNF2 and MNF3) transformation, and the Sultan’s band ratio image (R=(6/7), G=(6/2), B=(4/5) × (6/5)] (Figure 5 c and d). These images significantly improved lithological unit differentiation, particularly in the southwestern sector, where original hues were partially altered by superficial materials reflected spectra.
Edge are high-frequency variations-contain critical information for discriminating adjacent objects. These edges are influenced by terrain properties, vegetation, and illumination conditions. The FCC image of Sentinel-1 high-pass filtered bands VH, VH +VV and VV in RGB, respectively, was used to delineate edges and lineaments as structural features. Additionally, the IHSfused image of Landsat 8 OLI bands 7, 5, and 2 with Sentinel-1 VH band enhanced and demarcated boundaries between various lithological units (Figure 5).

Figure 5: Transformed Landsat 8 OLI imagery used for lithological discrimination in the study area. (a) FCC image of PCA1, PCA2, and PCA3, in RGB, respectively (b) FCC image of PCA2, PCA3, and PCA4, in RGB, respectively. (c) FCC image of MNF2, MNF3, and MNF4, in RGB, respectively (d) FCC image of Sultan’s band ratio, band 6/7, 6/2, (4/5) × (6/5) in the R, G, and B, respectively. (e) FCC image of Sentinel-1 bands VH, VH+VV, and VV in the R, G, and B, respectively, used to delineate the major regional structural elements. (f) Fused IHS FCC image of Landsat 8 OLI with Sentinel-1 microwave data, bands 7, 5, and 2 with Sentinel-1 VH band.
Geology of the study area
Based on the remotely sensed and field work data the general geology of the area consists of Neoproterozoic basement complex terrain. The dominant lithological units are the mafic-ultramafic ophiolitic assemblage overlain by metavolcanosedimentary sequences. Later, were intruded by the syn- to late orogenic granites and later by post-orogenic granite intrusions and their volcanic equivalents. The older units unconformably overlain by Upper Cretaceous Nubian Sandstone Sedimentary Formations. These units are extruded by Cenozoic basic volcanic eruptions. The older units partially/or completely covered by aeolian sand sheets and alluvial wadies deposits of Recent and Quaternary age (Table 2 and Figure 6).

Figure 6: Geological map showing lithological units, faults, shear zones and other features with coordinates, railway stations, and drainage details.
The mafic-ultramafic ophiolite sequence: The dismembered mafic-ultramafic ophiolite sequence consists of mélange of basal ultramafic tectonites and a mafic-ultramafic cumulates.
| Quaternary superficial deposits | Aeolian sand sheets and dunes |
| Alluvial deposits | |
| Unconformity | |
| Cenozoic Basalts extrusives | Basalts extrusives |
| Upper cretaceous Sedimentary Formations | Nubian sandstone formations |
| Unconformity | |
| Post-orogenic granites | Ignimbrites, Trachytes and Felsite dykes |
| Micro-diorite, Micro-syenites, Micro-granites | |
| Syenites, Granites | |
| Unconformity | |
| Syn- to late-orogenic granites | Granites and granodiorites |
| Gabbros and diorite | |
| Structural contact | |
| Metavolcanosedimentary sequence | Quartzites and Metacherts |
| Carbonates (marbles and calc-silicate | |
| Intermediate-acid metavolcanics (sericite schist, pyritiferous sericite schist, graphitic schist) | |
| Basic metavolcanics (metabasites, amphibolites) | |
| Structural contact | |
| Mafic-ultramafic ophiolite | Mafic-ultramafic cumulates (Meta-gabbros and pyroxenites) |
| Basal ultramafic tectonites (Serpentinites; Talc carbonate schist; magnetiferous chlorite schists) | |
Table 2: Generalized geological column of the map area.
Basal ultramafic tectonites: Basal ultramafic tectonics dominated by serpentinites, subordinated with a matrix the talc carbonate schist, and magnetiferous chlorite schists. The serpentinites cropped out as nappes of 60 km length, arcuateshaped medium to high elevated hilly ridges of Atmur belt (J. Umm Fitfit). This structure has been described as Atmur ophiolites [40]. Serpentinites ramps also exposed as a relatively low to medium elevated ridges at J. Makhasharaf belt. In satellite imagery usually exhibit relatively fine texture ridges with soft boundaries. The rocks are dull green color, fine-grained massive rocks, commonly, injected by acid-to basic dykes and quartz veins. Microscopically, they consist of oriented fibrous, flacks or radial aggregates antigorite after olivine, or as random polygonal blades, secondary chlorite, carbonates with quartz veinlets, weakly oriented and non-oriented subhedral opaque chromite and magnesites (Figure 7).

Figure 7: Photomicrograph of serpentinites rock, showing serpentine and talc fibrous.
Matrix tectonites consist of talc carbonate schist intercalated with magnetiferous chlorite and talc-chlorite schists. They form low to medium elevated ridges juxtaposed the serpentinites. The mélange are light brown to pink color, fine-to medium-grained foliated, consist of talc, carbonate, chlorite and minor serpentines, and listowenite. The magnetiferous chlorite schists cropped out as low-elevated ridges NW of J. Umm Fitfit, and rimming Jebel Mekha. They formed of dark green color, spotted fine-grained foliated rocks of porphyroblasts magnetite and crenulated chlorite as ground matrix. They display strong NW, NWN and N-S foliation, folded in asymmetrical isoclinal tight reclined folds, refolded in mushroom type of folds, commonly sheared brecciated and injected by quartz swarms. Atmur belt shows open folds refolded earlier ones. They are brecciated and sheared silicified.
Mafic-ultramafic cumulates: The mafic ultramafic cumulates consist dominantly of meta-gabbros subordinated by metapyroxenites. The meta-gabbros cropped out as low-laying surface boulders and as low-elevated ridges and small hillocks around J. Umm Fitfit. The pyroxenites cropped out as low-laying surface boulders or low-elevated hillocks and ridges surrounding J. Umm Fitfit, and east J. Mandera. They are dark green to blue hues, coarse to medium-grained size, made up of interlocked highly sheared and altered green pyroxene and plagioclases, secondary amphiboles and chlorites. The rocks are non-foliated to weekly foliated (NW and N-S) rocks. The mineral assemblage indicates a retrograde metamorphism in low-grade of regional greenschist facies.
Metavolcano sedimentary sequences: Interbedded and intercalated volcanic and sedimentary sequences include varieties of lithologies ranging from the basic, acidic to intermediate volcanics, carbonates as marbles and calc-silicate rocks and quartzites and cherts meta-psammatic sediments.
Basic metavolcanics
The basic metavolcanics are the dominant lithological unit in these sequences; they are mainly interbedded basic rocks, known as Kurmut Series of eastern Bayuda Desert [16,17]. These rocks cropped out as parallel to sub-parallel, discontinuous, low-laying to low-elevated ridges in the central parts between J. Mandera and J. Keheili. They are highly deformed and sheared display asymmetrical tight isoclinal inclined refolded ridges with general NE-trend foliation with structurally controlled boundaries. The mineral assemblage indicates a low-grade regional metamorphism of greenschist facies up to amphibolite facies (Figure 8).

Figure 8: Photomicrograph of crenulated nematoblastic amphiboles with secondary epidote (XPL).
Acid-intermediate metavolcanics
These are minor volcanic units include sericite schist, pyritiferous sericite schists and graphitic schist. In satellite imagery it is difficulty to discriminate these units due to their limited spatial extension and intercalation with other sequence.
In the field they found as low-laying surface bouldery outcrops, intercalated and interbedded with metasedimentary units and the basic metavolcanics as in the area of J. Makhasharaf and area around J. Mandera and J. Keheili, respectively. The rocks display NW regional foliation with deformational and shearing imprints and similar fold interference patterns. The mineral assemblage indicates a low-grade regional metamorphism of greenschist facies. Carbonates and Calc-silicates
The marbles and calc-silicates are the sub-dominant lithological unit in these sequences. The carbonate rich metasediments in north Sudan and along the Keraf Zone is known as the Bailateb group [41], as a passive margin carbonate -rich turbidite sediments and conglomerate sediments.
In the FCC PCA 432 image, carbonates have distinctive cyanic hues, however their narrowness, limited spatial extent make them difficult to map separately in most occasion. In the field they found as low-laying discontinuous refolded and sheared intercalated marbles and calc-silicate belts, interbedded and intercalated with other metasedimentary units and occasionally with the basic metavolcanics (around Jebel Makhasharaf, south J. Mekha and minor layers in Umm Fitfit area). They form a multi folded plunged asymmetrical tight isoclinal inclined refolded interference pattern. The calc-silicate minerals are richer in calciferous amphiboles and chlorites, which are consists beside of the calcite subordinates actinolite-tremolite, epidote, zoisite, and quartz minerals. The mineral assemblages of these rocks indicate a low-grade regional metamorphism of greenschist facies.
Quartzites and metacherts
The quartzites and cherts are the minor lithological unit in these sequences. They cropped out in the central parts (e.g. J. Makhasharaf area and east J. El Mekha, and minor layers in Umm Fitfit area) as low-laying surface, highly deformed and sheared, discontinuous belts intercalated with carbonates layers and occasionally with the basic metavolcanics. In satellite imageries it is difficult to differentiate these layers.
Syn to late orogenic granites: These are foliated biotite granites and granodiorite-diorite rocks and minor gabbros intrusions, they are dominant unit, exposed out as low-laying surface bouldery outcrops or as low to moderate-elevated hillocks and ridges, partially covered by the aeolian sand sheets as in the southern parts or surrounding Jebel Mandara. The granodioritediorite- rocks are mapped to the E and NE of J. Keheili, they are weakly foliated with regional NW and NNW trends and in some localities gabbroic rock resembling amphibolite rocks present. NS and NW shear imprints are clearly, and injected by numerous quartz veins., while biotite granites are exposed in the vast peneplain covering the southern parts. These rocks are I-type granite intruded concordantly in the metavolcanosedimentary, they are related to the Rahaba-Series granites and represent the foreland of Bayuda terrane [16,17].
Post orogenic granites: These are non-foliated, A-type anorogenic granites, they exposed in all levels as elongated, circular and ring complexes intrusions of sodic granite, quartz syenite and syenite plutons, with minor intrusions and dykes of porphyritic micro-granite and porphyritic micro-diorite. The intrusive rocks are associated with their volcanic equivalents as rhyolite, trachyte and ignimbrites and felsite dykes.
The hugest high-elevated series, 40 km length, WNW trend, ring complexes intrusions is J. Mekha (J. Al Howash) in the central eastern part. It consists mainly of quartz syenite and syenite rocks. Similarly, ring complex (J. Mandera and J. Keheili) consist of sodic granite, syenites and microdiorites intrusions, with peripheral and radiated dykes of porphyritic microgranites, micro-syenite and associated with extrusive rhyolites, ignimbrites and trachytes.
Numerous dykes of trachyte and felsite dykes intersected all older units with variable dimensions and various trends; they associated with mild thermal impacts. These dykes related to the anorogenic intrusions especially in the northeast part of the study area.
Nubian sandstone formations: Thes sedimentary Nubian Sandstone rocks cropped out mainly in the central part, it forms diagonally NW-SE trend graben structure. The rocks expose as surface low laying, isolated hills and smaller patches rafted the basement rocks with a distinct unconformity or preserved faultstructural contact. They form horizontal, to very gentle (10-20) dipping strata mainly of sandstones with minor conglomerates and mudstones. Fossil woods (Cycadomyeolon fourtauii) indicating upper cretaceous continental depositional environments.
Cenozoic volcanic basalts: Cenozoic volcanic basalts are the youngest extrusive volcanic rocks in Sudan, they have been reported in Bayuda Desert, and the Third Cataract. The basic volcanic rocks are extruded during the Cenozoic (Neogene) periods and are closely connected with N-S and E-W post- Nubian faults that are related to the Central African Shear Zone (CAFZ). Numerous dark hills of olivine basalts have been observed in the central part of the area extruded and capping the Cretaceous sandstones. The basalts are fresh, massive, finegrained and dark green in colour.
Quaternary-recent superficial sediments: The aeolian sand sheets and alluvial Wadi sediments cover most lithological units. The NE trend wind-blown desert aeolian sands and sand sheets covers most the northern and northwestern parts of the study area. The superficial residual sediments include pebbles, gravels, sands, clays, sandy clays and silt and covering most elevated plains of the basement rocks and the sandstone layers in middle and eastern parts as they are the weathering products of these rocks. The Wadi alluvial consists of sands and gravels, Wadi Keheili is example of these deposits which are covered partially by the recent aeolian sand sheets [42-46].
Lineaments extraction
Lineament analysis have been driven from optical Landsat 8 (edge filtered PCA1) and microwave Sentinel-1 (VH band) imageries through automated digitization by Line module in the PCI Geomatica of linear features extraction. Lineaments represent major fault and fracture system, beside that artificial lineaments that represents tracks and railway lines have been excluded. The majority of the extracted lineaments have NNE, NE and E-W trends, although the microwave data provide wealth results (Figure 9).

Figure 9: Extracted liniments from filtered Sentinel-1 VH band and their major orientation rose diagram.
Satellite gravity setting
The Bouguer anomaly in the study area ranges from -31 mGal to -68 mGal, the highest values concentrated near the center of the area, several filtering techniques, were applied including, the Second Vertical Derivative, Horizontal Gradient, and Tilt Angle of the Horizontal Gradient (Figure 10). Gravity data was analyzed to assess whether the present high-density mafic-ultramafic bodies present are deeply rooted, suggesting significant vertical extent, or they exist as rootless surface-level masses. However, the comparison with the geological map reveals that the zones of high gravity anomaly do are not precisely coinciding with the mapped mafic–ultramafic units. This discrepancy suggests that these bodies are not being deeply rooted, but rather thin sheets or shells that have been tectonically emplaced or thrust over the region.

Figure 10: Results of the processed satellite gravity data, (a) Bouguer anomaly map, (b) Second vertical derivative map, (c) Horizontal gradient map (d) Tilt angle of the horizontal gradient map.
In contrast, the sedimentary formations in the area do not exhibit clearly defined negative gravity anomalies. Instead, they are associated with medium to relatively high gravity values. This pattern implies that these sedimentary layers are relatively shallow, likely less than one kilometer in depth.
Mineral exploration
ASTER data have been spectrally analyzed to delineate the alteration zones related to mineralization and their distinguished minerals.
Spectral analysis of ASTER data: Mosaicked ASTER data representing the two eastern and western part are spectrally analyzed by the Matched Filtering (MF) and the Spectral Angle Mapper (SAM) classifiers in the ENVI package. The spectral analysis performed by comparing the images unknown spectra with resampled selective alteration minerals from the USGS library. The nine minerals have been selected that are of oxidation zone (jarosite, goethite, hematite); phyllic zone (muscovite); argillic zone (alunite, kaolinite); propylitic zone (chlorite, epidote, dolomite).
Results of the MF classifier revealed zonation for the chlorite, dolomite, epidote, goethite and hematite minerals around Atmur belt and the juxatposed basic metavolcanics. Hematite, jarosite and dolomite minerals mapped at the SE part of J. Mackasharf in the eastern part (Figure 11). The other minerals weakly distributed within the area.

Figure 11: Alteration minerals maps resulted after spectral analysis using MF classifier (threshold 0.3) for, a) alunite, b) chlorite, c) dolomite, d) epidote, e) kaolinite, f) muscovite, g) jarosite, h) goethite, i) hematite.
The mineral maps derived from the Matched Filtering (MF) classifier reveal pronounced zonation of alteration minerals around the Atmur ophiolite belt, and the shear zone at the western part of the study area. Moreover, the areas of Makhasharaf ophioltic belt and its surrounding lithologies show high clustering of iron oxides and dolomite minerals (Figure 12).

Figue 12: Collective alteration minerals map after MF classifier.
The SAM classifier display weak zonation at western part of Atmur belt for chlorite, dolomite, kaolinite and hematite minerals. Other minerals are weakly distribution around the study area (Figure 13). The collective alteration minerals map (Figure 14) depicts wealky zonation around and south Atmur ophiolitic belt, similarly at Mackasharaf ophiolite belt and to south alteration zones depicted by hematite and dolomite spectral signatures (Figure 15).

Figure 13: spectral analysis minerals maps after SAM classifier (threshold 0.3). a) alunite, b) chlorite, c) dolomite, d) epidote, e) kaolinite, f) muscovite, g) jarosite, h) goethite, i) hematite

Figure 14: Collectve alteration minerals map after SAM classifier.

Figure 15: The Au samples geocehmical result (in the eastern part) with the collectve alteration minerals map after SAM classifier.
The geochemical results of the samples collected from the alteran zones in the eastern part, revealed varibale Au content upto 26 ppm, the Au mineralization has a NW-SE trend aligned with the ophiolite ramps iin the area (Figure 16).
Gold and associated elements have been analysed from chip sampled from alteration zones in the eastern part. Some samples give high values of As, Cu, Ni, Ti, V and Zn (average 23.1, 172.2, 285.1, 2349.9, 156.8 and 113 ppm, respectively).
Gold values above the detection limit is high, about 90% (N=33) and the content vary from 2 ppb (detection limit) to 24624 ppb, with average Au content of 2526 ppb (Table 3). A number of 14 from the total 33 samples (42%) have anomalous or high content of Au values (values>100 ppb). 16 samples (48% of the total samples) are above the detection limit and <100 ppb.
| Element | unit | Minimum | Maximum | Average |
| Au | ppb | 2 | 24624 | 2526 |
| Ag | ppm | 0.7 | 3.5 | 1.8 |
| As | ppm | 7.6 | 106.5 | 23.1 |
| Ba | ppm | 6.7 | 2028.3 | 415 |
| Ce | ppm | 2.4 | 102.7 | 30.3 |
| Co | ppm | 1.2 | 228.9 | 39.7 |
| Cr | ppm | 22.2 | 2776.1 | 348.9 |
| Cu | ppm | 2.2 | 1631.7 | 172.2 |
| Fe | % | 0.3 | 49.9 | 6.7 |
| La | ppm | 2.8 | 136.8 | 23.2 |
| Li | ppm | 2.1 | 35.8 | 13.7 |
| Mn | ppm | 44.5 | 5925.5 | 1471 |
| Mo | ppm | 1 | 10.5 | 4 |
| Ni | ppm | 6.8 | 3166.9 | 285.1 |
| Pb | ppm | 3.5 | 115.6 | 20.7 |
| Sc | ppm | 1.4 | 67.5 | 15.4 |
| Sr | ppm | 2.2 | 886.6 | 150.2 |
| Ti | ppm | 23.9 | 7215.3 | 2349.9 |
| V | ppm | 2.4 | 580.3 | 156.8 |
| Zn | ppm | 5.4 | 1009.1 | 113 |
| Zr | ppm | 1.1 | 141.4 | 34.1 |
Table 3: Statistical parameters, based on 33 chip samples of alteration zones.
Gold grains were observed from the collected stream samples collected during the fieldwork, confirming the presence of placer deposits. The observable gold grain of various shapes, size range between 1 to 2 cm, and up to 4 cm as maximum flakes (Figures 16 and 17).

Figure 16: Flaky gold grain in sample S1592.

Figure 17: Gold and other heavy metals under binuclear microscope.
The study focuses on creating a medium-scale geological map of the Atmur-Makhasharaf ophiolite belt and surrounding areas in the Nubian Desert, northern Sudan, using integrated remote sensing data and fieldwork. It employed medium-resolution optical multispectral data (Landsat 8 OLI, Sentinel 2), semihyperspectral ASTER, microwave Sentinel 1, and satellite gravity data. Various preprocessing and processing digital image processing operations, including decorrelation stretching, Principal Component Analysis (PCA), and band ratioing, were applied to correct errors and enhance lithological discrimination, while, Sentinel 1 microwave data aided in mapping geological boundaries and structural lineaments.
The area consists of a Neoproterozoic basement complex with the Atmur-Makhasharaf ophiolitic belts, trending W-E and NE– SW and intersecting the N-trending Keraf Shear Zone. The ophiolites include basal ultramafic tectonites dominated by serpentinites and minor talc chlorite carbonate schist, magnetiferous chlorite schist and listowenites, and maficultramafic cumulates consist of pyroxenite and gabbro. Metavolcanosedimentary sequences, indicate an immature island arc setting, dominated by basic andesitic metavolcanics, subordinated by acidic metavolcanic, carbonate marbles and calc-silicate rocks, and a few metasediments. Syn- to late-orogenic granites (I-type, mainly granite and granodiorite) and postorogenic granites/syenites intruded these units, with the latter linked to within-plate igneous activity. The basement is overlain by Upper Cretaceous Nubian Sandstone Formations and Cenozoic basaltic volcanics, covered by Recent-Quaternary aeolian sands and alluvial deposits.
Satellite gravity data revealed that the ophiolite belts are rootless, thrusted, and obducted over younger units, with post-orogenic granites intruding along regional extensional fractures. The sedimentary strata of the Nubian Sandstone Formations have erosional contact with the basement rocks in the southern part and it becomes thicker towards the north.
Gold was identified as quartz veins, alteration zones and placer deposits, with auriferous quartz veins and alteration zones showing high gold concentrations, Spectral analysis of ASTER data revealed the presence of two major alteration zones, the first around Atmur ophiolite belt in the western part, and the most western NNE -SSW shear zone. The other zone extends from Makhasharaf ophiolite belt in the central area and goes southeast.
The study refines the structural orientation of the Atmur- Makhashraf ophiolite belt, proposing a NE–SW to SE trend, and suggests it as a potential new suture zone in the Nubian Shield. The region experienced complex deformation with ductile folding phases and shearing. The integration of remote sensing and field data supports an active margin setting, challenging earlier passive margin interpretations. While lacking primary geochemical and isotopic data, correlations with prior studies aided geological mapping. Further petrographic, geochemical, and geochronological studies are needed to validate the suture zone hypothesis. The study highlights the effectiveness of remote sensing in mapping remote, arid terrains.
The authors extend their appreciation to the anonymous reviewers for their thorough feedback, which significantly improved the quality of the manuscript.
Citation: Khidir SOH, Elsheikh AA, Abdelgalil MY, Hassan MA, Mohieldain AA (2026) Integration of Optical-Microwave Remotely Sensed and Satellite Gravity Data for Geological Mapping and Mineral Exploration around Atmur-Makhasharaf Ophiolite Nappes, North Sudan. J Geol Geophys. 15:1246.
Received: 17-Nov-2025, Manuscript No. JGG-25-39186; Editor assigned: 19-Nov-2025, Pre QC No. JGG-25-39186 (PQ); Reviewed: 03-Dec-2025, QC No. JGG-25-39186; Revised: 13-Jan-2026, Manuscript No. JGG-25-39186 (R); Published: 20-Jan-2026 , DOI: 10.35248/2381-8719.26.15.1246
Copyright: © 2026 Khidir SOE, et al. This is an open-access article distributed under the terms of the Creative Commons Attribution License, which permits unrestricted use, distribution, and reproduction in any medium, provided the original author and source are credited.