Sociology and Criminology-Open Access
Open Access
ISSN: 2375-4435
ISSN: 2375-4435
Research Article - (2022)Volume 10, Issue 3
Polygraphy is an age-old gold standard for lie detection by the police department. In due course of time, many modern methods have come out for lie or deceit detection which are more simplified and accurate. Thermal video analysis is one of them. During an interrogation process thermal video is captured and subsequently analyzed for detecting the act of lying. At the same time a person’s behavior can be analyzed from the audio recording which could be another important clue for deceit detection. In the present study, a real-life database has been generated by creating a real crime of stealing scenario. During the interrogation process the thermal video and audio recordings have been carried out simultaneously in a concealed manner. The temperature of the forehead and periorbital areas is extracted to measure the blood flow rate. It was observed that in case of person who is lying, the temperature of these areas increased more than those of truth-tellers. Analysis of the speech of the subjects was also carried out to understand the difference in the pattern of speech attributes of liars and truth-tellers. It was found that liars take more silent pauses and have higher values of the pitch in their voice when they were being interrogated. Finally, we have combined the effect of thermal video and audio analysis for decision making.
Database; Deceit; Thermal imaging; SVM
At times experts find it difficult to detect lies and truth during an interrogation process [1]. It has been deduced from research that the mental state experienced by liars is far different from that of truth tellers [2]. Different emotions like shame, guilt, anger, disgust, and fear are experienced by liars with more intense than truth tellers [3].
The autonomic nervous system controls the involuntary reflexes. Examples of such reflexes are blood pressure, pulse rate, sweating, gastrointestinal mobility, urinary bladder and bowel emptying, blood flow, etc. Such reflexes are activated subconsciously. When a person steals or does a mistake and later tries to conceal it, then he or she is in stress. Such stress, better known as stress response, activates certain activities of the body and face through the autonomic nervous system. The facial muscles of the face especially the forehead and periorbital muscles are active which facilitates the increased blood flow to that area. Due to increased blood flow, the skin surface temperature of that area increases [4].
Polygraph technology is considered a gold standard globally for lie detection to date. In polygraphy examinations, different parameters like blood pressure, respiratory rate, cardiovascular and electro dermal activity of a person are measured which are analyzed later to differentiate between lie and truth [5,6]. The polygraph method has limitations because of the dearth of trained experts and it being an invasive procedure, it has other issues also [7,8]. Even if the interrogation session is of small duration, the time taken to process it is very long and cumbersome [9].
The motivating factors to work out non-invasive methods are
• Unpredictable behavior of participants under present contact-based lie-detection method
• Time-taking and cumbersome procedure to ascertain the detection
• Lack of well-trained experts
Research has found that there is a measurable change in the behavioral and physiological parameters of a deceiver from a truth-teller during the time of interrogation. These changes are extremely important to distinguish between liars and truth tellers [10-13]. Some of the most common non-invasive methods use videos, audio, text, a fusion of video, audio, text, and thermal imaging for the detection of deceit [14-16].
In this work, we focus on the use of thermal imaging as well as interrogation audio for the detection of deceit. Using thermal imaging one can easily measure parameters like respiratory rate [17], pulse rate [18], blood flow [12] and blood flow distribution [18] in a noninvasive manner. The facial blood flow pattern is affected when a person is lying or trying to deceive others. This change in blood flow beneath the skin causes change in skin temperature which can be measured by the use of a thermal camera [19-21]. Researchers have found that verbal (speech- related) cues can also be an indicator to detect deception by identifying the underlying emotions [22-26].
Related works
The work on deceit detection consists of two phases. The first phase is to have a proper database that simulates the guilt and lying and the second phase is the detection of deceit. Works related to both aspects are presented in the following paragraphs.
Simulating guilt and lying
Most of the databases existing till today for deceit detection involve a mock crime scenario. The most common mock crime scenarios done are like concealing a banned object [27], stealing money [7, 28] or jewellery [29] and attempt to kill a mannequin for stealing [7]. The experiment done by Frank and Ekman in 2004 [30] is considered as one of the ideal models where a mock crime scenario was created for stealing. As per the protocol, few of the participants stole money and others took their own decision whether to steal or not. In the end, they were interrogated and the reward was given to truth-tellers whereas liars were not.
The present scenario of the experiment in this paper is way different from the previous ones as here almost a real-life stealing act has been designed. Subjects were free to make their own decisions about stealing. Hence during interrogation, a feeling of committing a real crime is expected in the persons who stole.
Among all physiological parameters, the facial blood flow pattern is the most useful and could be obtained from the thermal image of the subjects. Deceivers experience two types of stress, i.e. (a) instantaneous and (b) sustained or prolonged. In both cases, there is an increase in blood flow to the face with specific and unique regions being active in each case. It has been observed that, if a person is subjected to instantaneous stress blood flow rate increases in the periorbital region and on the other hand if he/she is subjected to prolonged stress the blood flow rate increases in the forehead region [31,32].
Deceit detection using thermal imaging
Rajoub, et al. did a study in 2014 and observed that the temperature of the periorbital area of liars increased when they were answering specific questions about their actions but this change was not so remarkable for other nonspecific questions. Also, this was not found for the innocent persons [3]. The usefulness of statistical and machine learning techniques for the classification of differences in responses in true and false cases was studied by Pollina, et al. and Gunes, et al. [13,33]. Meta- analysis of different studies has shown that the accuracy of lie detection ranges from 84% to 91.7% [3, 7, 8,13].
Deceit detection using speech signal
People speak lies due to many reasons, for example, some people lie to avoid conflict in social interaction, and some people lie to protect themselves [34]. During interrogation, a person can lie to avoid punishment. Many studies have been done to date to detect deception based on human perception as well as by using non- verbal cues such as facial expression, eye gaze, body movement, thermal imaging, and many more [35,36]. Researchers assume that these cues may leak when a person lies. Usually, people who detect deception based on non-verbal cues pay less attention to verbal cues. However, some researchers showed that verbal (speech-related) cues are also a good indicator to detect deception by identifying the emotions that are present in the audio channel [19, 22-26]. In a previous study, it was observed that the police usually pay more attention to non-verbal cues than verbal cues, and this results in a less accurate recognition of deception [37].In this paper, we are using both verbal and non-verbal cues to detect deception during interrogation.
This paper has the following contributions
• The uniqueness of the present study is the experimental procedure. In contrast to the previous studies, where a mock crime scenario is created, the present study has created a scenario of natural stealing.
• The subjects of the present study are taken from the local area with a habit of minor crimes like pickpocketing. According to their past record, they have a strong tendency of stealing. This has been done in cognizance with the local police and the hospital management, which has the ethical approval to experiment on human subjects.
• The recording devices like thermal camera and voice recorder are kept in a concealed manner so that they won’t affect the natural expression of the subject.
• In this work, we have implemented an algorithm that tracks the ROI in the face taking care of the movements of the head of the subjects unlike [7] who had carried out the analysis of blood flow rate assuming a completely stationary subject for a very short period of time.
This paper has been organized as follows. Section 3 discusses the design of the experiment, protocol, and experimental setup. The methodology followed for the detection of deceit is given in section 4. Section 5 describes the result. Section 6 is the discussion and the conclusion is given in section 7.
Experimental design
The experiment for the present study has been conducted at Midnapore Medical College and Hospital, West Bengal, India. The police department has been requested to bring these people for the study. The protocol of the experiment has been designed in such a way that both medical checkup and acts of stealing could happen simultaneously. The police department has identified the persons, habitually involved in small crimes such as pick pocketing or stealing, as subjects for the experiment. A real scenario has been staged, where the subjects get the opportunity to pick up cash left in the waiting room. The experiment has been approved by the ethical committee of the medical college. The subjects are brought under the plea of free and routine medical checkup to the hospital at different instances, so that they would not interact amongst each other. Each of them is left alone for some time in a waiting room before they go through a sequence of interactive processes.
Selection of subjects
A total number of 28 male subjects, in the age group of 18 to 40 years, without any serious medical conditions have participated in the study. Before the experiment each of the subjects is made aware that he would have a free health checkup in the hospital. The General Health Questionnaire (GHQ) tests are carried out to exclude any mental or physical illness. The subjects have been informed about an interactive session followed by a free health checkup. The individuals who agreed on his own are asked to wait till he is invited to the next room.
Ethical approval
Approval of the protocol has been obtained from the ethical committee of the Midnapore medical college and the hospital before the study. It is clearly explained to all the participants that at any stage if they do not feel at ease, they could quit. Free health checkup is carried out before the interrogation session, irrespective of the subject’s willingness to participate in the complete process. After completion, the subjects are made aware of the experiment and a written consent is obtained for the future use of their data for the research work.
Experiment protocol
The subjects involved in this study are from a very modest socioeconomic background. Thus the consent is easily obtained for the free health checkup prior to the experiment and to share the data when the experiment is completed. The flow chart for the experimental procedure is given in Figure 1.

Figure 1: The experimental flow chart.
The experiment has been divided into four stages:
Stage-1: Waiting Room (30 min): The subject comes and waits here for his turn. A scenario is created where by putting cash in a purse lying on the table, to lure the subject to steal cash.
Stage-2: Friendly interaction room (15 min): The subject is brought here for a very friendly and amicable interaction to know more about his life, family, hobbies, and health.
Stage-3: Interrogation room (15 min): In this room, a trained interrogator starts with some friendly notes and progressively asks tougher questions about the act of stealing in the waiting room. The thermal video is captured in a much concealed manner simultaneously. The interrogator is not aware of the stealing if it has taken place.
Stage-4: Reconciliation room (30 min): The subject is brought to the room and brought to ease and informed about the whole exercise. Tea and snacks are offered. A routine health checkup is carried out. Due compensation is paid for participating in the experiment.
As discussed earlier, a person’s body language is reflected on the skin surface temperature and this is captured by the thermal camera. It has been observed that when the friendly interaction changes gradually to interrogation, the emotional state also changes, which is reflected in the facial blood flow pattern. When the subject tries to conceal the truth, he tries to control his emotions, but at the same time, he is in stress because he knows that he is lying. Due to stress, there is increased blood flow to the forehead and periorbital area of the face. An increase in blood flow causes an increase in skin surface temperature and this is captured by thermal camera [23].
Experiment setup
The experiment is conducted in a closed temperature controlled environment with properly isolated rooms to avoid the distraction of subjects during the process. The setup is depicted in Figure 2 where the thermal camera and voice recorder are kept in a concealed manner. The table top resembles a typical doctor’s assets such as stethoscope, sphygmomanometer etc.

Figure 2: The interrogation room.
Recording devices
A portable thermal camera (Flir One pro USB C) has been used to record the facial images, with a frame rate of 2.5034 fps and resolution of 19200 pixels. The audio recording is carried out using a Sony voice recorder at a sampling rate of 44.1 kHz. The thermal camera was kept inside a box labelled as Medical instruments and the audio recorder below a newspaper. A small hole was made in the medical instrument for exposure of the lens of the camera. The temperature of the room was regulated at 22°C with the help of an air conditioner. The Illumination of the room is consistently and moderately maintained.
Inclusion, exclusion criteria for choosing the subject
Inclusion criteria: Subjects with normal/corrected vision and hearing ability have been chosen for the study. All subjects were of the male gender with an age limit between 18 to 40 years.
Exclusion criteria:
• Subjects with sleep disorders or any physiological illness as assessed by a physiologist.
• History of any head injury and colour blindness.
• Subjects who did not give consent.
This study is conducted for a total of 28 participants out of which 14 responses were true and 14 false.
Differentiation of truth and lie cases has been carried out by analyzing the thermal videos. At first, the video data were elucidated properly and then characterized. The main feature to differentiate between truths from lies is the blood flow rates which are assessed from the heat maps of different regions of the face. The block diagram of the methodology is given in Figure 3. As it is observed from the block diagram the first step is the selection of the Region of Interest (ROI) which comprises of the forehead and the periorbital region of the face. Then the second step is the tracking of the ROI using a proper algorithm discussed below. Then the blood flow rate is calculated in the ROI using the equation 6. The blood flow rate and frame number obtained from the algorithm are the input features to the SVM classifier. Finally, the SVM classifier separates the subjects into two categories, i.e., truth tellers and liars. All the methods, i.e., ROI tracking of the forehead and periorbital region of the face, the calculation of the blood flow rate in the ROI, and the use of Support Vector Machine in classifying the truth tellers and liars, have been described below. The blood flow rate in the forehead and periorbital regions has been analyzed separately. After reviewing the works of literature, it is inferred that increase in blood flow to the periorbital region is due to immediate stress while sustained stress causes an increase in blood flow in the forehead region.

Figure 3: Block diagram of the deceit detection system.
The analysis of the blood flow rate involves three parts, namely,
• Region of Interest (ROI) Tracking.
• Estimating the blood flow rate.
• Separating the Lie and Truth response using support vector machine (SVM) classifier.
Region of Interest (ROI) Tracking
The tracking of ROI is an important step towards finding the blood flow rate in a particular region. Here a method developed by Asvadi et al. [38] has been used for ROI tracking. The algorithm uses the RGB histogram of the ROI for tracking. It involves the creation of an object model, creation of the confident map, finding of the new centroid and updation of the object model. The obtained ROI in each frame is used to find the average blood flow rate at a particular frame or time.
Creation of the object model: An object model is created using the RGB histogram of the object and the background region. The object or the ROI is selected manually in the first frame as a rectangle. The object and surrounding rectangles are chosen in such a way that the number of pixels in the object region is the same as the number of pixels in the region surrounding the object. This can be done by choosing the width of the surrounding region as W = √2*w and height as H = √2*h as shown in Figure 4. Here w and h are the width and height of the selected object region. W and H are the width and height of the selected background rectangle. The selected object region is inside the solid red rectangle, and the surrounding background region is the area between the red and dashed black rectangles. In this figure, a sample ROI of the face is shown, but the actual ROI which is used in the algorithm are the forehead and periorbital region of the face.

Figure 4: Object and background rectangles selected from face where the red box shows a sample ROI.
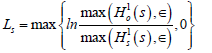
The object model is created by using the 3D joint RGB histogram of the object and background region. Quantized 3D joint RGB histogram is calculated for the regions representing the inner rectangle and the background area. The object model can be found out using the following relation
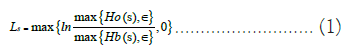
where Ho(s) is the histogram computed within the object rectangle, and Hb(s) is the histogram for background region. Here, 8 bins have been used in each channel for histogram quantization. So the index s ranges from 1 to 8^3 and 8^3 is the total number of histogram seeds. Here ϵ is set to 1.
Finding of confident map: The confident map M(xi, yi) created from the object model Ls from the object region as given below
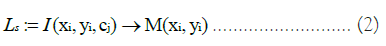
where (xi, yi) is the pixel location in the image coordinate and is the colour channel of image.
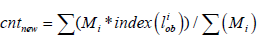
Finding the new centroid: This part of the algorithm relies on the fact that the change in the object location will not be ballistic. So the centre of the object rectangle is shifted to the centroid of the current confident map. The centre of the object rectangle is shifted from the old location (xi, yi) to new location (xnew, ynew) using the equation 3 and 4.
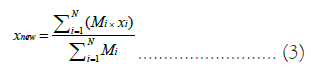
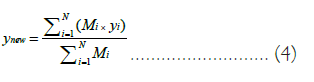
In this way the shifting of the object rectangle is continued till the mean shift in centroid is 2 or maximum number of iterations (here it is taken as 6) is reached. This is called mean shift convergence.
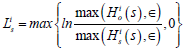
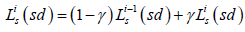
Updation of the model: When the object location at the present frame is determined using the mean shift, the positive log likelihood ratio


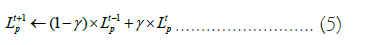
where t+1, t, and t-1 are indexes for the next, current and previous frames respectively. p indicates the randomly α percent selection of the positive log-likelihood ratio seeds s. Here α is set to 5%. γ is a forgetting factor which is set to 0.1.

The ROI is manually selected in the first frame and the object model, confident map, and centroid are calculated. For the subsequent frames the ROI is tracked by finding the confident map, finding the new centroid and updating the object model based on the detected ROI as given above. The tracking of the forehead region for a subject in intermittent frames is shown in Figure 5.

Figure 5: Tracking of forehead region in intermittent frames. The frames proceed left to right in each rows.
Blood flow rate
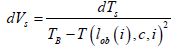
The blood flow rate is related to the temperature gradient by the relation
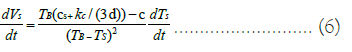
where,
CS=The heat capacity of skin.
VS is the blood flow rate at the skin level,
TB=310 K is the blood temperature at the body core,
TS is the skin temperature,
KC=0.168 kcal/m/h/K is the thermal conductivity of skin,
d=The depth of core temperature point from skin surface and C is a constant [7].
The average blood flow rate for each frame is computed using this equation (6). The initial blood flow rate is assumed to be zero.
The consolidated algorithm for the ROI selection and calculation of the blood flow rate is given in Algorithm-1. The blood flow rate of the forehead and periorbital region is analyzed separately.
Algorithm 1: Finding the blood flow rate steps
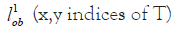
INPUT: Thermal video T(x,y,c,t)
OUTPUT: Blood flow rate (bfr)
1: Img = T (:,:,c,1)
2: Select rectangular ROI location:
3: Img = (Img / 256)×8
4: Surrounding location:

5: Background location:

6: Histogram of RGB object:

7: Histogram of RGB background:

8: ∈=1
9: Object model:
10: Find the centroid of

11: i =1
12: while i ≤ Lastframe do
13: i = i +1
14:

15: Img = T (:,:,c,i)
16: flag =1
17: while flag do
18: for all pixel in ls do
19: Confident Map: Mi (pixel) = Ls(R(pixel), G(pixel), B(pixel))
20: end for
21: Centroid:
22: Update object location

23: if cntnew-cnt<2 then
24: flag = 0
25: break
26: else
27: cnt = cntnew
28: end if
29: end while
30: Histogram of new RGB object:

31: Histogram of new RGB background:

32: Object model:
33: Model update
34: Temperature change:

35: Flow rate change:
36: Flow rate:
37: Average blood flow rate bfr = mean (Vs(i) )
38: end while
Support vector machine
SVM is an effective machine learning tool proposed by Vapnik et al. for binary classification problems [39]. In a two-class classifier, the goal is to find a hyperplane as shown in Figure 6 which separates the data points of each class while maximizing the distance between the two classes across the hyperplane.

Figure 6: Optimal Hyperplane separating the two distinct classes.
Mathematically, the hyperplane is represented by the equation
where W is the weight vector and b is the bias. The optimal hyper plane divides the data points(x) into two such that the data points of each class are on two sides of the plane. That is,
if WTx+b>0, x is in class 1
if WTx+b<0, x is in class 1
The output of Algorithm 1 for a thermal video of a subject gives the blood flow rate for each frame of the thermal video. Each of these outputs, i.e., blood flow rate and frame number together, is taken as a data point. The data points of all subjects are separated into lie and truth cases, and the hyperplane separating the two classes is found out using SVM.
Audio analysis for interrogation data
The information about the speaker’s affective state can also be determined by analyzing the voice. If a person is angry and does not wish to show it, he/she may show tiny expressions of anger that only stay for a short moment, or his/her voice may be altered, more strained, due to held back emotion. In literature, psychologists observed a significant correlation between deceptive behaviour and speech attributes such as loudness, pitch, pauses, and rhythm [19]. In addition to the thermal video analysis, we are using additional speech signal indicators for recognizing deception from the speech signal using prosody-based analysis. In a study, the authors showed that pitch is an indicator of deceit, and when people are being deceptive, they tend to increase their pitch [40]. This motivates us to analyze the pitch differences in the subject’s voice while telling the truth or lie. We have also analyzed the information related to the silent pauses and the voice intensity during deceiving (false) or non-deceiving (true). In this study, we have explored three basic aspects of speech prosody, i.e., information of silent pauses, pitch information, and intensity of speech as shown in Figure 7.

Figure 7: Speech attributes used to analyze the deception.
Information of silent pauses: We have analyzed the silent pauses pattern in both truth and false audio files. To extract the silence portions, we have used energy based Voice Activity Detector (VAD). At first, the speech files are normalized with respect to the maximum amplitude value.
Here, S∈RN represents the speech utterance and N = Fs*d denotes the total samples in the speech utterance with Fs=16 kHz and d is the speech utterance duration. Then the normalized speech utterances are divided into frames using Hanning window of 20 ms and hop length of 10 ms. Then on these frames energy based VAD is applied which decides if a frame contains silence (F=0) or speech (F=1). First, the energy EF (in dB) for each frame is calculated. Then the highest frame energy is denoted as Emax . A threshold value ETh (in dB) is then used to logically assess if any frame f contains silence:
The majority voting of frames is used for every 1 second of the audio segments. Each second of the input audio file is predicted as either having silence or speech portion.
In the database out of 28 participants, 14 responses were true and 14 were false. We have shown the silent pauses information for both true and false audio files in Figure 8. Interestingly, the plot shows that deceptive individuals tend to take more number of pauses than truthful individuals. For false audio files, silent pauses are more as compared to the true audio files. Deceptive individuals are more likely to use different strategies in frequent intervals to make a convincing impression on others. Due to this, they may experience a high cognitive load as compared with truth tellers [41]. This added cognitive strain can cause speech to be slower and contain more silent pauses for thinking. In some studies, the authors reported an increase in the silent pauses during lying [25,42,43].

Figure 8: Silent pauses (a) 14 True (b) 14 False audio files.
Pitch information: Pitch refers to the relative highness or lowness of the voice tone as perceived by the human ear. The acoustic correlate of pitch is the fundamental frequency (F0), which depends on the frequency of vocal cord vibrations during speech production. In order to measure pitch for voiced segments, we use energy based VAD as discussed above to obtain the speech and silent segments in the subject’s speech utterance for both true and false scenarios. We then extract the pitch from only speech regions of both the true and false recordings. Figure 9 depicts the histograms of the pitch estimations for the four true and four false audio recordings. As can be seen in this figure, the probability of getting a higher pitch value is more for false audio recordings as compared to the true audio recordings. It has been documented that increased pitch is one of the cues that people associate with deceptive speech [43,44]. An increase in average pitch during lying might be due to an increase in arousal during lying that leads to physiological responses in the body that are difficult to control [26,40]. In our database all the speakers are male, hence differences in the pitch values across females and males do not influence the pitch results shown in the figure.

Figure 9: Probability of the occurrence of the pitch values for true and false audio recordings. Note: (


Intensity of speech: In this experiment, we aim to analyze the intensity of the true and false speech audio recordings. In order to measure the intensity, we have divided the speech utterance into frames using a Hanning window of size 20 ms and hop length of 10 ms. Then we calculate the energy for each frame and take the average of energy values for all frames in an utterance.
The mean energy for each true and false audio file is represented in Figure 10. From the results, no specific pattern can be generalized for true and false scenarios. But in most of the cases, the intensity values for the false audio files are higher than that of true audio files. The trend revealed by our analysis coincides with the study done by Levitan, et al. [44], where the authors showed that on average speakers tended to speak with an increase in volume when lying [45].

Figure 10: Average intensity for (a) 14 True (b) 14 False speech audio recordings.
So far, we have conducted speech signal analysis to extract different prosody cues, pitch, silent pauses, and intensity information of the utterances and analyzed them individually. The individual prosody cues exhibit discriminating characteristics to detect the presence of deception in speech. Finally, to conclude this discussion, we have jointly considered all the three prosody cues and analyzed the deception discriminating characteristics. In Figure 11, we have used speech intensity, mean silence pauses, and pitch variations (pitch standard deviation (std.)) and plotted the scatter points for the true and false utterances. The figure clearly shows the efficiency of the explored speech-signal based cues to detect if the speaker is lying or not.

Figure 11: Scatter plot for the three different prosody-based features.
The data includes 14 cases of truth and 14 cases of lie, as shown in Table 1. The plot of the blood flow rate of the forehead and periorbital region of the subjects is shown in Figure 12. The hyperplane separating the truth and lie cases is shown using dotted lines. The plot shown in the figure consists of 100 frames in the thermal video. These 100 frames of the video are part of the hard interrogation. It can be observed from the graph of the forehead and the periorbital region that, except for the 3 cases, all have been properly separated by the separating hyperplane. The misclassification includes three lies in the forehead region and three lies in the periorbital region. Therefore the classification accuracy obtained is 89.28%. It is observed that there is a difference in the pattern of the rise of blood flow rate for lie and truth cases both in the periorbital and forehead region. For deceit cases, the rise is rapid whereas, for the truth cases, the rising rate in intensity is slow and smooth. Though the dotted line separates the truth and lie cases, it can be observed that there are some overlapping on the separating line during the initial frames. This is because the blood flow rate is calculated by taking the initial condition as zero. Also, it can be observed that separation of the truth and lie cases becomes evident as the interrogation progresses. This change of pattern of blood flow rate for deceit (rapidly increasing slope) vs. non-deceit (the moderately increasing slope) cases can be used to differentiate between the cases.
| Category | No of participants |
|---|---|
| The participants who stole and admitted about stealing | 6 (All true responses) |
| The participants who stole and did not admit about stealing | 14 (All false responses) |
| The participants who did not steal and did not admit about stealing | 8 (All true responses) |

Figure 12: Graph showing support vector machine classification of lie and truth.
We have compared the proposed method with previous work. Pavlidis, et al. [7] classified the subjects into deceptive and truthful groups by finding the slope products of the blood flow rate curves. If the slope product (in angle) crosses a threshold value then it is classified as deceptive else it is considered as truth. We also implemented this method in our own database and compared the values of Recall, Precision, F1 score, and accuracy by both methods. The results are provided in Table 2.
| Periorbital region | Forehead region | |||
|---|---|---|---|---|
| Pavlidis method [7] | Proposed method | Pavlidis method [7] | Proposed method | |
| Recall | 0.5 | 0.785 | 0.21 | 0.785 |
| Precision | 0.46 | 1 | 0.75 | 1 |
| F1 score | 0.48 | 0.88 | 0.33 | 0.88 |
| Accuracy | 46.42% | 89.28% | 57.14% | 89.28% |
The present work has the experimental design of a real act of stealing. Most of the studies have carried out a mock crime scenario. The participants have been asked to enact, whereas in the present study it has been kept natural. The thermal camera recordings have been done in a concealed way so that the participants are least affected during the interaction. Due to their natural behavior, expression is better reflected and captured by the thermal camera. A pilot study has also been carried out in 2019 by the author with 10 subjects [45].
The participants are real-life habitual stealers, unlike the previous works. It is observed that seventy percent of the 28 participants stole during the experiment. The fact that 70 percent of people stole shows that the participants are habitual offenders and make the database unique.
This work also includes the analysis of the speech of the subjects during the interrogation. The three deception cues namely silent pauses, pitch, and intensity of the speech of the participants have been analyzed. It is found that deceptive subjects are more inclined to take silent pauses in their speech while being interrogated than the truth tellers. It is also found that deceptive individuals have a higher average pitch in their speech than truth tellers.
In this study, a novel method for lie detection is conducted based on the difference in responses of the deceptive and non-deceptive subjects. This study is unique because in all the studies done before have used a mock crime scenario to simulate guilt and lying whereas we have used a real life crime scenario. This resulted in a procedure where natural stealing has been conducted. Simultaneous analysis of speech is also done and added to the thermal video analysis results to get a more convincing result.
First of all, we would like to show our gratitude to concerned staffs of Midnapore Medical College and Hospital for their support in arranging the experiment. Secondly, we would like to thank the local security of Midnapore Medical College for arranging the subjects.
There was no funding for the research reported.
None to report
[CrossRef] [Google Scholar] [PubMed]
[CrossRef] [Google Scholar] [PubMed]
[CrossRef] [Google Scholar] [PubMed]
[CrossRef] [Google Scholar] [PubMed]
[CrossRef] [Google Scholar] [PubMed]
[Google Scholar] [PubMed]
[CrossRef] [Google Scholar] [PubMed]
[CrossRef] [Google Scholar] [PubMed]
[CrossRef] [Google Scholar] [PubMed]
[CrossRef] [Google Scholar] [PubMed]
[Google Scholar] [PubMed]
[CrossRef] [Google Scholar] [PubMed]
[CrossRef] [Google Scholar] [PubMed]
Citation: Satpathi S, Kumawat P, Routray A, Satpathi SP (2022) Integrated Analysis of Speech and Thermal Videos during Interactive Sessions for Detection of Deceit. Social and Crimonol. 10: 255.
Received: 14-Oct-2022, Manuscript No. SCOA-22-19607; Editor assigned: 17-Oct-2022, Pre QC No. SCOA-22-19607 (PQ); Reviewed: 01-Nov-2022, QC No. SCOA-22-19607; Revised: 08-Nov-2022, Manuscript No. SCOA-22-19607 (R); Published: 15-Nov-2022 , DOI: 10.35248/2375-4435.22.10.255
Copyright: © 2022 Satpathi S, et al. This is an open-access article distributed under the terms of the Creative Commons Attribution License, which permits unrestricted use, distribution, and reproduction in any medium, provided the original author and source are credited.