Journal of Ergonomics
Open Access
ISSN: 2165-7556
ISSN: 2165-7556
Research Article - (2017) Volume 7, Issue 6
The impact of thermo-hydric behavior of underwears were studied on comfort. The Pearson method is used to make a correlation between physical and thermo-hydric properties of fabrics. Three parts have been studied, i.e. (i) thermal properties, (ii) hydric properties, and (iii) coupling between thermal and hydric properties. It has been observed that thermal properties are affected by porosity, moisture regain and fabric density; hydric properties are influenced by fabric weight, thickness, air permeability and density. The last parameter, related on the coupling effect, depends on fabric weight, porosity, moisture regain, air permeability and density. The sorption properties of the various textile fabrics in variable wet environment have been studied with dynamic vapor sorption apparatus (DVS). From the fitting of the sorption isotherm curves with the Park’s model, it was established the kind of fibers are the main factors influencing each component of this one.
Keywords: Thermal comfort; Heat and mass transfer; Park model
The comfort can be defined as a pleasant state of physical, physiological, and psychological harmony between a human and its environment [1]. The physical comfort is influenced by tactile and thermal sensations related on interactions between skin and immediate environment. This process provides various stimuli, such as warm/cool, touch, pressure and wetness, to the sensory organs of the human body which generates neurophysiologic impulses. Indeed, adjustment of sweating rate, blood flow (vasodilatation, vasoconstriction), shivering, and heat production allow the body to maintain a constant internal body temperature of 37°C. Thus, the physiological comfort concerns the thermoregulatory response of the body to the human-environment interaction. The brain receives skin sensory responses and generates a subjective perception of sensations. The analysis of them is mainly based on the past experiences depending to environmental, social and cultural factors. Therefore, the human psychological perception results from complex relationships between individual sensory stimuli received by brain. In addition to environment, the thermo-hydric comfort of the wearer depends on the clothing, which is an obstacle to the heat and mass transfers, and its activity level [2]. Heat and mass transfers through clothing are divided into transportation in an air gap between skin and clothing, which is called microclimate, transportation inside the clothing and convection from the outer surface of clothes to the environment [3]. Heat transfer through textile is mainly related on conductive, convective and radiative heat transfer mechanisms [4,5]. In the case of sedentary activities, transport of water molecules into fabric is governed by different mechanisms, i.e. evaporation, sorption, desorption, diffusion, condensation [4,6,7].
The thermal and moisture management properties of textile materials depend on several factors, i.e the fiber, yarns, and fabrics characteristics. Thus, the thermal comfort in steady state is mainly influenced by the relative porosity and moisture regain, which affect the first contact feeling, thermal conductivities and moisture permeability [8]. The entrapped air governs mainly the thermal insulation of fabric and the amount of air entrapped into a thicker fabric is higher. Furthermore, thickness increases the resistance to the transfer of heat and moisture due to the presence of large amount of excess air rather compared to the fiber content. According to Yoon and Buckley [9], the air permeability, the thermal resistance and the water vapor resistances of fabrics made of polyester, cotton and polyester/cotton blend are mainly influenced by the thickness and the porosity. Soshani and Shaltiel [10] have observed that the thermal insulation increases with decreasing the fabric density. The air motion in the fabric related on the convection affect the heat and moisture transfers, and depends mainly on the pore size and permeability of the fabric layer. Pac et al. [11] have investigated the influence of yarn and fabric structures on friction behavior in order to measure the warm-cool feeling. The fabric has warmer feeling when the interfacial contact area between skin and textile is small for rough fabric. Furthermore, the study conducted by Hes [12] related on the first thermal contact illustrates the impact of the PES fibers in a blend with cotton ones for a woven shirts application. Thus, the increase of PES amount leads to an unpleasant cool feeling; even if, a blend of cotton/PES may present good thermal contact comfort in the wet state. Özdil [13] found that increasing yarn twist and yarn count of knitted fabrics (1 × 1 rib) decreases thermal resistance and increases water vapor permeability. Besides, liquid water transport depends on the nature of fiber used. Then, according to Yoon and Buckley [9], an ideal clothing fabric possesses a high value of thermal resistance for protection from cold weather, a low water vapor resistance for efficient heat transfer under soft thermal stress condition and a rapid liquid transport characteristics for transferring heat and eliminating unpleasant tactile sensations.
Thermophysiological correlations may be established from textile measurements under well controlled energy-exchange conditions, such as sweating hot plate apparatus, instrumented manikins, human tests, and also moisture management tester are used to characterise the liquid transfer properties. On the one hand, a literature survey showed a renewed interest in the understanding of the themo-hydric behaviours of textile materials and the relationship between these behaviours and physical properties in order to develop new textile materials. On the other hand, these measurements realized under steady-state condition do not bring sufficient information about the water vapor sorption or desorption behaviour. According to Markova et al., dynamic vapor sorption (DVS) is a suitable technique to study the moisture sorption/ desorption and the interaction of water molecules with a material [14]. The obtained isotherm data over a wide relative humidity (RH) range allows to understand the evaluation of hydric properties of the materials. Up to now, most of the materials successfully tested have a high hygroscopic degree under fibrous or non-fibrous form, i.e. natural fibers like flax [15-18], alfa [19], agave [20], and cellulosic fibers [21-24]. The description of isotherm at each RH step allows the interpretation of parameters extracted from the model, and most of the time the amount of absorbed water is closely related to the chemical composition of the tested material.
In this study, the purpose is not only to collect experimental data about the heat and mass transfers through a selected group of underwear fabrics made of synthetic fibers, but also to investigate the water vapor sorption/desorption with DVS apparatus. Thus, the first part of this study focuses on the relationship between physical properties of textile materials, i.e. fabric weigh, thickness, porosity, moisture regain, air permeability, density, and their thermo-hydric behaviors, i.e. thermal resistance, thermal conductivity, thermal effusivity, over all moisture management capacity (OMMC). This relationship was explained with Pearson’s correlation. The second part is interested in sorption behaviour of textile materials by using DVS apparatus and modelling it with the Park model.
Materials
In this study, three types of commercially available underwear, obtained from Damart (France) and designed for daily life use, were used (Table 1). Three 1x1 interlock samples which differed essentially in their composition were studied, i.e (i) sample (A) is a blend of polyester (high quantity) (PES) and polyacrylic fibers; (ii) sample (B) is a blend of polyacrylic and moisture sensible synthetic fibers; and (iii) sample (C) is a blend of polyester (low quantity), polyacrylic and moisture sensible synthetic fibers. Sample (B) contains more moisture sensible synthetic fiber than the sample (C).
| Sample code | Fabric design | Fabric weight (kg.m-2) | Thickness (mm) | Density (kg.m-3) | Moisture regain (%) |
|---|---|---|---|---|---|
| A | 1 x 1 interlock | 0.214 ± 0.002 | 1.31 ± 0.03 | 165 ± 4 | 1.75 |
| B | 1 x 1 interlock | 0.156 ± 0.004 | 1.22 ± 0.08 | 128 ± 6 | 5.18 |
| C | 1 x 1 interlock | 0.157 ± 0.002 | 1.09 ± 0.06 | 143 ± 4 | 3.36 |
Table 1: Description of test samples.
Methods
The correlation between different fabric traits was determined using Pearson correlation coefficients (XLSTAT software). Traits used were,
• Fabric weight (kg.m-2)
• Thickness (mm)
• Density (kg.m-3)
• Porosity (%)
• Air permeability (l.m-2.s-1)
• Moisture regain (%)
Pearson correlation coefficients measure the strength of a linear association between two continuous variables. Values can range from -1 to 1. A value of 1 shows that the correlation between two variables is perfect and positive; -1 shows perfect negative correlation; 0 shows no correlation.
Relative porosity: The relative porosity is the total volume of void space within a specified area of the fabric. It is calculated with Equation (1).
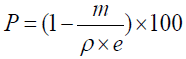 (1)
(1)
With P is the relative porosity (%), m is the fabric weight according to BS EN 12127:1998 (g.m-2) [25], ρ is the fiber density (g.m-3), and e is the fabric thickness according to ISO 5084:1996 (m) [26].
Air permeability: The air permeability is determined with the FX3300 device (Textest, Switzerland) according to ISO 9237:1995 [27]. It corresponds to an air flow passing perpendicularly through a fabric area of 20 cm2 by measuring at a given pressure (100 Pa) its difference across the fabric test area over a given time.
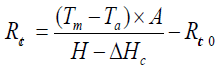
Thermal and water vapor resistances: The sweating guarded hotplate, also called Skin model, was used to measure the thermophysiological properties/thermo-hydric behaviours of clothing, i.e. thermal and water vapor resistances of fabric in steady-state conditions according to ISO 11092:2014 [28]. For the measurement of the thermal resistance, representative of heat insulation, the sample is placed above the measuring unit of the sweating guarded hot plate. The sweating guarded hotplate is a porous steel plate where an air ducted of 1±0.05 m.s-1 flows across and parallel to the upper surface of fabric. It is electrically heated at 35°C to simulate the skin temperature at the surface and maintained at this temperature during the whole test. Ambient conditions settled for the determination of thermal resistances are 20 ± 0.1°C and 65 ± 3% RH. This parameter is calculated using Equation (2).
 (2)
(2)
With Rct is the thermal resistance (m2.K.W-1), Tm is the temperature of the measuring unit (K), Ta is the air temperature in the test enclosure (K), A is the area of the measuring unit (m2), H is the heating power supplied to the measuring unit (W), while ΔHc is the correction term for heating power (W), and Rct0 (m2.K.W-1) is the apparatus constant determined as the « bare plate » value (m2.Pa.W-1).
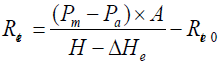
The water vapor resistance is the capacity of the fabric to let the water vapor pass through it. For its measurement, the measuring unit is covered by a water vapor permeable and liquid-water impermeable membrane. Water is supplied by channels beneath the hotplate. Then the water evaporates through pores of the plate like sweat at the surface of the skin. Standard conditions for the measurement of this parameter are 35 ± 0.1°C and 40 ± 3% RH. The water vapor resistance is calculated according to Equation (3).
 (3)
(3)
With Ret is the water vapor resistance (m2.Pa.W-1), Pm is the water vapor partial pressure (Pa) at the surface of the measuring unit at temperature Tm, Pa is the saturation water vapor pressure (Pa) of the air in the test enclosure at temperature Ta, A is the area of the measuring unit (m2), H is the heating power supplied to the measuring unit (W), while ΔHe is the correction term for heating power (W), and Ret0 (m2. Pa.W-1) is the apparatus constant determined as the « bare plate » value (m2.Pa.W-1).
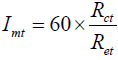
The water vapor permeability index (Imt) measures the material ability to transmit water vapor from the body and gives information about the breathability of fabrics. This parameter is calculated from Equation (4) with thermal resistance (Equation (2)) and water vapor resistance (Equation (3)). It varies between 0 (impermeable fabric) and 1 (permeable fabric).
 (4)
(4)
With Imt is the water vapor permeability index (dimensionless), Rct is the thermal resistance (m2.K.W-1), and Ret is the water vapor resistance (m2.Pa.W-1).
Thermal conductivity and effusivity: Hot Disk is composed of a thin disk-shaped sensor which behaves like a heater and measures at the same time the temperature. This sensor is placed between two half parts of a fabric. During the test, the increase of the resistance of the sensor allows to determine the thermal conductivity and effusivity according to ISO 22007-2:2015 [29]. The heating power is settled at 1 MW with a period time of 5 seconds. Equation (5) shows the relationship between thermal conductivity and thermal resistance.
 (5)
(5)
With λ is the thermal conductivity (W.m-1.K-1), Rct is the thermal resistance (m2.K.W-1), and e is the thickness (m).
Thermal effusivity presents the first thermal contact feeling. Equation (6) expresses the correlation between thermal conductivity and effusivity.
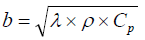 (6)
(6)
With b is the thermal effusivity (J.m-2.K-1.s-1/2), ρ is the density (kg. m-3), Cp is the specific heat capacity (J.kg-1.K-1), and λ is the thermal conductivity (W.m-1.K-1).
Moisture management properties: The determination of Overall Moisture Management Capacity (OMMC) of fabrics is evaluated by a Moisture Management Tester (MMT) (Atlas, UK) according to AATCC 195-2009. This device measures the transport of liquid water in dynamic and toward several directions [30]: spreading outward on the top (inner) surface of the fabric, transferring through the fabric from the top surface to the bottom (outer) surface, spreading outward on the bottom surface of the fabric. Electrical resistance at the surface of textile is altered when the rate of water at its surface fluctuates. This resistance is influenced by the electrical conductivity of the solution and the quantity of water trapped into the sample [31].
The fabric, with a dimension of 8.0 × 8.0 ± 0.1 cm2, is placed between two concentric sensors after a conditioning at 65 ± 4% RH and 20 ± 2°C. The liquid solution, which simulates the sweat, is composed of sodium chloride with a conductivity of 16.09 mS. A quantity of 0.21 × 0.01 g is introduced at the top plate during the first 20 seconds of the test (total length of 120 seconds).
The MMT device can measure several indices describe in the standard, i.e. wetting time (WT), absorption rate (AR), maximum wetted radius (MWR), spreading speed (SS), accumulative one-way transport index (R) and overall moisture management capability (OMMC).
Dynamic vapor sorption
Description: The dynamic vapor sorption apparatus measures the water vapor sorption and desorption of textile materials. Between 12 and 29 mg of textile material is placed onto a sample holder. Changing in mass during the test is recorded by an electrical balance (SMS Ultrabalance™, UK) with an accuracy of ± 0.1 μg. The temperature is maintained constant at 35°C ± 0.1°C for simulate the skin temperature. The relative humidity is modified by step of 10% RH between 0 and 90% RH, with a step of 5% RH between 90 and 95% RH and then with a step of 3% RH between 95 and 98% RH. During desorption, the same protocol is used. The sample is maintained at a constant RH step until the rate change in mass was less than 0.005% per minute over a minimum of 10 minutes period and a maximum of 360 minutes. Data are acquired every 20 seconds. An hysteresis appears between sorption and desorption cycles. It is calculated as the difference between MDesorption (%) and Msorption (%) which represent respectively the quantity of water taken or released by textile materials at each RH step according to Equation (7).
 (7)
(7)
Park model
The Park model is applied to DVS in order to modelize the sorption isotherm. Three mechanisms are described by this model. The water activity aw is defined as the ratio of vapor pressure of water in a material to the vapor pressure of pure water at the same temperature. The first term of Equation (8) concerns the Langmuir sorption for the water activity inferior to 0.1. Water molecules are sorbed on specific hydrophilic sites which are available in the periphery of fibers. The second term shows the sorption of water molecules between 0.1 ≤ aw ≤ 0.7 (Henry’s sorption). The moisture content increases linearly with the water activity. At high water activity (aw ≥ 0.8), the last term represents the formation of water-molecule aggregation or clustering into the fabric, it is modeled with a power function [20]. The Park model is defined in Equation (8).
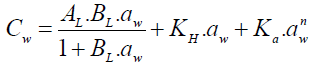 (8)
(8)
With AL is the concentration of specific sorption sites like hydroxyl groups on polymer surface (Langmuir capacity constant), BL is the affinity constant for these specific sorption sites (Langmuir affinity constant), KH is the Henry’s solubility constant related to the slope of the sorption isotherm, Ka is an equilibrium constant for the clustering reaction, and n is the mean number of water molecules per cluster.
To evaluate the precision of the fit, the mean relative percentage deviation modulus is calculated by Equation (9). A value of E below 10% reveals a good fit of the sorption isotherm.
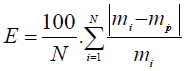 (9)
(9)
With mi is the experimental value, mpi is the computed value, and N is the number of experimental points.
Influence of the fabric design on physical properties
The porosity of a given fabric can be considered as one of the most important factors affecting the main physical characteristics of the fabric, i.e. air permeability, thermal and moisture management properties. In most of cases, the correlation between this static property with the others dynamic properties is not simple. In fact, the relative porosity depends mainly on the structural parameters of the fabric design, i.e. pores and inter-thread channels and therefore to the bulk density. In this study, air permeability increases with increasing porosity as samples have the same fabric design. Thus, it conducts to a rise of the thermal resistance, and therefore a decrease of the thermal conductivity (Table 2).
| Sample code | Relative porosity (%) | Air permeability (l.m-2.s-1) | Thermal resistance (m2.K.W-1) | Thermal conductivity (W.m-1.K-1) | Thermal effusivity (mm2.s-1) | Water vapour resistance (m2.Pa.W-1) | Water vapour permeability index (dimensionless) | Overall moisture management capacity (dimensionless) |
|---|---|---|---|---|---|---|---|---|
| A | 87.7 ± 2.9 | 1059 ± 73 | 0.0315 | 0.086 ± 0.002 | 0.348 ± 0.008 | 4.47 | 0.42 | 0.20 ± 0.02 |
| B | 89.4 ± 8.5 | 1311 ± 60 | 0.039 | 0.083 ± 0.001 | 0.357 ± 0.050 | 3.87 | 0.6 | 0.32 ± 0.02 |
| C | 88.5 ± 6.1 | 1163 ± 28 | 0.035 | 0.085 ± 0.004 | 0.344 ± 0.044 | 3.85 | 0.55 | 0.39 ± 0.02 |
Table 2: Thermal and hydric properties of samples obtain from different methods.
Bedek et al. found that the most significant variables affecting the moisture regain properties of fabrics is the fiber composition [8]. As presented in Table 1, the moisture regain of the sample increases with increasing proportion of moisture sensible synthetic fiber, i.e. sample (B) > sample (C) > sample (A), which can be explained by increasing water absorbing groups.
Thermophysiological properties
The aim to investigate the fabric underwear properties is to determine the main contributions of variables to the heat and moisture transfers in steady and transient state. Measurements of heat and moisture properties are given in Table 2, and the Pearson correlation coefficients between these variables and underwear properties are listed in Table 3.
| Textile properties | Rct | λ | b | Ret | OMMC | Imt |
|---|---|---|---|---|---|---|
| Fabric weight | -0.852 | 0.815 | -0.219 | 0.999 | -0.94 | -0.951 |
| Thickness | 0.398 | 0.334 | 0.381 | 0.841 | -0.965 | -0.602 |
| Density | -0.989 | 0.977 | -0.584 | -0.903 | -0.731 | -0.996 |
| Porosity | 0.999 | -0.998 | 0.699 | -0.829 | 0.621 | 0.971 |
| Air permeability | 0.998 | -0.999 | 0.74 | -0.794 | 0.574 | 0.955 |
| Moisture regain | 0.999 | -0.997 | 0.695 | -0.832 | 0.625 | 0.973 |
Table 3: Pearson's correlation coefficients between thermo-hydric properties and textile properties.
The thermal effusivity of the three tested samples, characterizing the transient thermal feeling during the first contact, was affected by their relative porosity as well as their moisture regain values (Tables 1 and 2) in regard to their related to the fiber chemical nature or composition. Thus, samples having the lowest moisture regain, A and C, have the lower thermal effusivity value, inducing warmer feeling. Fabric labelled B shows the coolest feeling with higher moisture regain. Even if, thermal effusivity is correlated to thermal conductivity (Equation (6)), the narrow range of the thermal conductivity values of the various samples cannot be taken into account for the variation of the measured value of the first contact feeling. Therefore, the main parameter explaining the variation range is the density of fabrics and also the specific heat capacity, which are function of the composition of the blends used to manufacture the textile samples.
The thermal conductivity depends on density, porosity, air permeability and moisture regain (Figure 1a and 1b). When the amount of fibers increases in the unit area, the amount of air decreases as the fabric weight or density increases. Therefore, this is related to the amount of air entrapped in the structure, since the thermal conductivity of the fibers is higher than the entrapped air one. Thermal conductivity of the samples is not directly correlated to moisture regain. The variation of moisture regain values between the fabrics indicates a different amount of moisture sensible fibers in the blends, with a lower thermal conductivity than the acrylic and PES ones.

Figure 1: (a) Influence of density and moisture regain on thermal conductivity, (b) Influence of porosity and air permeability on thermal conductivity.
Steady state heat and vapor transmission: Measured properties related to heat and vapor transfers under steady-state conditions are given in Table 2. The dry heat resistance or Rct is generally related to the thermal conductivity of the fibers, fabric thickness, and also dependents on the relative porosity (Figure 2a) and to a lesser extent to the moisture regain as shown in Figure 2b. This surprising correlation found in Table 3 is undoubtedly more related to the inner chemical structure of certain fibers in the blend than the intrinsic moisture regain value. Nevertheless, it was found that the PES based samples have the lowest Rct than the other sample. Furthermore, Pearson correlation analysis conducted to determine eventual relationship between the results of guarded hot plate and the other tests do not allow finding a specific correlation between Rct and fabric thickness, since the fabric weight values vary in a too large extent. Thus, Rct is correlated to the density of the various samples (Figure 2a). On the other hand, for the interlock 1 x 1 constructions, the underwear fabrics with the highest air permeability value are those with the better thermal conductivity and also give warmer feeling.

Figure 2: (a) Influence of density and moisture regain on thermal resistance, (b) Influence of porosity and air permeability on thermal resistance.
The evaporative thermal resistance, Ret, measured with the guarded sweating hot plate, is correlated to the fabric weight (and density) and to a lesser extent to the thickness and the moisture regains (Figure 3). These observations are consistent with the fact the underwear samples containing moisture sensible fibers have higher moisture regain values than the other, which leads to increase the vapor absorption as well as the vapor permeability of the fabric.

Figure 3: Influence of fabric weight and density on water vapor resistance.
The water-vapor permeability index, Imt, giving some relevant information about the breathability of the samples, is mainly influenced by the fabric weight (and density), porosity, air permeability and moisture regain (Table 3). In this study, Imt values range from 0.42 to 0.60, which is higher than the value for an optimal comfort (0.30) [32]. The closest value was obtained for the sample A regarding its high fabric weight and thickness. Furthermore, the evolution of the Imt value seems more dependent to the variation of Rct values than the Ret ones. All the samples are also suitable to lead thermal comfort, since the relatively high value of Imt can be considered as the starting point to allow sweat evaporation and therefore avoid moisture accumulation in the inner part of the fabric. Furthermore, the presence of relevant correlation between Imt and most of textile properties has been found: the thermal comfort on steady evaluates with increasing air permeability, moisture regain and decreasing thermal conductivity.
Moisture management properties: The Overall Moisture Management Capacity (OMMC) index indicates the capacity of fabrics to manage and transfer liquid. Results obtained from the MMT apparatus are summarized in Table 4, and it can be observed that samples containing moisture sensible fibers have a higher OMMC index than the sample A. Thus, the fabric composition influences the moisture management properties (Figure 4a and 4b).
| Sample code | WTTop (s) | WTBottom (s) | ARTop (%.s-1) | ARBottom (%.s-1) | MWRTop (mm) | MWRBottom (mm) | SSTop (mm.s-1) | SSBottom (mm.s-1) | R (%) | OMMC |
|---|---|---|---|---|---|---|---|---|---|---|
| A | 9.2 ± 4.1 | 9.8 ± 2.6 | 63.7 ± 7.8 | 73.2 ± 14.9 | 13.0 ± 2.9 | 12.0 ± 2.9 | 1.1 ± 0.5 | 1.0 ± 0.4 | -84.8 ± 67.3 | 0.20 ± 0.02 |
| B | 7.2 ± 2.0 | 7.2 ± 2.0 | 49.2 ± 4.9 | 75.8 ± 9.9 | 20.0 ± 0.0 | 20.0 ± 0.0 | 2.0 ± 0.2 | 2.0 ± 0.2 | 1.4 ± 17.7 | 0.32 ± 0.02 |
| C | 3.6 ± 0.5 | 3.7 ± 0.8 | 58.2 ± 2.1 | 57.2 ± 2.4 | 25.0 ± 0.0 | 25.0 ± 0.0 | 4.2 ± 0.2 | 4.1 ± 0.4 | -43.7 ± 20.4 | 0.39 ± 0.02 |
Table 4: Moisture management properties of fabrics.

Figure 4: Samples A, B, C (a) hydric transfers, (b) maximum wetted radius.
The sample A has the lowest liquid overall moisture management capacity (0.20 ± 0.02). The liquid passes through the fabric without wetting it because of low spreading speed value and wetted radii. Besides, wetting time and absorption rate are high, also the one-way transport capacity is low. Thus, the fabric absorbs slowly the liquid and transfers it through the textile, and therefore the drying should be slowly. Sample B possesses a low wetting time and a medium absorption rate, which allows a faster absorption. The spreading speed and the wetted radii are medium, and the one-way transport capacity is the higher. Thus, the liquid absorbed is removed from the fabric to the environment. The sample C has the highest OMMC value and wetting radii, the wetting time is the lowest, the one-way transport capacity and spreading speed are medium. Thus, the liquid diffuses quickly into the fabric to be widely spread at the outer surface. Then, liquid can transfer from the inner surface to the outer.
The correlation between moisture management properties and textile properties is shown in Table 5. Wetting times (top and bottom) of samples are influenced by the thickness of fabric. A thick fabric takes more time to start to get wetted than a thin one. Absorption rate measuring at the top surface during the pump time is correlated positively with density. Indeed, if a high quantity of fibers composed the fabric, the absorption capacity is higher. This moisture management parameter is also negatively correlated with porosity, air permeability and moisture regain. Liquid is easily transferred through the fabric when values of porosity and air permeability are important. In this way, less liquid is sorb directly on fibers and by consequence the absorption rate is lower. Absorption rate (%.s-1) depends on the chemical nature of fibers of the fabric. For sample A, which contains high quantity PES fibers, the liquid is taken quickly in little quantity, so the time of sorption is low. In contrary, for fibers highly sensible to moisture, the time of sorption is higher, and by consequence the absorption rate is low during the pump time even if the moisture regain of sample B is the most important. Maximum wetted radii (bottom and top) increases when fabric weight and thickness decrease. High quantity of fibers per meter absorbs water and diminishes the wetting area into the fabric. Similarly, spreading speed values (bottom and top) are correlated negatively with the thickness that confirmed the previous affirmation. The accumulative one way transport index increases with porosity and air permeability because liquid is easily transport through the fabric without being sorbed totally by fibers. A high value of moisture regain raises the diffusion of water into the fabric and by consequence the liquid is transferred to the outer surface. Besides, if the fabric is too dense, it will be difficult for liquid to pass by fabric because of low porosity. Thus, the liquid is carry out of the fabric slowly.
| Textile properties | WTTop | WTBottom | ARTop | ARBottom | MWRTop | MWRBottom | SSTop | SSBottom | R |
|---|---|---|---|---|---|---|---|---|---|
| Fabric weight | 0.766 | 0.814 | 0.796 | 0.373 | -0.905 | -0.920 | -0.716 | -0.740 | -0.858 |
| Thickness | 0.996 | 1.000 | 0.304 | 0.838 | -0.985 | -0.978 | -0.987 | -0.992 | -0.408 |
| Density | 0.442 | 0.511 | 0.972 | -0.032 | -0.657 | -0.684 | -0.375 | -0.407 | -0.992 |
| Porosity | -0.317 | -0.390 | -0.995 | 0.166 | 0.549 | 0.580 | 0.246 | 0.280 | 1.000 |
| Air permeability | -0.258 | -0.333 | -0.999 | 0.227 | 0.497 | 0.528 | 0.186 | 0.220 | 0.997 |
| Moisture regain | -0.319 | -0.392 | -0.995 | 0.164 | 0.551 | 0.581 | 0.248 | 0.282 | 1.000 |
Table 5: Pearson's correlation coefficients between moisture management properties and textile properties.
Then, the OMMC depends by definition to the the moisture absorption rate and the spreading speed at bottom side, and the oneway transport capability. According to Table 3, OMMC are strongly negatively correlated to thickness like bottom spreading speed values and fabric weight (Figure 5). A fabric with low thickness and fabric weight possesses a good capability to manage the transport of liquid moisture.

Figure 5: Influence of fabric weight and thickness on overall moisture management capacity.
Dynamic vapor Sorption
Moisture sorption properties: Water sorption in clothing assembly is one of the important characteristics of these materials since it determines to a great extent the wearer comfort. Water generated at the body surface as perspiration should be removed quickly to achieve the desired state of comfort. However, some fabrics exhibit low moisture absorbance which negatively influence on the comfort sensation of the textile. The absorption and desorption isotherms measured with the DVS apparatus are plotted in Figure 6. The curves shape of each samples are different and are related on their moisture regain values. Thus, the sample A has very limited hygroscopic uptake, while samples B and C absorb large and medium quantities of moisture, respectively. The hydrophobic character of the sample A is observed by low sorption of water. The fabric B stands out as the only material with significant moisture, and whatever the % RH, it has a considerable stronger moisture uptake than the other two samples. The measured sorption is a contribution of both adsorption and absorption. For two of the tested samples, B and C, the obtained curves have a typical sigmoid shape during water sorption and desorption in the 0-98% relative humidity range, which is underlined in the literature as a characteristic of polar polymers [21], i.e. in this study, the moisture sensible fibers used. The profile of these two curves can be divided into three main steps. At low %RH first sorption occurs in the periphery of the fibers and the phenomenon is related to the water sorption and/or water molecules immobilisation on specific hydrophilic sites or microvoids in the fabric material. After completing these sites, the sorption curves become linear with the increase of relative humidity until 80% RH, and it operates in the matrix interstices. The formation of water molecules clusters inside the polymer matrix or in the heart of the elementary fibers leads to a sudden increase at higher % RH values, reflecting the hydrophilicity of the fiber blends. The weaker increase observed for the sample C is indicative of a less hydrophilic blend. Furthermore, at low %RH, the initial uptake is much faster and the rate slowed down until % RH of 80%. The sorption curve of the sample A shows a weak linear increase as the % RH increases too. The difference of this behaviour is mainly due to the presence of PES fibers in this blend, which absorbs very few water molecules mainly due to its hydrophobic nature and its semi-crystalline structure. These behaviours as well as the equilibrium moisture constant, MC, are also related on the moisture regain values of the three samples.

Figure 6: Samples isotherms plotted from DVS test.
The presence of sorption hysteresis between the sorption and desorption isotherms is related to the fact that tests are carried out below the glass transition temperature of the polymer fibers.
Park model
Values obtained from the Park’s model are summarized in Table 6. With a low value of modulus E, Park’s model shows a good fit with DVS results. The parameter BL cannot be defined with this model because of the lack of experimental value under a water activity of 0.1. Sample B possesses highest values of AL, KH, Ka and n. Indeed, fibers that composed this sample are highly sensible to moisture. Thus, this fabric presents a high concentration of hydroxyl group on polymer surface, in middle humidity the dissolution and diffusion of water molecules inside amorphous phase is important, and at high humidity the phenomenon of aggregation through the formation of water clusters is significant. In contrary, the sample A which is composed of a high quantity of polyester is less sensible to moisture with lowest values of AL, KH, Ka and n. Thus, this blend presents less hydroxyl groups available on the polymer surface, the rigidity of polymer limits the penetration of water molecules inside the structure, and the number of water molecules per cluster is low. The sample C is composed of fibers sensible to moisture in less quantity than sample B, also the quantity of polyester is lowest than the sample A. In this way, it shows an intermediate behaviour. Thus, Park parameters are correlated positively with the moisture regain of fabrics: AL, KH, Ka, and n increase with increasing moisture regain. This statement is confirmed with the Pearson method (Table 7). A positive relationship appears also with the porosity and the air permeability. With a porous fabric, the liquid pass easily through the textile according to the positive correlation between the porosity and the accumulative one-way transport index in Table 5. In this case, more hydrophilic sites are accessible for the sorption of water molecules at the surface or into the fabric. In contrary, when the material is compact, specific sites into fabric are difficult to reach and by consequence the number of water molecules sorbed is lower. Thus, parameters of this model decrease with the density. The parameter n is the only one to be correlated negatively with the fabric weight. When the fabric is dense, the formation of water clusters diminishes.
| Sample code | AL | KH | Ka | n | E (%) |
|---|---|---|---|---|---|
| A | 0.052 | 1.18 | 1.17 | 2 | 1.4 |
| B | 0.243 | 3.9 | 8.2 | 3.3 | 3.6 |
| C | 0.083 | 2.47 | 4.67 | 2.8 | 3.9 |
Table 6: Parameters of the Park's model.
| Textile properties | AL | KH | Ka | n |
|---|---|---|---|---|
| Fabric weight | -0.634 | -0.857 | -0.871 | -0.929 |
| Thickness | -0.076 | -0.406 | -0.43 | -0.548 |
| Density | -0.892 | -0.992 | -0.995 | -0.999 |
| Porosity | 0.945 | 1 | 0.999 | 0.986 |
| Air permeability | 0.963 | 0.998 | 0.995 | 0.973 |
| Moisture regain | 0.944 | 1 | 0.999 | 0.986 |
Table 7: Pearson's correlation coefficients between Park parameters and textile properties.
The purpose of the first part is to investigate the relationship between textile properties and thermal-hydric properties of three underwears fabrics (1 × 1 interlock) with Pearson’s correlation coefficients. Thermal properties are mainly affected by porosity, moisture regain and density. Fabric weight, thickness, air permeability and density influence hydric properties of textile. Besides, the water vapor permeability index depends on fabric weight, porosity, moisture regain, air permeability and density. Studied samples are underwears used for daily life. Thus, a good water vapor permeability index is important to obtain a good respirability, a correct rate of air permeability on thickness is also essential for the ventilation rate and a medium value of overall moisture management capacity is enough for the management of liquid water as the body does not sweat excessively during the day. Therefore, samples B and C are more compatible with our application than the sample A.
The second part, contrary to the first one, is not taking into account the structure of textiles because fabrics are finely cut and small quantities of them are tested with DVS. This part studies only the hydric behavior of textiles with the Park model. The chemical nature of fibers influences mainly parameters calculated from this model. Indeed, fabrics with an important percentage of moisture sensible fibers possess highest Park model parameters. Besides, with the Pearson method, a positive correlation is found with the porosity and the air permeability. When the fabric is porous, hydrophilic sites are easily accessible which enable the increase of AL, KH, Ka, and n. In contrary when the fabric is compact, these parameters decrease.
The authors gratefully acknowledge DAMART for their financial support and ENSAIT and HEI for their technical support.