Journal of Horticulture
Open Access
ISSN: 2376-0354
ISSN: 2376-0354
Research Article - (2016) Volume 3, Issue 4
Soil salinity is one of the most important abiotic stress that limit crop production. Tomato (Solanum lycopersicum L.) is moderately tolerant to salinity and is typically cultivated in regions that are exposed to soil salinization. The aim of the study was to characterize phenotype response to salt stress under in vitro conditions of fourteen tomato genotypes. The shortest root length was observed entries BD-7260 at 250 mM. Longer roots (11.6 cm) were developed by the plants from the solutions containing 50 mM NaCl in entries BD-7302. NaCl concentration in the medium significantly affected the root length and plant weight of tomato. Genotypic distribution of weight LS means revealed that genotypes BARI-2 and the Line BD-7292 is the highest performed and the Line BD-7762 is the lowest performed. These findings indicated some salt tolerant tomato genotypes which will be promising for future hybridization program. Analysis of novel genes as well as some previously identified genes such as PIPs, LTPs, AGPs, PRPs, GRPs etc. which showed protective roles in different abiotic stresses to other crops is quiet necessary and the presence and expression pattern of those genes in these screened genotypes of tomato will provide powerful information for over-expression of those genes in transgenic plants those will confer salt tolerances to the cultivated tomato varieties.
<Keywords: In vitro; Screening; Salt tolerent; Tomato (Solanum lycopersicum L.)
High salinity is one of the major stress factors among the abiotic stresses. In the world, about 400 million hectares of land are affected by high salinity. In Bangladesh about 1 million hectares of land are affected by high salinity in the coastal regions. Salinity affects almost everyaspect of the physiology and biochemistry of plants and significantly reduces yield. As saline soils and saline waters are common around the world, great effort has been devoted to understand its physiological aspects of tolerance to salinity in plants, as a basis for plant breeders to develop salinity-tolerant genotypes. In spite of this great effort, only a small number of cultivars, partially tolerant to salinity, have been developed. Further effort is necessary if the exploitation of saline soils and saline waters that are not currently usable is to be achieved. Salinity affects yield quality and quantity, so that yield contributing characters must be taken into addressed when breeding for salinity tolerance. Not only are the yield-related characters important. As salinity affects almost every aspect of the physiology and biochemistry of the plant, the enhancement of crop salt tolerance will require the combination of several too many physiological traits [1-3], not simply those directly influencing yield. As salinity in soils is variable and plant tolerance depends on the stage of plant development, plants should be phenotype at several salinity concentrations and at the most sensitive plant stage(s).
Tomato (Solanum lycopersicum L.) is one of the most important solanaceous vegetable crops in the world in terms of both production and harvested area [4]. Though it is a self crossing annual crop, nowadays, tomatoes are attempted to grow round the year. Due to increasing consumption of its products, the crop is becoming promising. Tomato is a favorable food crop for in vitro studies due to its low chromosome number i.e., 2n=2x=24 and due to comprehensive knowledge of tomato genetics. Plant tissue culture techniques are recognized as useful instruments in tomato improvement. Several in vitro investigations have been conducted on tomato in different applications. The genetics of physiological characters together with other tolerance components related to metabolic defenses against salinity have to be studied in order to advance the breeding of tomato genotypes tolerant to salinity. Despite the present limitations, it is foreseeable that our ability to design the future breeding programmes based on genetic transformation will be strengthened with the data obtained from ongoing functional genomics projects. Seedling pretreatment with NaCl are interesting strategies to be applied when tomato plants have to be grown in saline soils or soils irrigated with saline water, the stress level necessary to trigger any adaptive response seems to be related to the degree of tolerance of the genotype. Increasing humidity around tomato plants effectively alleviates the deleterious effects of salt on tomato-plant growth and on fruit yield. Grafting tomato plants onto appropriate rootstocks also increased salt tolerance. This study was conducted to explore the bioassay so as to establish a reproducible protocol for screening of different genotypes of tomato in different concentrations of NaCl. With conceiving the above scheme in mind, the present research work has been undertaken in order to fulfilling the following objectives: To optimize the protocol for growing tomato seedlings under control and different salt concentrations, To screen out the better salt tolerant genotypes, To bring the salt prone areas under the crops for potential yields and To screen out the suitable genotypes under salt stress which are likely to provide superior segregates’ on hybridization.
The experiment was carried out at the Genetics and Plant Breeding Laboratory, Sher-e-Bangla Agricultural University, Dhaka. The place is geographically located at about 24075’ North latitude and 90050’ East longitude.
Experimental materials in vitro
Out of 41 tomato collection a total of 14 genotypes were selected based on their germinability and seedling vigourness as experimental materials. Among them BARI Tomato 2, BARI Tomato 11 were recommended standard verities while the others were selected lines. Collection was made from Horticulture research centre of Bangladesh Agricultural Research Institute (BARI), Gazipur. The genotypes used in the study are listed below.
Sterilization of culture media
Fixed volume of medium was dispensed into conical flasks. After dispensing the flasks were covered with aluminum foil paper and marked with different codes with the help of a permanent glass marker to indicate specific hormonal supplement. Then flasks were autoclaved at 15 psi pressure at 121°C for 20 min. The medium was then transfer into the culture room and cooled at 24°C temperature before used. Marking is also necessary. Fixed volume of medium was aliquot into petridishes under laminar hood. After dispensing the petridishes were covered with thin polythene (Swaran wrap) and marked with different codes with the help of a permanent glass marker to indicate specific NaCl supplements. The petridishes containing media could be store at 40°C until use. Marking was done for identification.
Sterilization of glassware and instruments
Glassware, culture vessels, beakers, petridishes, pipettes, slides, plastic caps, other instruments such as forceps, needles, scissor, spatula, surgical blades, brush, cotton, instrument stand and aluminum foil were sterilized in an autoclave at a temperature of 121°C for 20 min at 15 psi pressure. Before this, all types of glassware instrument was washed properly by liquid detergent, cleaned with running tap water and finally washed with distilled water.
Sterilization of culture room and transfer area
At the beginning, the culture room was spray with formaldehyde and then the room was kept closed for one day. Then the room was cleaned through gently washing the floors walls and rakes with a detergent. This is followed by careful wiping them with 70% ethanol. This process of sterilization of culture room was repeated at regular intervals. The transfer area was also cleaned with detergent and also sterilized twice in a month by 70% ethanol. Laminar air flow cabinet was usually sterilized by switching on the cabinet. The ultra-violate ray kills the microbes inside the laminar airflow. It switches on 30 min before working in empty condition and for 20 min with all the instruments. The working surface was wiping with 70% ethanol, 30 min before starting the transfer work.
Sterilization of seed
Seed were treated with absolute alcohol for 1 min. Then rinsed with distilled water for 2 times. Surface sterilization was done with NaOCl/ CaOCl (20%) for 2 min and again rins 5 times with distilled water (Plate 1).
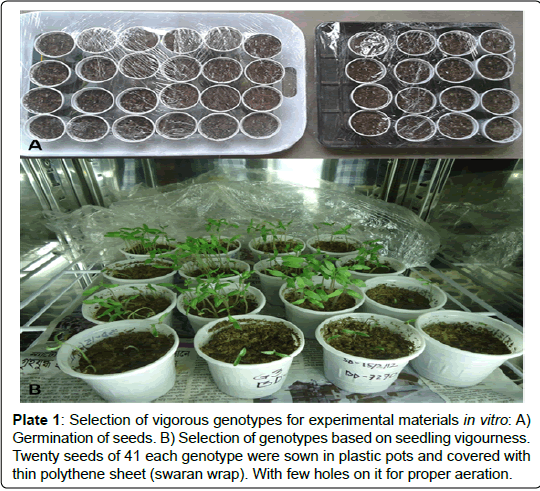
Plate 1: Selection of vigorous genotypes for experimental materials in vitro: A) Germination of seeds. B) Selection of genotypes based on seedling vigourness. Twenty seeds of 41 each genotype were sown in plastic pots and covered with thin polythene sheet (swaran wrap). With few holes on it for proper aeration.
Salt tolerance assay
Four days old germinated seeds were inoculated in a linear order on MS medium supplemented with 0 mM, 50 mM, 100 mM, 200 mM and 250 mM of NaCl. Three germinated seed were inoculated per plate. The culture plates were kept in the growth chamber in vertical position (Plate 2). The culture environment included 25°C, 60% relative humidity, and a 16 h photoperiod from white fluorescent lamps (200 μmol photons/m2/s-1). Average root length and weight was recorded on 5th and 9th days.
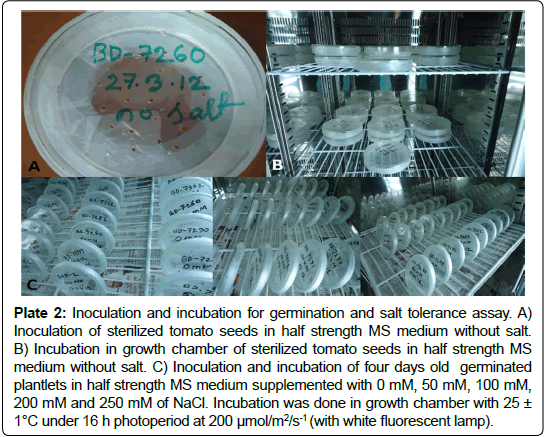
Plate 2: Inoculation and incubation for germination and salt tolerance assay. A) Inoculation of sterilized tomato seeds in half strength MS medium without salt. B) Incubation in growth chamber of sterilized tomato seeds in half strength MS medium without salt. C) Inoculation and incubation of four days old germinated plantlets in half strength MS medium supplemented with 0 mM, 50 mM, 100 mM, 200 mM and 250 mM of NaCl. Incubation was done in growth chamber with 25 ± 1°C under 16 h photoperiod at 200 μmol/m2/s-1 (with white fluorescent lamp).
Precaution of ensure aseptic conditions
All inoculation and aseptic manipulations were carried out under laminar air flow cabinet. The cabinet was usually switched on with ultra violet light half an hour before use and wiped with 70% ethanol to reduce the chances of contamination. The instruments like scalpels, forceps, needles, surgical blades, scissor, pipettes, slides, plastic caps, spatula, brush, cotton etc. were presterilized by autoclaving and subsequent sterilization were done by dipping in 70% ethanol followed by flaming and cooling method inside the laminar flow cabinet. While not in use, the instruments were kept inside the laminar airflow cabinet into the instrument stand. Hands were also sterilized by 70% ethanol and wearing of hand gloves. It is also necessary to wear apron and mask to avoid contamination rate. Other required materials like distilled water, culture vessels, beakers, glass plates, petridishes etc. were sterilized in an autoclave following method of media sterilization. The neck of test tubes were flamed before open and also dipping with ethanol with the help of soaked cotton before closing it with the aluminum foil. Aseptic conditions were followed during each and every operation to avoid the contamination of cultures.
Performance of different genotypes under control at different salt concentration
To investigate the salt tolerance in 14 genotypes, the root growth assay was performed with the 4 days old plantlets grown on media containing 0 mM-250 mM NaCl. The trend of root growth were observed as in Plate 3 where it was highest in control condition (0 mM of NaCl) and gradually decreased when the salt stress does increased to 50 mM , 100 mM, 200 mM and 250 mM. The root length and fresh weight were measured and the results obtained from these studies have been presented and discussed separately under different heading. Each of the parameter as influenced by varieties, treatments and their combinations were discussed.
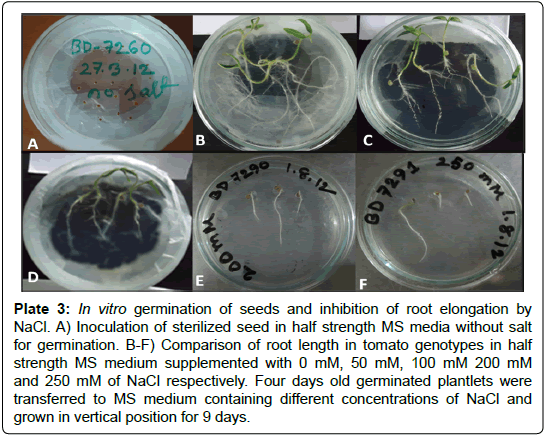
Plate 3: In vitro germination of seeds and inhibition of root elongation by NaCl. A) Inoculation of sterilized seed in half strength MS media without salt for germination. B-F) Comparison of root length in tomato genotypes in half strength MS medium supplemented with 0 mM, 50 mM, 100 mM 200 mM and 250 mM of NaCl respectively. Four days old germinated plantlets were transferred to MS medium containing different concentrations of NaCl and grown in vertical position for 9 days.
Root length and plant weight after inoculation in different NaCl concentrations
Length of root was recorded for different days after inoculation in different NaCl concentration and significant differences were recorded among genotypes.
Root length and weight reduction rate
Genotypic variation for root length is evident in control (0 mM) and in stressed condition (50 mM, 100 mM and 250 mM) (Table 1; Figure 1). The tomato BARI-2 and BD-7292 produced the longest root at 50 mM NaCl salt concentration indicating their tolerance to salt at 50 mM, whereas BD-7762 showed the shortest root length. As the different genotypes showed varying degree of root length under unstressed condition (0 mM), it was necessary to measure the root reduction size at different salt concentrations (Table 2; Figure 2). BARI-2, BD-7260, BD-7290, BD-7286, BD-7292, BD-7762 and BARI-11 showed negative reduction i.e., they had no effect of 50 mM salt stress on their growth and development. It was also observed that some genotypes showed no tolerance at lower salt concentration i.e., 50 mM but showed tolerance at high salt concentrations such as BD-7258, BD-7289, and BD-7289 at 100 mM salt stress and some of them even at 200 mM salt stress (BD- 7260, BD-7289, BD-7291, BD-7302 and BARI-11 respectively).
| Serial Number | Variety name and accession number |
|---|---|
| 01 | BARI Tomato-2 |
| 02 | BARI Tomato-11 |
| 03 | BD-7260 |
| 04 | BD-7290 |
| 05 | BD-7295 |
| 06 | BD-7286 |
| 07 | BD-7269 |
| 08 | BD-7258 |
| 09 | BD-7289 |
| 10 | BD-7292 |
| 11 | BD-7291 |
| 12 | BD-7302 |
| 13 | BD-7301 |
| 14 | BD-7762 |
Table 1: List of the tomato genotypes used in the experiment.
| Genotype | Root reduction (cm) | ||
|---|---|---|---|
| 50 mM | 100 mM | 200 mM | |
| BARI-2 | -7.16666 | 7.666663 | 2.266667 |
| BD-7260 | -0.36667 | 1.633333 | -0.26667 |
| BD-7290 | -0.9 | 0.8 | 1.7 |
| BD-7295 | 4 | 0.466667 | 0.2 |
| BD-7286 | -0.56667 | 1.166667 | 1.5 |
| BD-7269 | 0.33333 | 3.33E-06 | 1 |
| BD-7258 | 2.333333 | -0.33333 | -1.5 |
| BD-7289 | 1.1 | -0.23333 | -1.46667 |
| BD-7292 | -4 | 5.4 | 3.566667 |
| BD-7291 | 1.633333 | -0.16667 | -0.83333 |
| BD-7302 | 1.9 | 0.333333 | -0.86667 |
| BD-7301 | 1.333333 | 2.333333 | 0.833333 |
| BD-7762 | -0.16667 | 0.1 | 0.033333 |
| BARI-11 | -2.06667 | 2.9 | -0.03333 |
Table 2: Root length reduction (cm) under different salt concentrations.
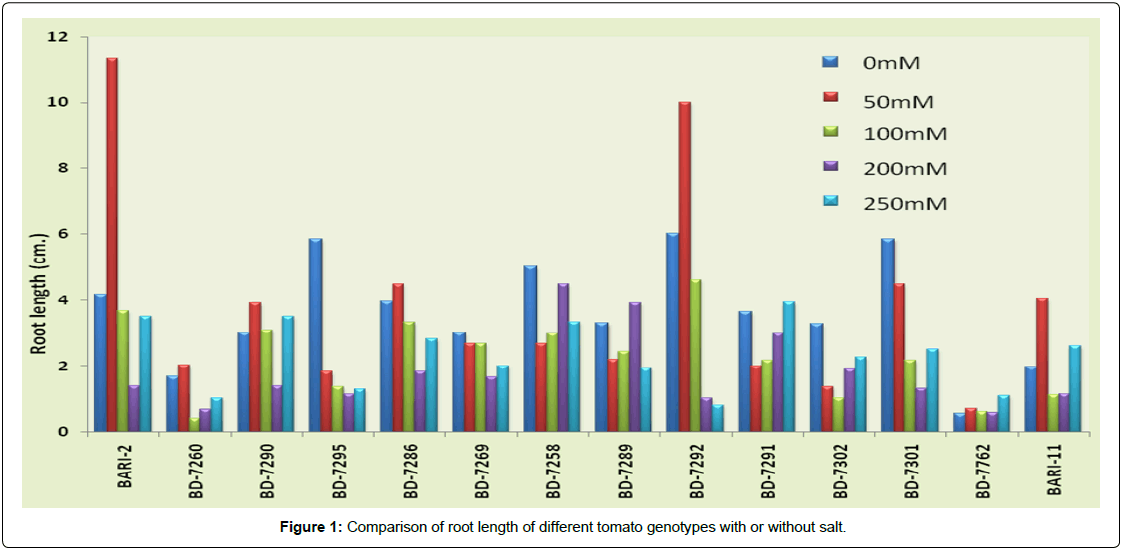
Figure 1: Comparison of root length of different tomato genotypes with or without salt.
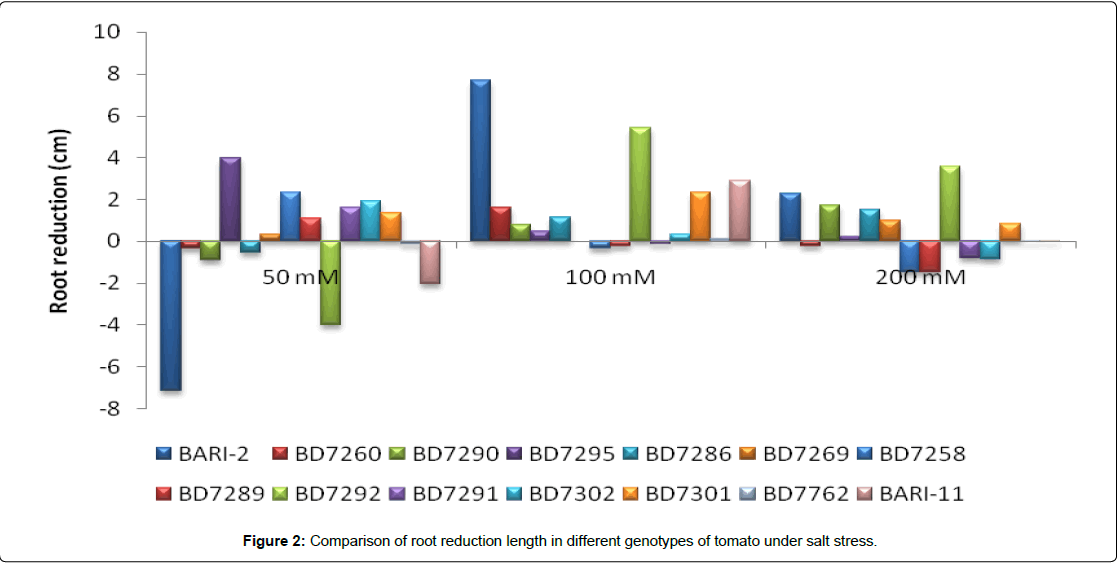
Figure 2: Comparison of root reduction length in different genotypes of tomato under salt stress.
This phenomenon indicates that some genes which are responsible for salt tolerance might not be expressed or weakly expressed at low salt stress but defended strongly at high salt concentrations and produced functional protein as defense mechanisms.
Buchanan et al. [5] showed similar results in case of spinach leaf tolerance to high salt but not at lower salt stress. MIP family genes showed weak expression under low salt and strong expression under high salt stress. Among the cell wall proteins most of them were previously found to play a protective role in plant cells in response to high salinity [6,7]. Therefore the gene expression pattern analysis of previously identified genes involved in protective role under salt stress is yet to be done.
Salt sensitivity and tolerances were also recorded based on the comparison of fresh weight under 0 mM (unstressed) to 200 mM salt stressed concentrations. BARI-2, BD-7260, BD-7290, BD-7286, BD-7289, BD-7301 and BARI-11 had more fresh weight at 50 mM as compared to the other genotypes (Figure 3). They had no effect of salt and even their growth and development is increased at 50 mM of salt stress (Table 3). The fresh weight reduction is negative if observed in Figure 4. BD-7286 showed tolerance up to 100 mM of salt stress. BD-7302 did not show tolerance response under low salt (50 mM) but showed tolerance at higher concentrations of 100-200 mM salt indicates the expression of some genes which have protective roles under high salinity. Gene expression data should be obtained in the control and stressed plants of the screened genotypes in support of the defense mechanism of these screened genotypes.
| Genotypes | Weight reduction (g) | ||
|---|---|---|---|
| 50 mM | 100 mM | 200 mM | |
| BARI-2 | -0.066 | 0.063 | 0.014 |
| BD-7260 | -0.027 | 0.046666667 | 0.001333 |
| BD-7290 | -0.03133 | 0.033333333 | 0.018 |
| BD-7295 | 0.042333 | -0.032666667 | 0.037 |
| BD-7286 | -0.013 | -0.024666667 | 0.053 |
| BD-7269 | 0.021 | -0.013 | 0.007 |
| BD-7258 | 0.007467 | -0.050666667 | 0.049333 |
| BD-7289 | -0.031 | 0.004 | 0.023 |
| BD-7292 | 0.025 | 0.024333333 | 0.042 |
| BD-7291 | 0.008 | 0 | -0.01267 |
| BD-7302 | 0.03 | -0.007333333 | -0.02467 |
| BD-7301 | -0.01367 | 0.022 | 0.015667 |
| BD-7762 | 0.005367 | -3.33333E-05 | 0.000667 |
Table 3: Fresh weight reduction (g) under different salt concentrations.
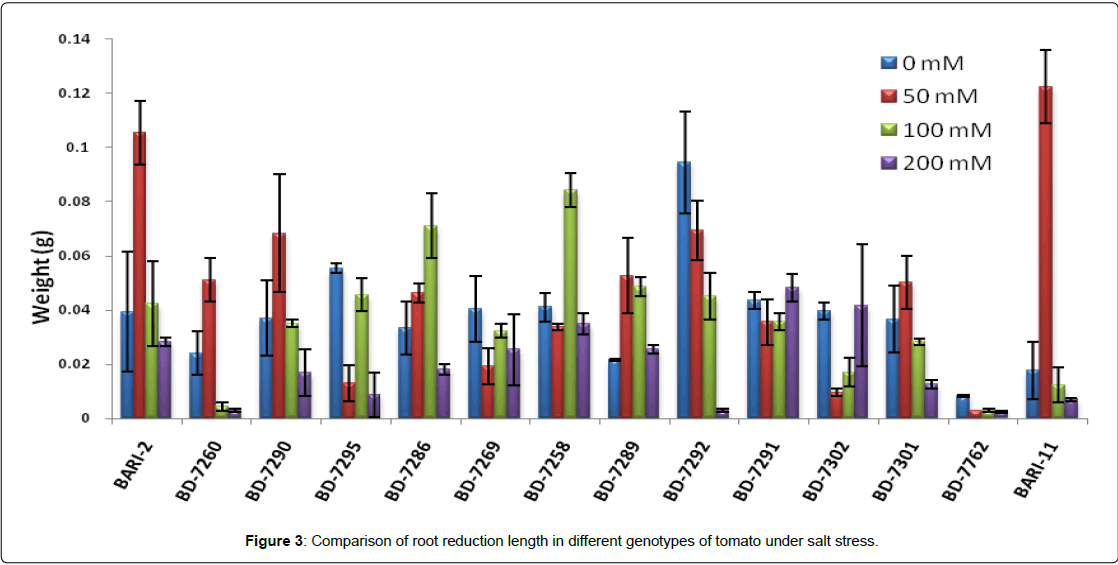
Figure 3: Comparison of root reduction length in different genotypes of tomato under salt stress.
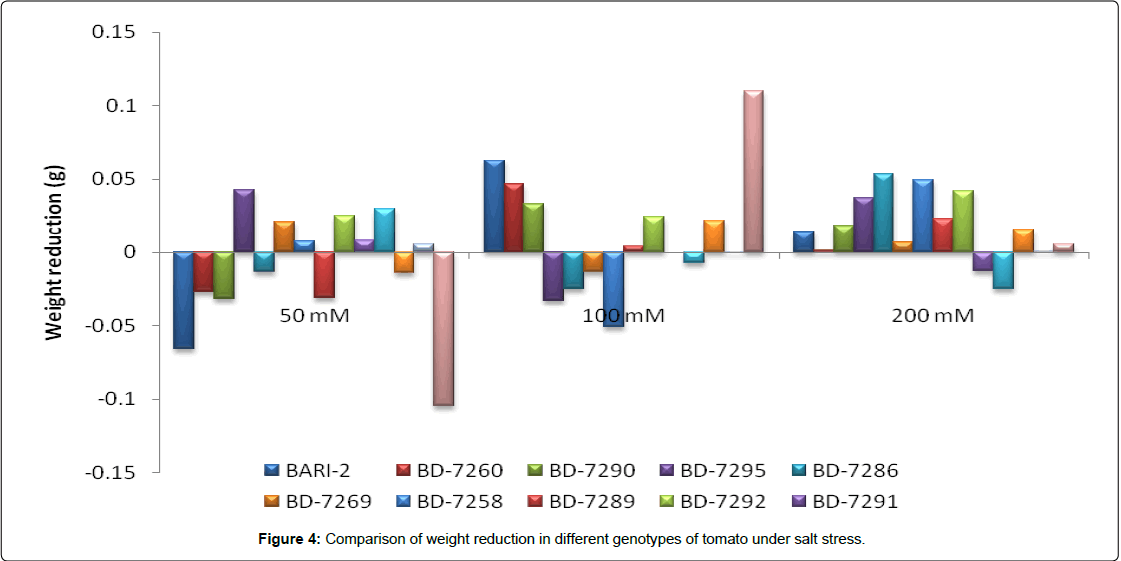
Figure 4: Comparison of weight reduction in different genotypes of tomato under salt stress.
Analysis of some previously identified genes which showed protective roles in different abiotic stresses is quiet necessary and the presence and expression pattern of those genes in these screened genotypes of tomato will provide powerful information for overexpression of those genes in transgenic plants those will confer salt tolerances. Some of the previously reported genes which played protective role in defense mechanisms under high salinity are Plasma membrane intrinsic protein.
Gibberellin-Responsive Protein (GRP) [8], Arabinogalactan protein, Prolin Rich Protein (PRP), Glyceraldehyde 3-phosphate dehydrogenase gene etc. Expression of these genes under unstressed and stressed condition is yet to be done.
Genotypic distribution of length LS-means of genotypes
According to length the analysis of variance gives us significant results for treatment and non-significant results for genotypes (Table 4).
| ANOVA | ||||||||
|---|---|---|---|---|---|---|---|---|
| Analysis of Variance for root length | Analysis of Variance for weight | |||||||
| Effect | Num DF | Den DF | F Value | Pr>F | Num DF | Den DF | F Value | Pr>F |
| Genotype | 13 | 52 | 1.49 | 0.154 | 13 | 52 | 2.57 | 0.0080** |
| Treatment | 4 | 52 | 2.85 | 0.0329** | 4 | 52 | 4.58 | 0.0030** |
Table 4: Analysis of variance for root length and weight.
When we compare only the length was compared with the variety to variety, variety to lines and line to line both significant and non significant results were observed (Table 5). For T grouping ANOVA shows the variety BARI-2 and line BD-7289 are the more salt tolerant genotypes (Table 6). According to weight the analysis of variance gives significant results for both treatment and genotypes. When we compare only the weight was compared with the variety to variety, variety to lines and line to line we got significant and non-significant results were observed (Table 7).
| Least Squares Means for effect genotype Pr>|t| for H0: LSMean(i)=LSMean(j) Dependent Variable: Length | ||||||||||||||
|---|---|---|---|---|---|---|---|---|---|---|---|---|---|---|
| i/j | 1 | 2 | 3 | 4 | 5 | 6 | 7 | 8 | 9 | 10 | 11 | 12 | 13 | 14 |
| 1 | - | 0.0206* | 0.0018* | 0.0996 | 0.0267* | 0.1661 | 0.0348* | 0.3039 | 0.0660 | 0.7337 | 0.0939 | 0.0128* | 0.1609 | 0.0005* |
| 2 | 0.0206 | - | 0.3709 | 0.4822 | 0.9159 | 0.3319 | 0.8281 | 0.1843 | 0.6141 | 0.0461* | 0.5005 | 0.8510 | 0.3406 | 0.1959 |
| 3 | 0.0018 | 0.3709 | - | 0.1131 | 0.3177 | 0.0652 | 0.2674 | 0.0286* | 0.1643 | 0.0047* | 0.1197 | 0.4785 | 0.0677 | 0.6857 |
| 4 | 0.0996 | 0.4822 | 0.1131 | - | 0.5500 | 0.7872 | 0.6265 | 0.5269 | 0.8418 | 0.1881 | 0.9766 | 0.3740 | 0.8008 | 0.0486* |
| 5 | 0.0267 | 0.9159 | 0.3177 | 0.5500 | - | 0.3866 | 0.9112 | 0.2208 | 0.6900 | 0.0582 | 0.5697 | 0.7692 | 0.3962 | 0.1626 |
| 6 | 0.1661 | 0.3319 | 0.0652 | 0.7872 | 0.3866 | - | 0.4501 | 0.7160 | 0.6390 | 0.2931 | 0.7648 | 0.2480 | 0.9860 | 0.0260* |
| 7 | 0.0348 | 0.8281 | 0.2674 | 0.6265 | 0.9112 | 0.4501 | - | 0.2649 | 0.7737 | 0.0738 | 0.6474 | 0.6857 | 0.4606 | 0.1324 |
| 8 | 0.3039 | 0.1843 | 0.0286 | 0.5269 | 0.2208 | 0.7160 | 0.2649 | - | 0.4060 | 0.4895 | 0.5080 | 0.1309 | 0.7030 | 0.0104* |
| 9 | 0.0660 | 0.6141 | 0.1643 | 0.8418 | 0.6900 | 0.6390 | 0.7737 | 0.4060 | - | 0.1309 | 0.8648 | 0.4895 | 0.6516 | 0.0747 |
| 10 | 0.7337 | 0.0461 | 0.0047 | 0.1881 | 0.0582 | 0.2931 | 0.0738 | 0.4895 | 0.1309 | - | 0.1786 | 0.0299* | 0.2852 | 0.0015* |
| 11 | 0.0939 | 0.5005 | 0.1197 | 0.9766 | 0.5697 | 0.7648 | 0.6474 | 0.5080 | 0.8648 | 0.1786 | - | 0.3898 | 0.7782 | 0.0518 |
| 12 | 0.0128 | 0.8510 | 0.4785 | 0.3740 | 0.7692 | 0.2480 | 0.6857 | 0.1309 | 0.4895 | 0.0299 | 0.3898 | - | 0.2551 | 0.2674 |
| 13 | 0.1609 | 0.3406 | 0.0677 | 0.8008 | 0.3962 | 0.9860 | 0.4606 | 0.7030 | 0.6516 | 0.2852 | 0.7782 | 0.2551 | - | 0.0271* |
| 14 | 0.0005 | 0.1959 | 0.6857 | 0.0486 | 0.1626 | 0.0260 | 0.1324 | 0.0104 | 0.0747 | 0.0015 | 0.0518 | 0.2674 | 0.0271 | - |
Table 5: Least squares means for effect genotype for root length.
| T Comparison Lines for Least Squares Means of genotype | |||||||||||||
|---|---|---|---|---|---|---|---|---|---|---|---|---|---|
| LS-means with the same letter are not significantly different | |||||||||||||
| Length LSMEAN | Genotype | LSMEAN Number | Weight LSMEAN | Genotype | LSMEAN Number | ||||||||
| A | 4.87328 | 1 | 1 | A | 0.05284 | 1 | 1 | ||||||
| A | A | ||||||||||||
| B | A | 4.48666 | 10 | 10 | A | 0.05068 | 8 | 8 | |||||
| B | A | A | |||||||||||
| B | A | C | 3.7 | 8 | 8 | B | A | 0.04472 | 10 | 10 | |||
| B | A | C | B | A | |||||||||
| B | D | A | C | 3.28664 | 6 | 6 | B | A | 0.04372 | 6 | 6 | ||
| B | D | A | C | B | A | ||||||||
| B | D | A | C | 3.26666 | 13 | 13 | B | A | 0.04194 | 11 | 11 | ||
| B | D | A | C | B | A | ||||||||
| B | D | A | C | 2.98 | 4 | 4 | B | A | 0.0412 | 4 | 4 | ||
| B | D | A | C | B | A | ||||||||
| E | B | D | A | C | 2.94666 | 11 | 11 | B | A | 0.04112 | 2 | 2 | |
| E | B | D | A | C | B | A | |||||||
| E | B | D | A | C | 2.75332 | 9 | 9 | B | A | C | 0.03856 | 12 | 12 |
| E | B | D | C | B | A | C | |||||||
| E | B | D | C | 2.42668 | 7 | 7 | B | A | C | 0.0333 | 9 | 9 | |
| E | B | D | C | B | A | C | |||||||
| E | B | D | C | 2.3 | 5 | 5 | B | A | C | 0.02986 | 13 | 13 | |
| E | D | C | B | A | C | ||||||||
| E | D | C | 2.18 | 2 | 2 | B | A | C | 0.02978 | 7 | 7 | ||
| E | D | C | B | A | C | ||||||||
| E | D | C | 1.96668 | 12 | 12 | B | A | C | 0.02608 | 5 | 5 | ||
| E | D | B | C | ||||||||||
| E | D | 1.16 | 3 | 3 | B | C | 0.01786 | 3 | 3 | ||||
| E | C | ||||||||||||
| E | 0.7 | 14 | 14 | C | 0.00792 | 14 | 14 | ||||||
Table 6: T grouping for root length and plant weight.
| Least Squares Means for effect genotype Pr>|t| for H0: LSMean(i)=LSMean(j) Dependent Variable: Weight | ||||||||||||||
|---|---|---|---|---|---|---|---|---|---|---|---|---|---|---|
| i/j | 1 | 2 | 3 | 4 | 5 | 6 | 7 | 8 | 9 | 10 | 11 | 12 | 13 | 14 |
| 1 | - | 0.4501 | 0.0271 | 0.4532 | 0.0880 | 0.5564 | 0.1402 | 0.8890 | 0.2101 | 0.6003 | 0.4823 | 0.3581 | 0.1415 | 0.0051* |
| 2 | 0.4501 | - | 0.1368 | 0.9959 | 0.3333 | 0.8666 | 0.4649 | 0.5375 | 0.6138 | 0.8161 | 0.9578 | 0.8687 | 0.4680 | 0.0355 |
| 3 | 0.0271 | 0.1368 | - | 0.1355 | 0.5959 | 0.0989 | 0.4425 | 0.0376* | 0.3207 | 0.0868 | 0.1238 | 0.1846 | 0.4395 | 0.5216 |
| 4 | 0.4532 | 0.9959 | 0.1355 | - | 0.3308 | 0.8707 | 0.4618 | 0.5409 | 0.6102 | 0.8202 | 0.9619 | 0.8646 | 0.4649 | 0.0351* |
| 5 | 0.0880 | 0.3333 | 0.5959 | 0.3308 | - | 0.2572 | 0.8111 | 0.1161 | 0.6412 | 0.2315 | 0.3078 | 0.4215 | 0.8071 | 0.2436 |
| 6 | 0.5564 | 0.8666 | 0.0989 | 0.8707 | 0.2572 | - | 0.3696 | 0.6533 | 0.5017 | 0.9485 | 0.9085 | 0.7390 | 0.3723 | 0.0238* |
| 7 | 0.1402 | 0.4649 | 0.4425 | 0.4618 | 0.8111 | 0.3696 | - | 0.1805 | 0.8202 | 0.3365 | 0.4334 | 0.5711 | 0.9959 | 0.1616 |
| 8 | 0.8890 | 0.5375 | 0.0376 | 0.5409 | 0.1161 | 0.6533 | 0.1805 | - | 0.2642 | 0.7004 | 0.5729 | 0.4349 | 0.1821 | 0.0075* |
| 9 | 0.2101 | 0.6138 | 0.3207 | 0.6102 | 0.6412 | 0.5017 | 0.8202 | 0.2642 | - | 0.4618 | 0.5773 | 0.7341 | 0.8242 | 0.1052 |
| 10 | 0.6003 | 0.8161 | 0.0868 | 0.8202 | 0.2315 | 0.9485 | 0.3365 | 0.7004 | 0.4618 | - | 0.8575 | 0.6909 | 0.3391 | 0.0203* |
| 11 | 0.4823 | 0.9578 | 0.1238 | 0.9619 | 0.3078 | 0.9085 | 0.4334 | 0.5729 | 0.5773 | 0.8575 | - | 0.8272 | 0.4364 | 0.0314* |
| 12 | 0.3581 | 0.8687 | 0.1846 | 0.8646 | 0.4215 | 0.7390 | 0.5711 | 0.4349 | 0.7341 | 0.6909 | 0.8272 | - | 0.5746 | 0.0517* |
| 13 | 0.1415 | 0.4680 | 0.4395 | 0.4649 | 0.8071 | 0.3723 | 0.9959 | 0.1821 | 0.8242 | 0.3391 | 0.4364 | 0.5746 | - | 0.1601 |
| 14 | 0.0051 | 0.0355 | 0.5216 | 0.0351 | 0.2436 | 0.0238 | 0.1616 | 0.0075 | 0.1052 | 0.0203 | 0.0314 | 0.0517 | 0.1601 | - |
Table 7: Least squares means for effect of genotype for weight.
In vitro plant tissue culture is useful as quick tool to evaluate plant tolerance under salt stress. Many studies were carried out through using different tissue culture methods [9]. The result showed that shoot and root growth in these tomato genotypes were decreased with increasing NaCl concentration in the growth media in general agreement with Abed et al. [10] study. Reduction in growth with increasing salinity in growth media may be attributed to water deficit or ion toxicity associated with excessive ion uptake particularly of [Na. sup.+] and [C.sup.l-] [11]. Nutrients imbalance as a result of depressed uptake, shoot transport and impaired internal distribution of minerals especially [K.sup.+] and [Ca.sup.+2] may also explained the reduction in plant growth [12].
At 50 mM NaCl in the growth media shoot growth was not significantly affected by the presence of salt in the growth media. However, root lengths were significantly decreased with increase in NaCl concentration. Root growth was more adversely affected by increasing NaCl concentration in the growth media than shoot growth [13-15]. Root growth is suggested by Cano et al. [16] as better characteristic for evaluating salt tolerance of tomato species. Cultivated tomato is generally classified as being moderately salt-sensitive. Different genotypes of tomato displayed widely different degrees of salinity tolerance [17-19].
These results were in agreement with the previous findings concerning the physiological responses of tomato cultures to salt treatments. Marked differences in the behavior of both susceptible and tolerant tomato genotypes were evident [16,20-24]. Yet, an understanding of the mechanisms that plants use to cope with high salinity is necessary to select and develop tomato plants that are more tolerant to salinity. Rus et al. [24] also found that adaptation capacity to salinity varies with the genotype’s degree of tolerance. Maliwal and Paliwal [20] detected different salt stress responses among several tomato cultivars, from a halophytic behavior.
In vitro screening, forty one genotype of tomato was taken for this study. Root assay and fresh weight assay were performed to compare the tolerance response of these genotypes. Five genotypes viz., BARI-2, BD- 7260, BD-7290, BD-7286, and BARI-11 showed excellent performance of tolerance up to 50 mM of NaCl. BD-7302 showed better performance under high salt concentrations i.e., at 100 mM and 200 mM but not at low salt stress. Genotypic distribution of weight LS means revealed that genotypes BARI-2 and the Line BD-7292 is the highest performed and the Line BD-7762 is the lowest performed. These findings indicated some salt tolerant tomato genotypes which will be promising for future hybridization program. Despite the present limitations, it is foreseeable that our ability to design the future breeding programmes based on genetic transformation will be strengthened with the data obtained from ongoing functional genomics projects.