Journal of Geology & Geophysics
Open Access
ISSN: 2381-8719
ISSN: 2381-8719
Research Article - (2014) Volume 3, Issue 5
The Innovative Mathematical Model for Earthquake Prediction (IMMEP) based on Spatial Connection Theory and reverse Poisson’s distribution was developed previously. Using data from National Earthquake Information Center (NEIC), Spatial Connection Models were constructed using KML programming language in Google Earth program for six fault zones around the world: California, Central USA, Northeast USA, Hawaii, Turkey, and Japan. The Poisson Range Identifier (Pri) values were computed, and the Poisson’s Distribution was applied to the Pri values to arrive at a distance factor. Based on the reverse Poisson’s Distribution, earthquake predictions were carried out. To improve the Innovative Mathematical Model for Earthquake Prediction, further analysis was carried out on California fault zone earthquake data, utilizing Poisson’s and Exponential Distributions. The predictions of the Poisson’s and Exponential Distribution were nearby validating the Spatial Connection Theory By using technological advances and improving the probability of future earthquake predictions, this research provides an effective contribution to earth science. Utilizing the results of this research, disaster management agencies around the world can allocate their resources in appropriate locations to assist people during evacuation and save lives.
Keywords: Mathematical model, Earthquake, Prediction, Poisson?s distribution
Objective
The objective of this research is to improve upon a previously developed Innovative Mathematical Model for Earthquake Prediction. The result was the development of multiple rigorous algorithms to reach a similar prediction confirming the Spatial Connection Theory, which states that all earthquakes within a fault zone are related to each other.
Previous literature
Seismologists have been endeavoring to predict earthquakes for many decades. In the past, an M8 algorithm has been developed to predict earthquakes and has an accuracy rate of predicting past earthquakes close to 100% [1]. Other seismologists have predicted earthquakes based on the presence of an earthquake cloud, vapor that is released through crevices of rocks just prior to an earthquake [2]. Previously, researchers have used the gamma distribution to model the pattern of seismic events and earthquakes [3]. Geoelectrical signals have also been a key point of interest for seismologists working on earthquake clustering in Japan. Before seismic activity, there are great changes in low frequency range geomagnetic and geoelectric fields. Simultaneous changes in different stations noticed, signal a possibility of an earthquake. One such example is the Izu island earthquake in Japan. The geoelectric and geomagnetic dipoles at the Wak-Air and Boe-Air stations experienced great frequency changes before the earthquake. The changes occurred in the ultra low frequency range of 0.0001–0.03 Hz, but the greatest changes occurred in the 0.006–0.03 Hz frequency range. A concern was expressed over the interruption in the dipoles by telephone cable noise, but this concern was verified as not true because the changes occurred both in Wak-Air and Boe- Air dipole stations [4]. An earthquake is located by its epicenter - the location on the earth’s surface directly above the point of origin of the earthquake. Earthquake ground shaking diminishes with distance from the epicenter. Thus, any given earthquake will produce the strongest ground motions near the earthquake with the intensity of ground motions diminishing with increasing distance from the epicenter [5]. Larger magnitude earthquakes affect larger geographic areas, with much more widespread damage than smaller magnitude earthquakes. However, for a given site, the magnitude of an earthquake is NOT a good measure of the severity of the earthquake at that site. Rather, the intensity of ground shaking at the site depends on the magnitude of the earthquake and on the distance from the site to the earthquake [6]. However, Moment Magnitude is a good measure of the amount of energy released during an earthquake, which is not dependent on ground shaking levels or level of damage. The Mercalli scale is used to measure moment magnitude. It reflects factors that are characteristic to the rupture of the fault that produces the earthquake [7]. Studies by a Spanish researcher show that earthquakes of larger magnitudes cause other large earthquakes to happen back to back in a short amount of time. This research contradicts the average person’s thinking, which is: If an earthquake of extremely high magnitude occurs, another major earthquake won’t be due for a long time. The theory of the Spanish researcher parallels the magnet theory of Earth. The magnet theory is that a metal becomes magnetic when clusters of atoms feels another’s magnetic force and align their magnetic moments in the same direction [8]. Geological analysis has also been conducted to identify changes in the rock before, during, and after earthquakes. Dilatancy is the inelastic volume increase in rock due to great pressure. Due to in-elasticity, this sends high bursts of energy throughout the crust’s rock. Immediately after great levels of dilatancy, there are earthquakes in the area where the energy was released from the dilatory rock. The volume increase can be calculated by Vp/Vs ratio (Poisson’s ratio). The Poisson’s ratio is Velocity of P wave: Velocity of S Wave. Interestingly, very low levels of Poisson’s ratio are exhibited before an earthquake. Examples: There was a decrease in dilatancy in Gram, USSR before a 6-magnitude earthquake and in the Adirondack region of New York State before an earthquake occurrence was noted [9]. Possible factors to experiment on are land deformations, tectonic movements, seismic activity, and differences in seismic wave velocities of different world regions, geomagnetic and geoelectric phenomenons, and active faults. There are many intense laboratory studies in US, Japan, and the Soviet Union that focus on similar, geographic factors when trying to establish a method for earthquake prediction and are funded by the public and private sector [10].
In the past, six zones were analyzed, with California offering the most promising results [11]. The Californian fault zone was split into two for further validation of the Innovative Mathematical Model for Earthquake Prediction. The San Andreas Fault was split into two so that each zone covers a major population center. Also, these two zones act as cross validation for the prediction model. The rectangular latitude longitude range was chosen to cover a band of landmass on both sides of the San Andreas fault. The following two different zones, Northern California and Southern California, were analyzed using the fault lines and past earthquake data. Depending on the occurrences of earthquakes and their magnitudes, the rectangular area for the data collection for each zone was chosen as shown in Table 1. The North and South Californian fault zones are strike-slip fault zones where the movement of plates is horizontal, building a lot of stress to release through earthquakes. The 1906 San Francisco earthquake and the 1994 Northridge earthquake were major tectonic events reshaping the geological formation of the region. The majority of Californian earthquakes are less than 16 km below the crust [12]. In Northern California and Southern California, most earthquakes occur in the 5 to 7 magnitude range. Using the National Earthquake Information Center (NEIC) database, the data for the North California and South California listed above were downloaded in KML format. The data was analyzed using the spatial connection theory, based on logical assumption that every earthquake within a fault zone is related to the previous earthquake. In this research the reverse Poisson’s distribution and exponential distribution were used, conforming to the spatial connection theory by showing that earthquake occurrences are not independent of each other. Using the North California fault zone data points, Spatial Connection lines were drawn between the first and second earthquake, then between the second and third earthquake, and so on and so forth. Using the South California fault zone data points, Spatial Connection lines were drawn between the first and second earthquake, then between the second and third earthquake, and so on and so forth. There is a relationship existing between the earthquake occurrences with respect to distance, direction, and time. After spatial connection between earthquake’s epicenters were carried out a relationship equation between angle of turn and time to predict a distance range for the next earthquake was carried out as follows. In Figure 1, consider the two lines between first, second and third location of earthquakes. If the angle between the lines is ‘theta’, distance between first and second location is ‘x1’ and between second and third location is ‘x2’, then Poisson Range Identifier (Pri) is Poisson Range Identifier (Pri) = [(x1 * time lag 2)/ [ (COS (theta) * x2 * time lag1).
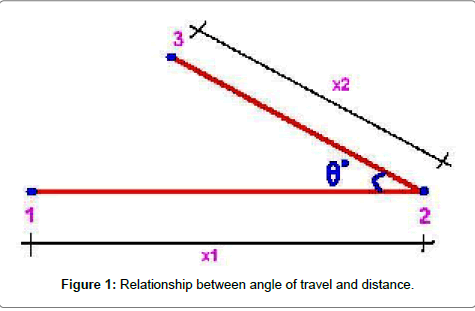
Figure 1: Relationship between angle of travel and distance.
| Zone | North Longitude (Degrees) | South Longitude (Degrees) | East Latitude (Degrees) |
West Latitude (Degrees) | Magnitude Range | From Year | To Year | Number of Earthquakes |
| North California | 42 | 36 | -127 | -118 | 5 to 9 | January 1 2006 | January 1 2014 | 18 |
| South California | 36 | 30 | -124 | -115 | 5 to 9 | January 1 2006 | January 1 2014 | 13 |
Table 1: Earthquake Metadata.
To arrive at a statistically adept group for finding the average (Pri) for the zone two of the highest values are omitted and cumulative value and mean for rest of the values are found. The Poisson distribution or Poisson law of small numbers is a discrete probability distribution that expresses the probability of a given number of events occurring in a fixed interval of time and/or space if these events occur with a known average rate and independently of the time since the last event.
Applying Poisson’s Distribution to the Pri Data,
Df = POISSION DIST [Pri; Pri(mean); Pri (cu)]
Similarly other Distance factors were worked out for rest of the earthquakes in the zone. To arrive at a statistically adept group for finding the average (Df) for the zone two of the highest values are omitted and cumulative value and mean for rest of the values are found. Using the Pri value and distance factor the predictions for North California and South California were made.
The exponential distribution was carried out using the cosine of the angle of change, distance, and time between the various earthquakes. The exponential distribution results were utilized to calculate the exponential factor for the zones. The exponential factor was utilized along with the Range Identifier function to predict future earthquake occurrences based on time as outlined in Table 2.
| Zones | Possion Range Identifier Factor |
Exponential | angle | cos of angle | last distance (miles) | last time (days) |
prediction time (days) |
prediction distance (miles) | |
| North California | 3. | - | 20 | 0.94 | 323 | 90 | 180 | 230 | 219 |
| North California | - | 3. | 20 | 0.94 | 323 | 90 | 180 | 208 | |
| South California | 0.38 | - | 25 | 0.91 | 9 | 157 | 180 | 30 | 29 |
| South California | - | 0.41 | 25 | 0.91 | 9 | 157 | 180 | 28 |
Table 2: Earthquake Prediction Results Table for North California and South California.
The difference between the Poisson’s distribution and Exponential Distribution is the presence of a reverse distribution. For the Poisson’s distribution method, a reverse Poisson’s distribution concept is applied to show the earthquake occurrences are not independent events. For the Exponential Distribution method, a prediction is carried out using the Range Identifier function and the exponential factor.
The thickness of the lines refers to the sequential order of the earthquake occurrences in the fault zone with the thinnest being the earliest earthquake (Figures 2 and 3).
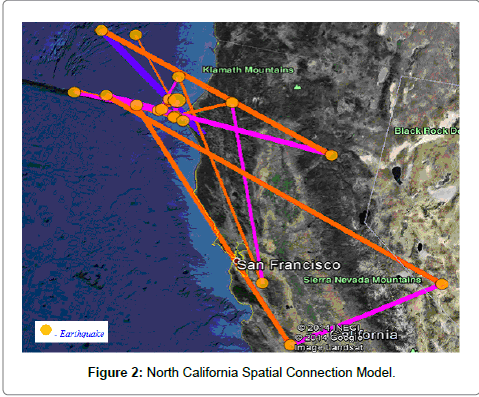
Figure 2: North California Spatial Connection Model.
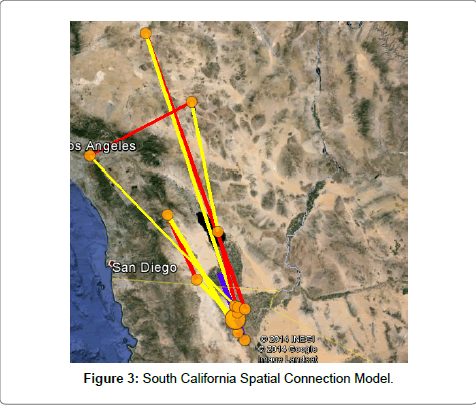
Figure 3: South California Spatial Connection Model.
Interpretation of the results
The Spatial Connection Theory was confirmed when the California Fault Zone was split into two zones for analysis. The exponential distribution confirmed the results of the Poisson Range Identifier Analysis and allowed for improvement of the model. There were some interesting patterns that were observed in the spatial distribution of earthquake occurrence in each of the two zones. In the North California zone, earthquakes primarily clustered off the coast and minimal earthquakes occurred on the landmass. In South California, the earthquakes primarily clustered in a linear pattern and no occurrences were reported off the coast of Southern California. Geological analysis must be done to identify more information to allow for the development of optimal earthquake prediction methods. Further methods must be analyzed and triangulated to arrive at an accurate prediction of earthquakes (Table 2).
After catastrophic earthquakes, there have been major economic consequences. Earthquakes have resulted in major devastation causing financial losses to all scientists, investors, engineers, doctors, etc. working in the impact area. Insurance companies have filed for bankruptcy because of the large demand of money from their clients’ losses. Ports were extremely dangerous because they were built on loose soil and they brought income to a particular region. Due to the destroyed highways, railroads, and bridges, the goods cannot be transported easily from one business to another. Potential future losses after earthquakes are rising rapidly demanding we find a mechanism to predict earthquakes [13].
The researched method of Innovative Mathematical Model (IMM) can be applied to predict future earthquakes within a fault zone. With over 24 billion dollars in losses from earthquake damage for the 1994 North Ridge California Earthquake, the potential practical implementation of these principles could save several hundred millions of dollars and precious lives. The emergency management organizations like FEMA can allocate and position their resources in the right location to assist people in evacuation and supply and save lives.
The researcher would like to team up with University Seismology Research departments to conduct scientific studies on Innovative Mathematical Model (IMM) and develop a mathematical algorithm for the most reliable earthquake prediction. That would help disaster management agencies like Federal Emergency Management Agency (FEMA) to be ready for safe evacuation of the population and protection of public property.