Journal of Geology & Geophysics
Open Access
ISSN: 2381-8719
ISSN: 2381-8719
Research Article - (2014) Volume 3, Issue 2
The present study is an attempt to analyze the impacts of Qibla Bandi dam on landuse and cropping pattern of the selected Mouza1. Main objective of the study is to find out the new cropping pattern emerged after the construction of the dam. Site visits and detailed discussions with the people of the study area and officials of the line departments were made to get required information. The results of the study show that due to irrigation water from Qibla Bandi Dam, the yield per acre has increased. Now more preference is given to cash crops such as groundnut, mustard, maize, tobacco, sugarcane and vegetables. Some suitable measures are proposed for sustainable development of the study area.
Keywords: Cropping pattern, Irrigation, Net sown area, Change detection, Pakistan
The study area is located in the southeast of Hazro Town in famous Chach plain of District Attock. The absolute location of Malik Mala village is 72°42’00˝ East longitude and 34°1’30˝ North latitude. It has an elongated geographical shape extended in north-south direction (Map 1). According to 1998 census record, total population of study area was 9040, of which 4521 were male while female were 4519 making a sex ratio of about one to one. The population was mostly young where 4083 persons (45.2%) were below 18 years old. The literacy in the study area was 36.6 percent as compared to 43.7% in district Attock and 36% in Pakistan. The total numbers of household of the study area were 1373 making an average household size of 6.6 persons, which is more than the district average 6.1 persons. More than four fifth of the houses 1197 (87.2%), were pacca made of bricks and stones. Nearly one tenth of the houses were katcha (154) made of mud (Figure 1). Qibla Bandi Dam is located about 3 miles from Lawrencepur on Grand Trunk Road and 6 miles east of Hazro Town in Attock district. Geographically it is located approximately on 33°53’26” north latitudes and 70°34’50” east longitudes (map 2). Its construction work started in 1966 on a small tributary of Indus river and completed in 1970 by an amount of 1.33 million rupees. It became operational in 1971. It is concrete gravity flow dam, about 70 feet high and 440 feet long. Its reservoir covering an area of 145 acres has live storage capacity of 1128 acre-feet and normal reservoir level of 1235 feet. Gross storage capacity of the reservoir is 3650 acre-feet while its dead storage capacity is 692 acrefeet. Average annual inflow into the reservoir is 2920 acre feet while average annual withdrawal from the reservoir for irrigation is 2250 acre feet. Its irrigation system consists of a main channel, which off takes at left side of the main dam. The length of main channel is 14750 ft. There are 21 outlets in the irrigation system. Its command area comprises of 850 Acres. Main objective of the study is to find out the new cropping pattern emerging after the construction of the dam (Figure 2).
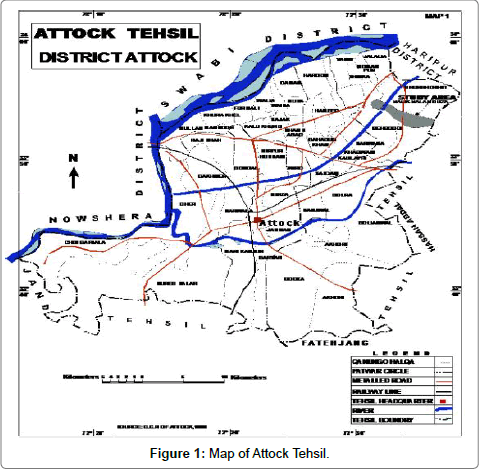
Figure 1: Map of Attock Tehsil.
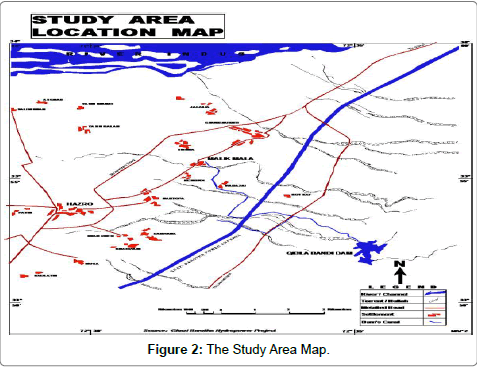
Figure 2: The Study Area Map.
The present study is aimed at analyzing the impacts of Qibla Bandi dam on land use and cropping pattern of the Muoza Malik Mala. The unpublished land utilization and crops data for 1972- 2012 (decadewise) was taken from the revenue record at Revenue Office Hazro. Information about yield acreage (before and after the dam) was also collected from the cultivators by conducting interviews. Map of Tehsil Attock was taken from District Census Report, which was edited and updated with the help of “Freehand” software. The data were arranged classified and tabulated to present the true picture of land use and cropping pattern of the area.
The land that falls between the Ghazi Barotha Channel and Tarbela Hazro road is intensively used for agriculture under irrigation through wells and tube wells. The intensity of irrigated agriculture decreases farther from the road in southeast direction (toward foothills of the Gandghar Mountain). In this area irrigated land is under canal from Qibla Bandi dam. Detailed land use data for the period 1972 to 2012 (decade-wise) are given in Tables 1 and 2 for Rabi and Kharif crops. The land may be classified into the following types.
| Name of crop | Years | ||||
| 1972 | 1982 | 1992 | 2002 | 2002 | |
| Maize | 276 | 288 | 460 | 497 | 620 |
| Bajra /Jawar | 410 | 485 | 37 | 61 | 160 |
| Vegetables | 9 | 4 | 71 | 72 | 48 |
| Ground Nuts | 138 | 144 | 960 | 1028 | 1042 |
| Millets | 275 | 268 | 27 | 2 | 4 |
| Sugar Cane | -- | -- | 4 | 9 | -- |
| Fodder | 3 | 50 | -- | -- | 4 |
| Total | 1102 | 1239 | 1559 | 1669 | 1883 |
Table 1: Mouza Malik Mala. Net Sown Area under Kharif Crops (acres).
| Cropping Season | Crop Type | Before Dam (1972) | After Dam (2012) | Change Area (acres) |
||
| Area ( acres) | %age | Area (acres) | %age | |||
| Rabi | Wheat Barley Gram Fodder Mustard Vegetables |
4408 15 36 47 44 - |
96.90 0.31 0.80 1.02 0.97 - |
4469 14 -- 22 367 61 |
90.3 0.3 0.0 0.4 7.3 1.8 |
61 -1 -36 -25 323 61 |
| Total Area | 4550 | 100.0 | 4952 | 100.0 | ||
| Kharif | Maize Bajra Vegetables Pea nuts Millets |
317 565 11 238 275 |
22.54 40.18 0.78 16.92 19.55 |
620 160 48 1042 4 |
33.0 8.5 2.6 55.4 0.3 |
303 -405 37 804 -271 |
| Total | 1406 | 100.0 | 1883 | 100.0 | ||
Table 2: Change Detection in Cropping Pattern before and after Qibla Bandi Dam.
Classification of land
Cultivated land: It means the area cultivated during the year regardless of the number of crops sown. In 2012 total cultivated area was 6323 acres (51.7 percent) while it was 56% in 1972. Locally the cultivated land is classified into following sub types (Table 3).
| Land Utilization | Years | ||||
| 1972 | 1982 | 1992 | 2002 | 2012 | |
| Chahi | 83 | 217 | 154 | 320 | 281 |
| Nehri | -- | 125 | 369 | 402 | 366 |
| Phara | 60 | 27 | 24 | 4 | 10 |
| Lass | 830 | 699 | 834 | 383 | 540 |
| Maira | 3558 | 3439 | 3151 | 2717 | 3714 |
| Rakkar | 19 | 48 | 2 | 2 | 6 |
| Total | 4550 | 4554 | 4544 | 3832 | 4952 |
Table 3: Mouza Malik Mala, Land Utilization in Rabi Season (area in acres).
a. Irrigated: It is further subdivided into Nehri (land under Qibla Bandi Dam’s canal)and Chahi (irrigated by Persian wheels and electric pumps). In 2012 Chahi land was 285.5 acres and Nehri land was 370 acres.
b. Barani (rainfed) land: The study area generally sown during Rabi season. Total barani land was 5667.5 acres in 2012. Local classification of barani land is as under;
• Phara: (land in the immediate vicinity of the village, heavily manured with high yield per acre). Total area that falls in this category was 30.5 acres in 2012.
• Lass: In productivity it is second to Phara. The soil is loamy and moisture retaining. Its share in total geographic area was 4.7 percent (666 acres).
• Maira: It has loamy soil and is next to lass in producity. Area that falls in this category was 5055 acres in 2012.
• Rakhar: It is sandy and stony land with low yield acreage. In the landuse of the study area its share was only 16.0 acres in 2012.
Uncultivated land: In the study area uncultivated land was 5898 acres in 2012. This type of land is subdivided into culturable waste and land not available for cultivation. Culturable waste (rangeland that provides feed for cattle) was 560 acres while 5338 acres of land (43.7%) was not available for cultivation. Detailed data about land use is given in Table 4.
|
I Cultivated = 6323.0 Acres (50584 Kanals) II Un cultivated = 5898 Acres (47184 Kanals) Total Area = 12221 Acres (97788.70 Kanals) |
Table 4: Land Utilization in Mouza Malik Mala.
Cropping Pattern
This area has two crop seasons namely “Rabi” and “Kharif ”.
Rabi crops: Rabi crops are sown after the rainy season in October and November and harvested in April and May. Main crops of the Rabi season are wheat, barley, mustard, tobacco and vegetables. These crops require lower temperature and moderate rainfall at the time of growth and high temperature and dry season at the time of harvest. Details of net sown area and land utilization from 1972 to 2012 for Rabi crops are given in Tables 1 and 5 respectively. Important Rabi crops of the study area were as under.
| Land Utilization | Years | ||||
| 1972 | 1982 | 1992 | 2002 | 2012 | |
| Chahi | 256 | 257 | 237 | 266 | 361 |
| Nehri | -- | 287 | 257 | 210 | 283 |
| Phara | 14 | 12 | 1 | 2 | 170 |
| Lass | 130 | 74 | 28 | 38 | -- |
| Maira | 688 | 597 | 1036 | 1153 | 1069 |
| Rakkar | 14 | 12 | -- | -- | -- |
| Total | 1102 | 1239 | 1559 | 1669 | 1883 |
Table 5: Mouza Malik Mala, Land Utilization in Kharif Season (area in acres).
Wheat: It is the staple food grain and most important Rabi crop. It covered the largest area (90.3 percent of all Rabi crops). During 1772 the total area under wheat was 4408 acres (96.8 % of the total sown area of the season) of which only 83 acres was under irrigated cultivation.
• Mustard: Area-wise, mustard is the second most important crop. It was cultivated over 7.3 percent of the area under all Rabi crops during 2012. Area under mustard has increased from 44 acres to 367 acres from 1972 to 2012.
• Other Rabi crops include Barley, vegetables, tobacco, gram and fodder crops are other Rabi crops of the village. It is interesting to note that the area under gram declined from 36 acres in 1972 to 0 acres in 2002. Field investigation shows that this decrease is due to the failure of the crops.
Kharif crops: The Kharif crops are normally sown from June to August and harvested in October and November. During this season most of the cultivated area is left fallow because Kharif crops generally need more moisture. Kharif crops are mostly sown in the month of June, which is very hot and dry so there is least moisture in the soil. In 1972 only 17 percent of the cultivated area was under Kharif crops, which increased to 24 percent in 2012. This increase is due to provision of water from Qibla Bandi Dam. Most of the land is left fallow during Kharif season, which proves very helpful in restoring fertility of the soil for Rabi crops.
Important Kharif crops of the mouza as shown in Table 1 are maize, bajra, vegetable, millet, groundnut and sugarcane. Area under all these crops is steadily increasing except millet and bajra as given in Table 5.
According to the revenue record from 1972-2012, after the irrigation canal from Qibla Bandi Dam, there is shift from edible crops to cash crops. Most of the land is utilized for the cultivation of wheat, peanuts, vegetables, mustard and maize etc. There is significant increase in the Kharif and the Rabi net sown areas (Tables 1, 3, 5 and 6). There was increase in net sown area under maize, peanuts, wheat, mustard and vegetables. On the other hand there was very sharp decrease in net sown area under the cultivation of bajra and gram. Area under tobacco was considerable during 1982 and 1992 but there was shift toward wheat and mustard after that period. It was mainly due to increase in the price of those crops (Table 2). Rapid decrease in net sown area in 2002 is obviously due to the construction of Ghazi Barotha Power Channel. About 257 acres of land has been acquired for the said project. Heavy machinery was involved in construction work, so a lot of land remained uncultivated along the both sides of the Power Channel. Due to irrigation facilities from Qibla Bandi Dam, the yield per acre has increased. Its production is almost doubled for majority of the crops. Its detail is shown in Tables 7 and 8 [1-7].
| Name of crop | Years | ||||
| 1972 | 1982 | 1992 | 2002 | 2012 | |
| Wheat | 4408 | 4333 | 4139 | 3552 | 4469 |
| Barley | 15 | 13 | 15 | 19 | 14 |
| Gram | 36 | 41 | 45 | 16 | -- |
| Mustard | 44 | 16 | 91 | 158 | 367 |
| Vegetables | -- | -- | 56 | 65 | 61 |
| Tobacco | -- | 125 | 178 | 9 | -- |
| Fodder | 47 | 26 | 20 | 13 | 22 |
| Total | 4550 | 4554 | 4544 | 3832 | 4952 |
Table 6: Net Sown Area under Rabi Crops (acres).
| Cropping Season | Crop Type | Average Acreage Crop production (kg / acre) |
Average Increase in yield (kg / acre) |
|
| Before the dam | After the dam | |||
Rabi |
Wheat Barley Gram Mustard |
325 280 390 320 |
1200 900 700 550 |
880 620 310 230 |
Kharif |
Maize Jowar Pea nuts Pulses |
250 350 280 200 |
1400 960 620 600 |
1150 610 360 400 |
Table 7: Change in acreage crops yield before and after Qibla Bandi Dam.
| Land Type | Before Dam (1972) | After Dam (2002) | Change (Acres) |
||
| Acres | %age | Acres | %age | ||
| 1. Cultivated i. Irrigated ii. Non irrigated |
6839 248 6591 |
55.96 | 6323.0 655.5 5667.5 |
51.8 | -516.0 407.5 - 923.5 |
| 2. Un cultivated i. Cultivable waste ii. Not available for cultivation |
5382 692 4690 |
44.04 | 5898 560 5338 |
48.2 | 516.0 -132.0 648.0 |
| Total | 12221 | 100.00 | 12221 | 100.00 | |
Table 8: Land Utilization, Change Detection before and after Qibla Bandi Dam.
This study is an attempt to find out to what extent the provision of irrigation water has brought changes in the land utilization and cropping pattern. The findings of the study reveal that net sown area has increased significantly from 1972 to 2012. There is sharp decrease in Rabi net sown area in 2002 which is due to land acquisition and construction work of Ghazi Barotha Channel. There is also change in cropping pattern. Before the dam, the farmers used to grow edible and fodder crops such as barely, jawar, Millets etc. But this trend has changed after the dam. Now more preference is given to cash crops such as peanut, mustard, maize, wheat and vegetables. Qibla Bandi Dam is very beneficial for the study area. It has increased not only the production of crops but per acreage yield of crops also raised.
In the light of present study some recommendations are proposed for improvement in land use and cropping pattern and for betterment of irrigation system.
• Irrigation should be extended to increase the productivity. It is possible to construct a canal from Ghazi Barrage side and irrigation water should be evenly distributed between Ghazi and Attock tehsils like Chishma Right Bank Canal from which both Punjab and NWFP are getting benefit.
• Maintenance and cleaning of the channel should be done on annual basis.
• More vegetation should be grown in catchment area of the dam to check siltation in the reservoir. For this purpose intensive aforestation and rangeland management should be done through line Departments and NGOs.
• New crop varieties should be introduced in the area according to the physiography and climate. Farmers should be informed about nature/texture of soil. Guidance should be provided for the use of suitable fertilizers, seeds and preparation of soil.
• Land holding should be made economical by effective and wellplanned land reforms.