Journal of Horticulture
Open Access
ISSN: 2376-0354
ISSN: 2376-0354
Research Article - (2025)Volume 12, Issue 1
The study assessed the impact of climatic factors on yield of selected apple cultivars at Chencha district, located in 37°29’57” to 37°39’36” E and 6°8’55” to 6°25’30” N, Ethiopia. The data collected for this study includes, yield of selected apple cultivars BR (Bonds Red), Crispin and Granny Smith from Chencha district, observed meteorological data (Chencha, Dorze and Zigti Stations) for the last 15 years and CORDEX-Africa data outputs of HadGEM2-ES for Chencha district under representative concentration pathways (RCP4.5 and RCP 8.5) scenario to make future projections in three time frame 2020's in the near; 2050's in the middle and 2080's in the long term. After assessment of data quality; Bias correction, coefficient of variation, Sen’s estimator and Mann-Kendall's statistical tests were used for trend detection. The HadGEM2-ES scenarios experiments were used for the climate projection. Hargreaves method was used to estimate current apple. The regression and correlation analyses were used to examine the impacts of climate variables on crop water use of apple using XLSTAT software. The result revealed that, the annual rainfall shows increasing trends for all stations except Chencha and the maximum and minimum temperature increased by 0.06°C and 0.02°C per annual respectively. Projection of future rainfall condition suggests that in all season, both RCP 4.5 and RCP 8.5 predicted an increase of precipitation (21 mm to 36 mm) and (15 mm to 31 mm) respectively for all future period. The overall analysis of the mean temperature showed an increasing trend in both scenarios (RCP 4.5 and RCP 8.5). It is clearly seen that maximum and minimum temperature has positive correlation with crop potential evapotranspiration (ETc) of apple. The regression analysis computed for the climate variables and yield of BR, Crispin and Granny smith have coefficient of determination 0.81, 0.65 and 0.68 respectively. The results showed that yield of BR is highly affected by climate variables compared to Crispin and Granny smith.
Trend analysis; Climate variability; Crop evapotranspiration; Correlation; Regression
Apples (Malus domestica Borkh.) are widely cultivated in most regions and districts of Ethiopia under inconsistent climatic condition. Climate change has become one of the great challenges to the development of countries. Precipitation, temperature and solar radiation are the major climatic factors affecting apple growth and yield [1]. Changes in meteorological factors can greatly influence annual changes in apple yield [2]. It is also affecting agriculture and food production. This challenge appears to be more devastating in the case of low-income countries. This is partly because of high vulnerability of poor countries to climatic shocks due to their dependency on agricultural product that accounts a larger fraction of their economy. Agriculture in these countries is mainly climate sensitive because it is determined by the amount of rainfall which mostly lacks consistency. As a result, significant proportions of people living in Ethiopia are facing the risks of food insecurity.
About 66% of the total areas of Ethiopia fall within arid and semiarid climatic zone of the country, Nevertheless, agriculture, which is highly sensitive to climate variability, is the driver of the country’s economy as it accounts for half of Gross Domestic
Product (GDP) and 80% of employment [3]. Thus, the dependence of Ethiopia on agriculture makes its economy extremely vulnerable to the risks associated with climate variability. Moreover, the projected higher temperature and variable precipitation levels will unequivocally depress apple as well as other crop yields through direct effects as well as indirect impact by triggering insect pests, diseases and weeds.
Ethiopian highlands are endowed with a mosaic of soils and climate which is suitable for the production of temperate fruits such as apple. Apple fruits were introduced to Ethiopia in 1950's by the British protestant Missionaries in Chencha, Gamo Highlands of Southwest Ethiopia. Apple production is impacting the livelihood of Chencha community in a better way, for its high production on small plot of land and relatively its high marketing price. Nowadays it is the major source of household income [4]. However, apple production in the study area is characterized by poor agronomic practices resulting in poor yields and quality. Apple require a period of low temperatures (cold season) for their successful growth and flowering and a season of relatively high temperatures (hot season) in order to mature fruit of good quality [5]. Therefore, the objective of this study is to assess the impact of climate variability on the yield of selected apple cultivars that had been grown under the study area of Chencha.
Description of the study area
Location: The study was conducted in Gamo zone of southern nation nationalities peoples regional state, Southern Ethiopia about 312 km from the regional capital, Hawasa and about 542 km south of Addis Ababa and 37 km from Arba Minch. Located between 37°29'57" to 37°39'36" E and 6°8'55" to 6°25'30"N. The altitude ranges from 1600 to 3200 masl with a total area of 37,352 hectares. According to CWARDO [6] the area is bordered by Boreda and Kucha woreda in north; Arba Minch Zuriya woreda in the south; Mirab Abaya woreda in the east and Dita woreda in the west.
Climate of the study area: The district is categorized mainly into two agro-climatic zones; Dega (2300-3200 masl 82%) and Woinadega (1500-2300 masl 18%). The average annual rain fall is 1100 mm ranging between 800 mm and 2000 mm and characterized bi-modal rain fall pattern. The minimum and maximum temperature records demonstrate to vary between 11°C to 13°C and 18°C to 26°C respectively.
Demographic characteristics: Chencha is one of the densely populated areas in the region. According to the CSA projection of (2021), it has a total population of 126, 382 (58,136 males and 68,246 females). Thus, sex ratio is less than one (0.85); this may be attributed due to outmigration of males from the woreda to other town of the country, particularly, Addis Ababa (main city of Ethiopia) for weaving. Out of the total population, 15,000 (12%) are urban dwellers and the remaining 111,382 (88%) are rural dwellers.
Socio economic activities: The major means of livelihood is subsistence rain-fed agriculture followed by traditional weaving. The soil types of the district are generally claying loam, red clay, verity soil and sandy these have low productivity due to traditional and fragmented farming, low contents of organic matter and nitrogen. The land holding size of the farm households is highly fragmented and very small averaging to 0.25 hectare. Majority of the farmers plough their starved plot of land manually via hand farm tools. Apple production is impacting the livelihood of Chencha community in a better way, for its high production on small plot of land and relatively its high marketing price. Nowadays it is the major source of household income.
Data source
Location of meteorological stations near Chencha district data is presented in Table 1.
| No | Station name | Longitude | Latitude | Elevation (masl) | Data period used (yrs) |
|---|---|---|---|---|---|
| 1 | Dorze | O6°48’65” N | 037°34’47.8 E | 1952 | 2005-2020 |
| 2 | Chencha | 06°13′55.3″N | 037°34′33.2″E | 2700 | 2005-2020 |
| 3 | Zigti | 06°1′31″N | 037°33’18E | 1800 | 2005-2020 |
Table 1: Location of meteorological stations near Chencha district.
Observed data: Daily observed meteorological data of rainfall, maximum and minimum temperature used here for the analysis were obtained from National Meteorological Agency, Ethiopia. Among meteorological stations found near Chencha district three meteorological stations (Chencha, Dorze and Zigti) in between 2005-2020 (duration of about 15-years data) records were used for the present study. Selected apple cultivars data was required for correlation and regression of the model. The crop data have been collected from district agricultural office and high land fruits cooperatives (Table 2).
| No | Cultivars | Cultivated land (hector) | Production (Kg) | Productivity (g/tree) |
|---|---|---|---|---|
| 1 | BR | 142.2 | 21413.8 | 57.8 |
| 2 | Crispin | 58.14 | 2854 | 48.8 |
| 3 | Grany smith | 244.26 | 20007.73 | 78.67 |
Table 2: Apple data collected for the study.
CORDEX data: Coordinated Regional Climate Downscaling Experiment (CORDEX) data project is formed under World Climate Research Program (WCRP) to improve regional climate projection worldwide during fifth Assessment Report (AR5) of Inter-governmental Panel on Climate Change (IPCC). The CORDEX data works on several domains worldwide including Africa. For this study, rainfall and air temperature datasets which is dynamically downscaled form Regional Climate Model (RCM) by nesting RCMs into General Circulation Model (GCM)s under representative concentration pathways were obtained from International Water Management Institute (IWMI). The data corresponds to temperature and precipitation which ranges from 1951-2005 as historical periods and between 2006-2100 for the future periods corresponding Representative Concentration Pathways (RCP 4.5) and RCP 8.5. The data is derived from HadGEM2-ES global climate model outputs which are dynamically downscaled by CORDEX-Africa at a grid resolution of 0.5° by 0.5° (approximately 55 km).
Methods of data analysis
Every data set was completed to use it for any models, since the result of the model is determined by the quality of input data. Following data collection required for this study, infilling the missing meteorological data and checking its quality was carried out. Data missing may occur due to failures of measuring devices, personal mistakes in yield amount and shifting the location of stations. Missed climate data for each station was estimated by using the climate data at nearby or neighboring stations based on principles indicated. For this study, normalratio method was used to infill the missed rainfall data when normal annual rainfall at the nearby station differs from the missed station by more than 10% while station-averaged method was used when normal annual rain fall of the station differs by less than 10% from the station with missing data.
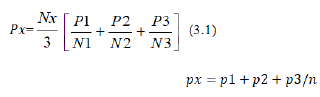
Where, n is number of nearby stations; Px rainfall at missing station "X"; P1, P2, P3...Pn...and N1, N2, N3.... Nn are represents annual total rainfall of respective nearby stations.
Consistence test: Similar to infilling the missed data, consistence check of time series data also crucial to obtain good model result. Hence, consistency test of observed data and interpolation for the missing station has been tested by double mass curve technique for this study. Because it can easily identify which of nearby rainfall stations are to be filled better corresponds to fill the missing observed data at station (i.e., it helps to determine the best correlation out of different stations) used for the analysis. This technique is based on the principles that when each observed data comes from the same population, they are consistent.
The cumulative value at each station is plotted against the combined cumulative values of a nearby station or a group of station and then evaluation was made based on their graph. This implies that, if their graph is straight line, they are consistent, if not the observed data need to be adjusted using equation:
P'x = px*M'/M
Where: p'x corrected rainfall x; Px original observed rainfall at station x; Corrected slope of double mass curve; and M original slope of double mass curve.
As presented in Figure 1 the double mass curve for all stations looks good. Hence, the data records were consistent and it is possible to apply for the analysis of the study according to this double-mass curve principles.

Figure 1: Double-mass curve of rainfall station.
Bias correction for projected data (precipitation and temperature)
The RCP out puts typically have some systematic bias, which is partly due to the fact that the climate models are not calibrated and validated at the district scale. Because of this, a GCM may not simulate climate variables accurately and there is a difference between the observed and simulated climate variable for almost all the GCMs. This difference is known as bias. It is important to remove the bias from the GCM output for projecting the future crop and climatic scenario correctly. Standardization [7] is used to reduce systematic biases in the mean and variances of GCM predictors relative to the observations data. Two transfer methods, delta change and bias-correction, both of which are commonly used methods to account for the biases from the RCM outputs [8]. For this research these methods was used, because the bias in precipitation and temperature will be found to vary spatially [9], used a power transformation, which corrects the CV (Coefficient of Variation) as well as the mean. In this nonlinear correction each daily precipitation amount P will be transformed to a corrected P* using equation.
p*=apb (3.2)
Where
P*=is the simulated data in the projection period, and
b=are the parameters obtained from calibration in the baseline period and subsequently applied to the projection period. They are determined by matching the mean and Coefficient of Variation (CV) of simulated data with that of observed data.
For temperature, monthly systematic biases calculated for the baseline period by comparing RCM outputs with the observations [10]. The monthly mean biases correction is made according to equation,
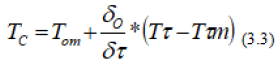
Where;
Tc=Bias corrected future RCM temperature
Tom=Mean of observed temperature in base period
Tτm=Mean of RCM temperature in base period and
Tτ=RCM temperature of base period
δτ and δo=Represent the standard deviation of the daily RCM output and observations in the reference period respectively.
Trend analysis
Trend analysis is an effective method to detect changes in climatic and hydrological variables. The WMO recommends the non-parametric Mann Kendall (MK) test statistic for the assessment of trends IN meteorological data. Hence to describe a trend of a time series Mann Kendall trend test is used to see whether there is a decreasing or increasing trend or not. Mann Kendall statistic (S) is one of non-parametric statistical test used for detecting trends of climatic variables. It is the most widely used method since it is less sensitive to outliers (extraordinary high values with in time series data) and it is the most robust as well as suitable for detecting trends in rainfall.
The reason why Mann Kendall is a pretty good approach is that it is a non-parametric method, meaning that there is no assumption of a statistical distribution (i.e., normal distribution). Furthermore, missing values are allowed. Mann-Kendall can also use data reported as either a trace value or one less than the method detection limit by assigning a common value that is less than the lowest measured value. This is allowed because Mann Kendall uses the relative magnitude of the values to determine a trend and not the measured values. The robustness and simplicity of the Mann-Kendall test reduces the chances for error during the statistical analysis.
Mann-Kendall trend test was used to detect the trend and normalized p-value for significant test. The total score for the time-series data is the Mann-Kendall statistic, which is then compared to a critical value, to test whether the trend in rainfall or temperature is increasing, decreasing or if no trend can be determined. Data for performing the Mann-Kendall analysis should be in time sequential order. The first step is to determine the sign of the difference between consecutive sample results. Sgn (Xj-Xk) is an indicator function that results in the values 1, 0 or -1 according to the sign of (Xj-Xk) where j>k, the function is calculated as follows:
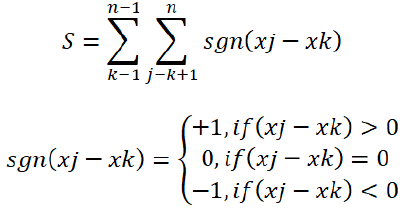
Where Xj and Xk are the sequential precipitation or temperature values in months j and k (j>k) respectively whereas; A positive value is an indicator of increasing (upward) trend and a negative value is an indicator of decreasing (downward) trend. The variance of S, for the situation where there may be ties (that is equal values) in the x values, is given by:

Where, n is the number of tied groups in the data set and is the number of data points in the tied group. For n larger than 10, the standard normal Z test statistic is computed as Mann- Kendall test statistic as follows,
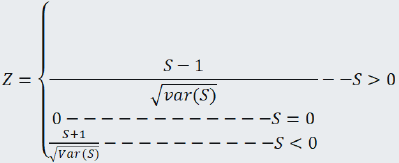
The null hypothesis is consistent with the notion that the observed difference is simply the result of random variation in the data. The presence of a statistically significant trend is evaluated using the Z value. To decide whether the null hypothesis is to be accepted or rejected, a test statistic is computed and compared with a critical value obtained from a set of statistical tables. Ho is rejected if the absolute value of Z is greater than Z1-α/2a/216nd then the trend is considered as significant, where Z1-α/2 is obtained from the standard normal distribution.
Mann-Kendall and Sen‘s slope estimators perform two types of statistical analyses. First the presence of a monotonic increasing or decreasing trend is tested with the nonparametric Mann- Kendall test and secondly the slope of a linear trend is estimated with the non-parametric Sen‘s method. It is the best method to detect trend because it is not affected by outliers and missing data. The slope of n pairs of data points was estimated using the Sen's estimator is calculated as:
Qi =(Xj-XK)⁄(j=k) for i=1…N=...
Where, Xj and Xk are data values at times j and k, (j>k) respectively. The median of these N values of Qi is Sen's estimator of slope. If there is only one data in each time period, then
N=n (n-1)/2
Where n is the number of time periods. The median of the N estimated slopes is obtained in the usual way, i.e., the N values of Qi are ranked by Q1 ≤ Q2 ≤...QN-1≤ QN. And Sen‘s estimator=Q(n+1)/2 if N is odd or (QN/2+Q(N+2)/2)/2 if N is even positive value of Qi indicates an upward or increasing trend and a negative value of Qi gives a downward or decreasing trend in the time series. Both Mann-Kendall and Sen’s were performed with XLSTAT statistical software.
Crop water use estimation
Estimating Evapotranspiration (ETO) is one of the first important steps for calculating crop water requirements in the given location. The rationalization of water consumption in the agricultural fields under current and future climate conditions has economic importance. Quantification of reference evapotranspiration for short grass is necessary in the context of many issues for example, crop production, management of water resources, scheduling of irrigation for rainfall shortage area, evaluation of the effects of changing land use on water yield and environmental assessment.
Therefore, this study will be conducted using the Hargreaves estimation method to estimate ETO. This method is also quite simpler that requires only two climate parameters such as temperature and incident radiation to calculate the evapotranspiration. This method also has been tested using some high quality Lysimeter data and broad ranges in climatological conditions and results revealed as nearly accurate as easy to estimate. Therefore, Hargreaves method is recommended in areas where even reliable data is lacking. The equation for computation of evapotranspiration by Hargreaves method is,

Where, Tmin is daily minimum air temperature, Tmax is daily maximum air temperature and Ra is extraterrestrial radiation in MJ m-2day-1. The mean air temperature (Tm) in the Hargreaves equation is calculated as an average of Tmax and Tmin and Ra is computed from the information on location of site and time of the year. Therefore, air temperature is the only parameter required to use this equation.
Crop Water Requirement (CWR) in drought conditions is different from normal conditions. This implies that in a dry year a crop will require more water than in a wet year. According to International commission on irrigation and drainage, defined the CWR is total water needed for evapotranspiration from planting to harvest for given crop in a specific climate regime. Considering this definition and FAO approach, the crop water requirement for the study area will be determined using the following formula.
ETO=Kc*ETO
Kc=ETo/ETc
Where, ETc is crop potential evapotranspiration, Kc is cropping coefficient and ETO is reference crop evapotranspiration. Average monthly ETO will be calculated using daily weather data of FAO-56 using the Hargreaves method.
Correlation and regression
Correlation and regression were used to examine relationships between monthly and seasonal climatic variables and crop water use. For comparison of two time series, the linear correlation R is a commonly used statistical value, which states if two quantities are related, i.e., it is a measure of the strength of their relationship. The value of R lies between -1 and 1, with 1 for perfect positive correlation, so the correlated time series increase and decrease together, 0 for no correlation and -1 for perfect negative correlation. The developed regression equations were applied to test the effect of change in value of climate parameters has on crop evapotranspiration.
Climate characteristics of chencha district
The amount and distribution of annual and seasonal total rainfall are the basic useful information for agriculture activities over the area. The mean annual rainfall varies from 1280.24 mm (Chencha), 920.07 mm (Dorze), to 972.38 (Zigiti) and is highly variable temporal and spatial. Above 60% of the total annual rainfall is received during Kiremt season in all the stations. Chencha and Dorze have longer rainy periods followed by Zigiti. All stations found in the study area shown the bimodal rainfall types. Kiremt and Belg contribute about 62.8 and 32.3 percent of total annual rainfall respectively. The CV of Belg rainfall is higher than Kiremt rainfall which indicates that Belg was higher temporal variability. The short rainy season, extends from March to May and the long rainy season, extends from June to September. The rainfall distribution during this period varies between 5 mm to 186 mm with a peak in July/August. Seasonal and annual rainfall variations in Ethiopia are the result of macro-scale pressure systems and monsoon flows which are related to the changes in the pressure systems, such factors along with the effect of El Nino determine the rainfall amount and its distribution. The amount and distribution of rainfall on the other hand determines the availability of water for crop production in a given region.
The warmest month of the year are March and April while the coldest are July, August and September (Figure 2).

Figure 2: Long term means monthly maximum (Max) and minimum (Min) temperature for Dorze (A) and Zigt (B) station with in the study area (2005-2020).
Trend analysis
Annual and seasonal rainfall trend: The long-term trend of observed rainfall and temperature were evaluated in terms of annual time series using non-parametric Kendall trend test at significance level of 5%. Normalized p-values were used for significance test in this study. This implies that the null hypothesis is rejected when p-value is less than the significance level at alpha 0.05 and the alternative hypothesis should be accepted and vice versa. The time series of annual rainfall at the three selected stations in the study area are shown in Table 3 below, the two stations (Dorze and Zigiti) show increasing trends while, Chencha registered decreasing trends.
The Mann-Kendal trend test result of observed annual rainfall shows statistically significant upward trends for Dorze and Zigiti While downward trend is observed for Chencha station. This implies the trends of rainfall over the study area are not uniform and consistent in both time and space.
| Rain fall (mm) | ||||
|---|---|---|---|---|
| Station | Mann-Kendall (S) | Kendall’s tau | p-value | Sen’s |
| Chencha | 7 | 0.067 | 0.767 | 3.5 |
| Dorze | 41 | 0.39 | 0.048 | 17.36 |
| Zigiti | 67 | 0.638 | 0.001 | 71.52 |
Table 3: Mann-Kendal trend test and statistical summary of annual rainfall at three stations.
Annual and seasonal temperature trend
Most studies showed that temperature is expected to rise worldwide and the result was also found relatively similar for this study as shown in figure below. As summarized in table below for each station both maximum and minimum temperature respectively indicates warming trend. On average, maximum and minimum temperature in the study area increased by 0.06°C and 0.02°C per annual, respectively. Similarly, increasing trends for maximum temperature was observed at two stations. For minimum and maximum temperature station indicates increasing trend (Table 4).
| Trend test | Stations | |||
|---|---|---|---|---|
| Dorze | Zigiti | |||
| Maximum temperature | Minimum temperature | Maximum temperature | Minimum Temperature | |
| SI | 35 | 35 | 29 | 41 |
| Kendall’s tau | 0.33 | 0.33 | 0.27 | 0.39 |
| p-value | 0.09 | 0.09 | 0.16 | 0.05 |
| Sen’s | 0.16 | 0.07 | 0.21 | 0.17 |
Table 4: Mann Kendal trend test and statistical summary of annual maximum and minimum temperature at two stations.
Generation of climate scenario
Comparison of observed and dynamically downscaled model output RCP bias correction of precipitation: The mean annual measured rainfall amount of Chencha, Zigit and Dorze stations and dynamically downscaled model simulation output for baseline period was compared for this study. The observed average annual rainfall of Chencha, Zigit and Dorze stations was about (1280.24 mm, 972.38 mm and 920.07 mm respectively bias-corrected historical RCP (1271.39 mm, 908.33 mm and 922.44 mm) and bias-uncorrected (3674.88 mm, 3674.88 mm and 3674.88 mm) respectively. In comparison, the dynamically downscaled model simulation shows good agreement while slightly underestimation of model simulation outputs (Table 5 and Figure 3).
| Chencha station | Annual rainfall (mm) | Bias (%) | CV (%) | Correlation |
|---|---|---|---|---|
| Observed | 1280.24 | - | 0.55 | - |
| Bias-corrected RCP | 1271.39 | -0.61 | 0.57 | 0.99 |
| Bias-uncorrected RCP | 3674.88 | -187.04 | 0.97 | 0.49 |
Table 5: Performance evaluation of observed vs. dynamically downscaled historical RCP datasets of average annual rainfall of Chencha station.

Figure 3: Comparison of monthly rainfall observed uncorrected RCP and corrected RCP of Chencha station.
The performance evaluation result shows best as evaluated with CV, bias and correlation. The result shows that, the degree of rainfall variability of Chencha, Zigiti and Dorze was almost similar with (CV=0.55%, CV=0.55% and CV=0.50%) for observed and (CV=0.57%, CV=0.57% and CV=0.52%) for biascorrected RCP data while slightly underestimation with bias and good linear relationship as evaluated by correlation (Corr.=0.99) for bias-corrected model simulation data. The average monthly rainfall, maximum and minimum temperature graph also depicts similar pattern with observed climate datasets for the stations.
However, during January and December there is a variation of rainfall while its performance evaluation shows acceptable range. This may be, because at individual point regional scale predictors of rainfall variation is poorly resolved compared to temperature. After correcting the bias model simulation outputs the pattern of rainfall relatively closer to the observed rainfall for three stations; this suggests the significance of bias correction.
Over all, the performance of model simulation outputs was evaluated to understand in replicating or capturing observed average annual rainfall for three stations. Generally, it is found that good agreement with each other and they have similar pattern in terms of replicating or capturing observed average annual rainfall datasets for stations. Therefore, it is possible to use the dynamically downscaled HadGEM2-ES out puts of rainfall, maximum and minimum temperature for future projection over study area.
RCP bias correction of temperature
Dorze station: As compared with observed maximum temperature of Dorze station, the RCP bias correction slightly shows overestimation for the months of March and April and over estimate for June and July. Otherwise, it showed better fit with other months. In other words, the patterns and trend of the downscaled maximum temperature shows good agreement with observed values. And also, RCP bias correction shows over estimate for the months of August and September and underestimate for the months of November and December for minimum temperature of dorze station. For other months it showed better fit with observed values (Figures 4 and 5).

Figure 4: Mean daily observed, historical uncorrected and corrected maximum temperature of Dorze station.

Figure 5: Mean daily observed, historical uncorrected and corrected minimum temperature of Dorze station.
Assessment of climate change pattern under RCP scenario
The generated future climate scenario was divided into three consecutive 30 years of data ranges based on the recommendation of the WMO as the 2020's, being 2020's in the near; 2050's, being 2050's in the middle and 2080's, being 2080's in the long term. The bias correction technique was applied to correct the raw RCPs data for future period (2020's, 2050's and 2080's) under the IPCC SRES RCP 4.5 and RCP 8.5 emission scenario. A comparison of monthly mean precipitation for the three stations and maximum and minimum temperature for each station between the historical record and the future (2020's, 2050's and 2080's) was presented.
Monthly rainfall: The results of downscaling the future precipitation for 2020's, 2050's and 2080-99 using HadGEM2-ES are presented, along with the current observed values for comparison. Figure below presents the general pattern of average monthly rainfall distribution in Chencha station for three future periods under both RCP scenarios. The projected trends suggests that increasing rainfall distribution in all months except February, June, August and March for three future periods under RCP 4.5 and decreasing rain fall distribution for months February, September, November and December under RCP 8.5 scenarios (Figure 6).

Figure 6: Monthly rainfall distribution for scenario RCP 4.5 (B) and RCP 8.5 (A) Chencha
Seasonal and annual distribution of rainfall
Chencha station: At Chencha station Figure 7 below shows, in all season, both RCP 4.5 and RCP 8.5 predicted an increase of precipitation (21 mm to 36 mm) and (15 mm to 31 mm) respectively for all future period. Butin Belg (February to May) season RCP 8.5 scenario predicted a decrease of precipitation (3 mm to 14 mm) and (15 mm to 24 mm) respectively for all future period. In Kiremt (June to September) both RCP 4.5 and RCP 8.5 predicted a decrease of precipitation by 2050's.

Figure 7: Seasonal and annual rainfall distribution for scenario RCP 4.5 (left) and RCP 8.5 (right) of chencha station.
Temperature pattern
The projected average daily maximum temperature of two stations shows similar trends and patterns, which is increasing trend for both RCP 4.5 and RCP 8.5 scenarios. Figure below shows maximum temperature at Dorze station, relative to current period for RCP 4.5 and RCP 8.5 scenarios by 2020's, 2050's and 2080's. The projected of average daily minimum temperature of two stations also shows increasing trend in future climate period by 2020's, 2050's and 2080's for RCP 4.5 and RCP 8.5 scenarios are shown in the Figures 8 and 9 below.

Figure 8: Daily mean maximum temperature (°C) at Dorze station future (2020's, 2050's and 2080's) period.

Figure 9: Daily mean minimum temperature at Dorze station future (2020's, 2050's and 2080's) period.
Crop water use
Potential evapotranspiration: Potential Evapotranspiration (ETo) essentially comprises the simultaneous movement of water from the soil and vegetation surfaces into atmosphere through Evaporation (E) and Transpiration (T). Potential Evapotranspiration (ETo) of the study area was calculated by CROPWAT 8.0 software, which uses the Hargreaves estimation by utilizing the historical meteorological data of maximum and minimum temperature, as seen from Figure 10 for Chencha, the historical observed average potential evapotranspiration (ETo) ) has the peak in March over the Chencha station.

Figure 10: Historical average ETO calculated by using CROPWAT 8.0 for Chencha station.
The observed potential evapotranspiration varied from 3.0 to 4.4 mm/day for Chencha station during the past 15 years. In the study area ETo was very high during the months of March, April, February and October while the minimum value of ETo was found in June, July, August and until mid of September months.
The estimated evapotranspiration for both 2020's and 2050's with two RCP scenarios was analyzed in terms of monthly average, season and annual average for this study. Similar to the projected change of air temperature, increasing evapotranspiration in all months from the baseline period under both scenarios as shown in Figure 10 will be expected. The reason for this increment may be due to elevated projected air temperature over the area. The increment pattern varies from (3.62%-4.89%) in 2020's and (3.94%-4.96%) in 2050's projection for RCP 4.5 scenarios. For RCP 8.5 scenario, the projected increment change to be varies from (3.71%-4.91%) in 2020's and (3.82%-5.06%) in 2050's projections over the area will be expected. The expected magnitude of change is more for RCP 8.5 than RCP 4.5 in comparison, but the magnitude of change will be different for each month. For instance, the ETo will be high in March-May and medium during September-November while relatively low for the other months for both 2020's and long-2050's projections under both RCP scenarios as indicated in Figure 11.

Figure 11: Projected change of average monthly evapotranspiration for RCP 4.5 (A) and RCP 8.5 (B) for both 2020's and 2050's projection period from baseline period in the study area.
The seasonal projected change in Evapotranspiration (ETo) for both RCP scenario and future time frames was presented in Figure 11. Similar to projected air temperature, the result indicates increasing pattern of ETo for each season during both future time frames under both RCP scenarios as summarized in Figure 11. The increment pattern varies from (0.33%-2.32%) in 2020s and (1.21%-4.35%) in 2050's projection for RCP 4.5 scenarios. For RCP 8.5 scenario, the projected increment change to be varies from (0.66%-3.74%) in 2020's and (1.74%-5.77%) in 2050's projections over the area will be expected. The expected magnitude of change is more for RCP 8.5 than RCP 4.5 in comparison, but the magnitude of change will be different for each season. For instance, the ETo will be high in Belge and medium during Bega while relatively low for the Kiremt for both 2020's and long-2050's projections under both RCP scenarios as indicated in Figure 12. However, the magnitude of ETo change is different for each season, which may be resulted due to limited availability soil water in addition to temperature in arid and semi-arid regions. The increase of estimated evapotranspiration will be one of the causes for the reduction of yield over the area.

Figure 12: Projected change of seasonal evapotranspiration for RCP 4.5 (A) and RCP 8.5 (B) for both 2020's and 2050's projection period from baseline period in the study area.
In general, crop productivity is highly dependent on the surrounding climate variables like precipitation and temperature at each stage of their growth and development. The future simulated result shows that there is an increase in crop evapotranspiration and agricultural water requirement will likely to decrease in crop production in the region. The reasons for such phenomenon are due to the increasing in average air temperature and decreasing rainfall amount in the future years. Similar to the present finding, reports that reduction in available water for crop at a certain time of the year will negatively affect crop production and food supplies.
Estimation of evapotranspiration for apple
For calculation of crop evapotranspiration, the crop coefficient (Kc) value of specific crops is needed. The Kc value is different for different plants even in different stages of a single plant. The Kc values of apple were given depending on their stages of development. The Kc values of apple at initial stage are 0.50, at development stage 1.20 and at late season stage 0.5. The lengths of days for the growth stages of the crops were also taken from the FAO No. 56 (2006) and by considering the information from Woreda‘s agricultural office.
The lengths of crop development stages for apple are taken from (FAO 56, 2006) as 60, 120, 600 and 10 during initial, development, mid-season and late season stages. Similarly, the maximum root depth (1.0-2.0), critical depletion 0.55 and yield response function 1.3 for apple are taken from (FAO 56, 2006). All the crop structure data and climate data of the study area are used the CROPWAT software to estimate the water loss through evaporation and transpiration which is known as crop water use of each crop at each stage (Figure 13). The results computed by the CROPWAT show that the crop Evapotranspiration (ETc) of apple were high during development, mid-season and late stages as described in Table 6 below.
| Stages | Length of growth sages | ETC in mm/growth stage |
|---|---|---|
| Initial | 60 | 227.9 |
| Development | 120 | 395.7 |
| Mid-season | 600 | 289.3 |
| Late | 10 | 39 |
| Total | 790 | 952 |
Table 6: Growth stage wise crop evapotranspiration apple for the period 2005-2020.

Figure 13: Growth stage wise crop evapotranspiration apple for the period 2005-2020.
Correlation and regression of apple yield with climate parameter
Results from correlation of apple yield with climate variables (Table 7) shows that all apple yields have positive correlation coefficients, which are strong to acceptable degree of association.
The rain falls and maximum temperature of Dorze and minimum temperature of Zigti have the highest coefficient of correlation with the three varieties of apple yield. Therefore, value of rain falls and maximum temperature of Dorze and minimum temperature of Zigti are affecting apple yield. Rainfall of Chencha, minimum temperature of Dorze and Zigti do not perform significant association with apple yield.
| Apple yield | Rainfall Chencha | Rainfall dorze | Rainfall zigit | Tmaximum.Dorze | Tmaximum.zigit | Tminimum.Dorze | Tminimum.Zigit |
|---|---|---|---|---|---|---|---|
| BR | 0.197 | 0.781 | 0.564 | 0.622 | 0.414 | 0.401 | 0.532 |
| Crispin | 0.295 | 0.595 | 0.333 | 0.622 | 0.428 | 0.38 | 0.52 |
| Granny smith | 0.33 | 0.588 | 0.336 | 0.667 | 0.426 | 0.384 | 0.49 |
Table 7: Correlation coefficient for apple yields with climate variable in the study area.
In spite of some of the slighter pairwise correlations of the climate parameters with apple yield of BR, Crispin and Granny smith, the three climate parameters rainfall, maximum and minimum temperature of three stations have been considered for regression analysis and the resultant equations for the threeapple yield have been given below.
BR=-0.007RCh-0.0197RZg+0.027RDr +6.82TmaxDr-1.14TmaxZg-2.889TminDr+0.429TminZg-57.78
Crispin=-0.001RCh-0.0199RZg+0.014RDr +3.75TmaxDr-2.11TmaxZgt-0.44TminDr-4.01Tmin Zg47.25
GrannySmith=-0.002RCh-0.024RZg+0.019RDr +6.05TmaxDr-1.44TmaxZg-0.92Tmin Dr+0.92TminZg-43.69
Note: Dr=Dorze; Zg=Zigiti; Ch=Chencha
The regression analysis computed for the above climate variables for three stations and apple yield of BR, Crispin and Granny smith have coefficient of determination 0.81, 0.65 and 0.68 (Table 8), respectively. This indicates that 81%, 65% and 68% of the variance in BR, Crispin and Granny smith can be respectively, explained by the three station climatic parameters under study. The implication is that 19%, 35% and 32% of the variance in BR, Crispin and Granny smith apple yield can be respectively, explained by other factors not included in the study (Figure 14).
| Apple yield | R | R2 | Standard error | p-value | F |
|---|---|---|---|---|---|
| BR | 0.9 | 0.81 | 9.92 | 0.035 | 4.34 |
| Crispin | 0.8 | 0.65 | 8.92 | 0.02 | 1.86 |
| Granny Smith | 0.825 | 0.682 | 11.14 | 0.017 | 2.14 |
Table 8: Regression analysis for the apple yield with climatic variables.

Figure 14: Comparison of observed and simulated apple yield for BR, Crispin and Granny smith apple varieties.
Climate variable influence on apple yield
As shown in Table 9 the maximum temperature has the highest coefficient of correlation with apple yield. The value of maximum temperature is affecting three apple yield more compared to rainfall and minimum temperature. This means rainfall and minimum temperature do not perform significant association with apple yield except BR apple yield, because BR is significant association with both rain fall and maximum temperature (Supplementary Figures 1-7). The implication of this result is that, the higher maximum temperature affects the yield of three varieties of apple. Generally when we are comparing type of apple yield BR is highly affected by climate variables more than other two types of apple varieties (Crispin and Granny smith). This revealed that both Crispin and Granny smith more resistance to climate variables compared to BR.
| Apple varieties | Rainfall | Tmax | Tmin |
|---|---|---|---|
| BR | 0.51 | 0.52 | 0.47 |
| Crispin | 0.41 | 0.53 | 0.45 |
| Granny Smith | 0.42 | 0.55 | 0.44 |
Table 9: Correlation coefficient of apple yield with climate variables.
Based on observed and climate data obtained from three meteorological stations, Apple yield data from CWARDO and future climate data dynamically downscaled of HadGEM2-ES under RCP 4.5 and RCP 8.5 including CROPWAT model for crop water requirement. The main findings of the study are summarized below.
The author would like to thank Arba Minch University for their financial support and National Meteorology Agency (NMA), International Water Management Institute (IWMI) and Chencha district Agriculture office for providing necessary data invaluable contributions to this research.
Citation: Jobir K, Mengistu M (2025) Impact of Climate Variability on Productivity of Selected Apple Cultivars in Gamo Highlands, Chencha District. J Hortic. 12:374.
Received: 04-Jan-2024, Manuscript No. HORTICULTURE-24-29023; Editor assigned: 05-Jan-2024, Pre QC No. HORTICULTURE-24-29023; Reviewed: 19-Jan-2024, QC No. HORTICULTURE-24-29023; Revised: 06-Mar-2025, Manuscript No. HORTICULTURE-24-29023; Published: 13-Mar-2025 , DOI: 10.35248/2376-0354.25.12.374
Copyright: © 2025 Jobir K, et al. This is an open-access article distributed under the terms of the Creative Commons Attribution License, which permits unrestricted use, distribution, and reproduction in any medium, provided the original author and source are credited.