Journal of Horticulture
Open Access
ISSN: 2376-0354
ISSN: 2376-0354
Research Article - (2016) Volume 3, Issue 2
Using modified conjoint analysis techniques, two separate yet sequential studies were conducted to gain a better understanding of foliage plant consumers and their plant/purchasing preferences. The first study primarily focused on consumers’ perceptions of a foliage plant and various purchasing conditions. The second study focused on accessories featured with a foliage plant in a retail setting. These studies revealed elements that appealed to each study's population as a whole, to specific demographic groups, and to different segments of the overall populations. Through both studies, the concept of "buy one, get one free" was of strong interest to the majority of participants. Elements related to consumer benefits, such as “this plant has been proven to improve the indoor air quality of your home,” received the highest overall interest in study one, while elements related to plant containers, sleeves, and value garnered high overall interest in study two. Sorting the data by various demographic groups revealed a multitude of differences in consumer preference for foliage plants and plant purchasing experiences, which allow for targeted marketing by foliage plant retailers. K-clustering revealed separate and unique segments in each study. Study one resulted in a larger segment of the sample population (61%) primarily interested in consumer benefits, while the smaller segment (39%) was chiefly interested in plant care. Study two produced a segment (57%) interested in monetary value, as well as a segment (43%) drawn to plants bred by renowned breeders and promoted by sources such as Better Homes and Gardens. These observations will allow nurseries and retailers to customize the plant purchasing experience according to specific consumer preferences, thereby increasing consumer engagement and reinforcing purchasing decisions.
<Keywords: Consumer assisted selection; Rule developing experimentation; Modified conjoint analysis; IdeaMap®; Mind genomics®
InV: Interest Value; CAS: Consumer Assisted Selection; RDE: Rule Developing Experimentation; OLS: Ordinary Least Squares; Tukey’s HSD: Honest Significant Difference; QVC: Quality Value Convenience
In the United States, the foliage component of the floriculture industry continues to be of economic importance. The floriculture industry falls under the horticulture branch of agriculture, and is defined by the United States Department of Agriculture (USDA) as the horticultural specialty concerned with the production of plants for their flowers or showy leaves. In 2014 and 2015, the USDA National Agricultural Statistics Service (NASS) released reports detailing the economic impact of the floriculture industry [1,2]. On a broad scale, the total wholesale value of floriculture crops in 15 U.S. state programs from 2004 to 2014 averaged over four billion U.S. dollars (USD) per year. Specifically, the wholesale value of foliage plant sales in 2013 totaled $631 million, with 779 producers in 15 states running operations with over $100,000 in sales. In 2014, foliage plant sales were valued at $599 million, with 754 producers from 15 states running operations with over $100,000 in sales. Looking to the future, a report on the economic outlook for floriculture crops expects the demand for these crops to increase over the next few years based on consumer data and a recovering U.S. housing market, which could ultimately result in an even greater economic impact [3].
While the revenue generated by the foliage industry is sizable, room for growth exists. Consumer-assisted selection (CAS) is a product development strategy that strives to obtain input from the ultimate consumers to identify the most valuable and desirable components of a product or service [4]. This study follows multiple others that seek to apply CAS to horticultural interests [4-7]. While Colquhoun et al., Gilbert et al., and Olmstead et al. focused on specific fruit productsstrawberries, blueberries and peaches respectively-Levin et al. implemented CAS to understand the aspects of “the iconic flower” [4-7]. This study applies CAS to build a framework for defining the ideal foliage plant and plant purchasing experience for consumers. Hicks et al. found that delight, a “higher level” of satisfaction, significantly impacts a plant consumer’s intention to buy again [8]. By understanding the aspects of foliage plants or purchasing conditions that interests consumers most, retailers could craft foliage products and services that delight consumers, and perhaps increase sales as a result.
Various features of a product may sway a consumer’s decision to purchase the item or not; however, directly assessing human perceptions and preferences is difficult without instilling cognitive bias, which could result in fallacious conclusions regarding the perceptions consumers have about a product [9]. Cognitive bias may be introduced as a consequence of heuristics, social influence, individual motivation factors, or a combination of these [10]. To overcome this problem, modern psychophysics, which quantifies relationships between physical events and psychological responses, can be used as a tool to understand products and individual consumer differences by utilizing the respondent as a measuring device [11]. Moreover, assaying a relatively large population of human subjects with modified conjoint analysis and rule-developing experimentation (RDE) mitigates most interactive issues [12]. RDE is a “systematized solution-oriented business process of experimentation that designs, tests, and modifies alternative ideas, packages, products, or services in a disciplined way using experimental design, so that the developer and marketer discover what appeals to the customer, even if the customer can’t articulate the need, much less the solution” [13]. This method was developed by Mind Genomics Advisors, Inc. (White Plains, NY), and the Wharton School of Business at the University of Pennsylvania (Philadelphia, PA). The software suite IdeaMap®, also developed by Mind Genomics Advisors, Inc. and the Wharton School of Business, allows for the collection of RDE data and the evaluation of it using conjoint analysis in one program, thus streamlining the experimental process. In a relatively expeditious and economical manner, conjoint analysis assays human perception and or preference for singular elements that, when taken together, characterize a product. Using a modified conjoint method employed by RDE allows for the analysis of individual independent variables that are presented in multiple combinations with other variables [13]. If consumers are presented with a single idea, they have an opportunity to shift criteria and adopt a “politically correct” attitude, thus biasing their response to the variable; in contrast, however, presenting an ever-changing mixture of elements makes a criterion shift much more difficult [14]. As a result, the individual element that caused a positive or negative reaction in the consumer can be isolated; this allows the objective assessment of individual elements and their role on purchasing behavior, as well as the affective state they elicit.
The two studies conducted here sought a better understanding of foliage consumers and their plant/purchasing preferences. The results of these studies provided a framework for defining the ideal plant/ purchasing experience, and revealed how that experience varies among different facets of the population. By identifying variation in preference among different demographic groups, retailers could apply this information to target specific segments of their population. These observations of consumer preference could lead to more enjoyable shopping experiences for the consumer and potentially higher profits for the suppliers and retailers of foliage plants.
Design of experimental categories and elements
The purpose of both studies was to determine the ideal plant and purchasing experience for the consumer. The study was approved as exempt by the University of Florida IRB board (IRB201600492). Rule developing experimentation (RDE) and IdeaMap® technology were used to measure consumers’ cognitive perception of plants and plant products. Six categories, or “silos,” about plants and the purchasing experience were selected for the first study: 1) Price Condition, 2) Quality, 3) Care Information, 4) Retailer, 5) Sources of Information, and 6) Benefits to the Consumer. The six silos chosen for the second study focused on plant accessories: 1) Container, 2) Tags, 3) Sleeves, 4) Store Display, 5) Extras, and 6) Endorsement/Promotions. Next, six elements (descriptions) were developed for each category (i.e. Container A1: Biodegradable containers). The vocabulary and phrases that make up each element were selected by the researchers through dialogue with colleagues, industry members, and consumers. Table 1 lists the categories and elements for study one and study two. Additionally, a welcome screen, a rating question (Figure 1), 13-14 demographic questions (Supplemental Tables 1 and 2), and a “thank you” screen were constructed for the study.
| CategoryList | Study 1 | Study 2 |
|---|---|---|
| Category A | Price Condition | Container |
| A1 | This plant is offered at a discounted price | Biodegradable containers |
| A2 | Sold as a weekly special | Traditional green pots |
| A3 | A finished plant arrangement, but it is more expensive than all of the plants individually | Containers with graphics to demonstrate what the plant will look like |
| A4 | Price of this plant is not an issue | Soil pots that allow you to put the plant directly into the ground |
| A5 | Buy one, get one free | Plastic containers |
| A6 | Plant is less expensive because the container is disposable | Clay pots add a nice touch |
| Category B | Quality | Tags |
| B1 | Large brightly colored leaves | Large tags make it easier to find and read the information |
| B2 | This plant has fuzzy/soft leaves | Tags in the shape of the plant are visually appealing |
| B3 | The leaves are shiny and glossy | Biodegradable tags to be more environmentally conscious |
| B4 | The leaves have a fun pattern of colors | Bilingual tags |
| B5 | The plant drapes gracefully over the pot | Tag color should match the container |
| B6 | The leaves have a stylish shape | Graphics on tag show what the plant will look like |
| Category C | Care Information | Sleeves |
| C1 | The plant should be placed indoors or on a patio | Plastic sleeves are more durable |
| C2 | Plant should be watered once or twice weekly | Sleeves with handles allow you to easily move the plant |
| C3 | This plant requires only basic care | Sleeves with graphics |
| C4 | The expected height and width of this plant are clearly labeled | Clear sleeves so that you can see the plant |
| C5 | Fertilizer should be used sparingly | Paper sleeves |
| C6 | An informative plant care tag comes with this plant | Colorful plant sleeves |
| Category D | Retailer | Store Display |
| D1 | Available at Lowe’s | Indoor garden centers |
| D2 | Available at Home Depot | Outdoor garden centers |
| D3 | Purchased at Walmart | Plants displayed on benches |
| D4 | Available at Garden Centers | Plants displayed on racks make good use of the space |
| D5 | Found in a Supermarket | Displaying plants on the floor |
| D6 | Purchased at your local farmer’s market | Small plants displayed by checkout |
| Category E | Sources of Information | Extras |
| E1 | Any questions about this plant can be answered by a plant specialist | Plants that come with a free fertilizer packet |
| E2 | The plant care tag is a great source of information | A free disease control packet with every plant |
| E3 | Information for this plant is easily found on a smartphone while shopping | Plants that come with free soil packets |
| E4 | Signs in the store provide information for this plant | Buy one, get one free |
| E5 | Friends and family have recommended a plant like this | Coupons can be found in the local newspaper |
| E6 | A plant that is easily found on Google | Purchasing a plant enters you into a drawing to win a vacation |
| Category F | Benefits to the Consumer | Endorsement/Promotions |
| F1 | This plant has been proven to improve the indoor air quality of your home | This plant appeared on a TV commercial |
| F2 | The plant may lower workplace stress when placed in your office | A well-known nursery grew this plant |
| F3 | Studies show this plant can lead to enhanced productivity | The nursery that grew this plant is extremely involved in social media |
| F4 | The plant adds a fresh feeling to any room | This plant appeared in Better Homes and Gardens |
| F5 | The colors of the plant go perfectly with my home | This plant is sold on QVC |
| F6 | The plant looks delicate on a windowsill | This plant was produced by a renowned breeder |
Table 1: Experimental design for study 1 and study 2 of categories (A-F) and individual elements (1-6) used to assess the drivers of interest in foliage plant consumersz.
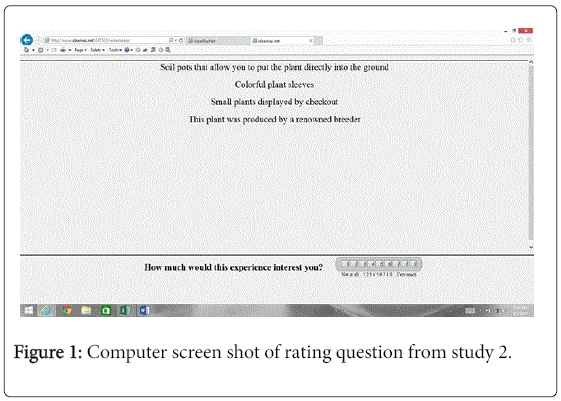
Figure 1: Computer screen shot of rating question from study 2.
| Study 1 | InV | Study 2 | InV | ||
|---|---|---|---|---|---|
| F1 | This plant has been proven to improve the indoor air quality of your home | 11 | E4 | Buy one, get one free | 12 |
| F3 | Studies show this plant can lead to enhanced productivity | 10 | A4 | Soil pots that allow you to put the plant directly into the ground | 7 |
| C3 | This plant requires only basic care | 9 | C4 | Clear sleeves so that you can see the plant | 6 |
| B4 | The leaves have a fun pattern of colors | 9 | E5 | Coupons can be found in the local newspaper | 6 |
| A5 | Buy one, get one free | 8 | C6 | Colorful plant sleeves | 5 |
| E5 | Friends and family have recommended a plant like this | 8 | E3 | Plants that come with free soil packets | 5 |
| B6 | The leaves have a stylish shape | 7 | A1 | Biodegradable containers | 5 |
| C1 | The plant should be placed indoors or on a patio | 6 | E1 | Plants that come with a free fertilizer packet | 4 |
| B3 | The leaves are shiny and glossy | 6 | E6 | Purchasing a plant enters you into a drawing to win a vacation | 4 |
| F5 | The colors of the plant go perfectly with my home | 6 | E2 | A free disease control packet with every plant | 4 |
| D6 | Purchased at your local farmer’s market | 5 | F4 | This plant appeared in Better Homes and Gardens | 4 |
| F2 | The plant may lower workplace stress when placed in your office | 5 | B3 | Biodegradable tags to be more environmentally conscious | 4 |
| B5 | The plant drapes gracefully over the pot | 5 | C2 | Sleeves with handles allow you to easily move the plant | 3 |
| A2 | Sold as a weekly special | 5 | F2 | A well-known nursery grew this plant | 3 |
| F4 | The plant adds a fresh feeling to any room | 5 | F3 | The nursery that grew this plant is extremely involved in social media | 3 |
| E2 | The plant care tag is a great source of information | 4 | A3 | Containers with graphics to demonstrate what the plant will look like | 3 |
| C2 | Plant should be watered once or twice weekly | 4 | F6 | This plant was produced by a renowned breeder | 3 |
| C6 | An informative plant care tag comes with this plant | 3 | A2 | Traditional green pots | 3 |
| D2 | Available at Home Depot | 3 | B2 | Tags in the shape of the plant are visually appealing | 3 |
| E6 | A plant that is easily found on Google | 3 | B1 | Large tags make it easier to find and read the information | 2 |
| A1 | This plant is offered at a discounted price | 2 | B6 | Graphics on tag show what the plant will look like | 2 |
| C4 | The expected height and width of this plant are clearly labeled | 2 | D4 | Plants displayed on racks make good use of the space | 2 |
| A4 | Price of this plant is not an issue | 2 | C5 | Paper sleeves | 2 |
| B1 | Large brightly colored leaves | 2 | D6 | Small plants displayed by checkout | 2 |
| B2 | This plant has fuzzy/soft leaves | 1 | C3 | Sleeves with graphics | 1 |
| A6 | Plant is less expensive because the container is disposable | 0 | A6 | Clay pots add a nice touch | 0 |
| E1 | Any questions about this plant can be answered by a plant specialist | 0 | C1 | Plastic sleeves are more durable | 0 |
| E4 | Signs in the store provide information for this plant | -1 | D2 | Outdoor garden centers | 0 |
| D1 | Available at Lowe’s | -1 | D1 | Indoor garden centers | -1 |
| A3 | A finished plant arrangement, but it is more expensive than all of the plants | -2 | D3 | Plants displayed on benches | -1 |
| D4 | Available at Garden Centers | -2 | B5 | Tag color should match the container | -1 |
| D5 | Found in a Supermarket | -2 | A5 | Plastic containers | -2 |
| D3 | Purchased at Walmart | -2 | F1 | This plant appeared on a TV commercial | -2 |
| E3 | Information for this plant is easily found on a smartphone while shopping | -3 | B4 | Bilingual tags | -3 |
| F6 | The plant looks delicate on a windowsill | -4 | D5 | Displaying plants on the floor | -3 |
| C5 | Fertilizer should be used sparingly | -4 | F5 | This plant is sold on QVC | -6 |
zTheInVs compare the tested elements and are relative to the baseline constant value (the percentage of subjects that would respond favorably to the concept of foliage plants or a foliage plant purchasing experience even if no elements were included) of 38 and 42 for Study 1 and Study 2, respectively. A higher InV indicates that the element positively drives consumer favor; a low InV indicates a negative effect on the consumer. InVs close to zero indicates neutrality: the consumer does not find the element to be motivating one way or the other.
Table 2: A topline presentation of InVs for each element sorted from highest to lowest for study 1 and study 2 (n=259 and 312, respectively)z.
Basic experimental procedures and participant recruitment
The welcome screen, categories, elements, rating question, demographic questions, and thank you screen for each study were then uploaded to the IdeaMap® software at www.ideamap.net. IdeaMap® automatically entered data for each participant, generated individual regression models, determined the optimal combinations of elements, and revealed segments of the population with similar attitudinal patterns [13]. Both studies used Panel Direct Online (www.paneldirectonline.com), a division of Focus Forward, LLC (www.focusfwd.com), to obtain online participants (fielding house subjects). Panel Direct Online used call centers, Twitter, and online advertisements to recruit panelists. Cash rewards and sweepstakes entries were offered for completed surveys. Participants accessed the survey by following a link to the IdeaMap® software. The study subject was first presented with a welcome screen followed by 60 permutations of the element groupings, each with a rating question, with every element appearing exactly 5 times in randomized combinations (Figure 1). The combinations of elements were randomized across participants, as was the order in which the concepts were presented [15]. To mitigate participant fatigue all 60 randomized combinations were unique but the elements were repeated so the participant was not required to imagine novel elements in all 60 concepts. The elements were listed on separate lines in the middle of the page, an easier format to navigate than wading through a crowded paragraph to extract the pertinent information [14]. After rating these groups of 3 or 4 elements (each from a different category) on a 9 point scale (1 being not at all interested and 9 being very much interested), the subject answered 13 (study 1) to 14 (study 2) demographic questions to complete the study (see Supplemental Tables 1 and 2 for demographic questions and sample sizes of each demographic group for Study 1 and Study 2, respectively).
Experimental demographics
The desired distribution was a 50/50 split between men and women and a 25/25/25/25 split between White, Black, Hispanic, and Asian ethnicities. This split was used based upon previous research studies that also used the IdeaMap® technology [4,5]. This split was used to obtain a significant representation of each ethnicity. Before taking study 1, subjects were asked the following screening question: "Have you purchased a live foliage plant for your household or someone else’s household in the past 6 months?” A total of 259 respondents answered “yes” and completed the first study. For study 2, participants were asked “Have you purchased a plant in the last 6 months?” A total of 312 subjects answered “yes” and completed study 2. For the first study, 87% of respondents were between the ages of 25 and 65 (Figure 2). The age groups were divided as follows: 18-24, 25-34, 35-50, 51-65, and 66+. To better assess the age group data in the second study, an additional level was added to the 25-65 age range in lieu of the 66+ category, which accounted for 0% of respondents in the first study. As a result, the second study’s age groups were changed to: 18-24, 25-34, 35-44, 45-54, and 55-64.
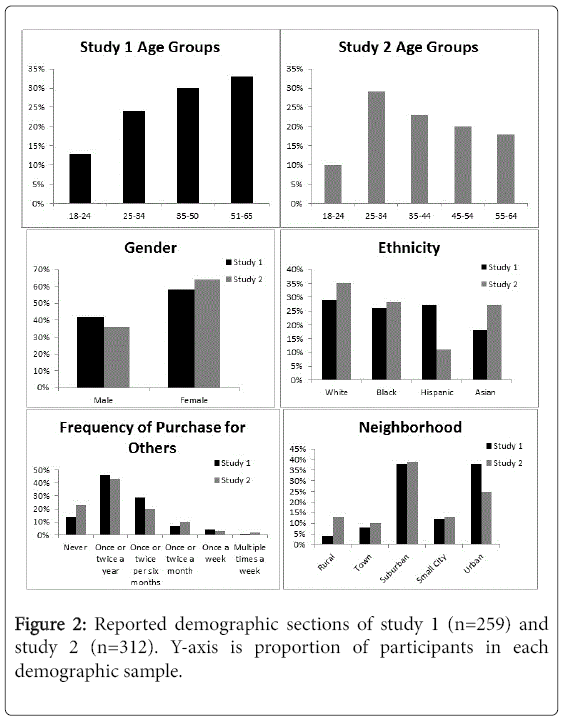
Figure 2: Reported demographic sections of study 1 (n=259) and study 2 (n=312). Y-axis is proportion of participants in each demographic sample.
Experimental variables
Because every element combination comprised 3 to 4 elements from different categories, the combinations were incomplete and elements were removed consecutively, thus eliminating collinearity [16]. All 36 elements were independent of each other, and functioned as the independent variables. Respondents were asked to rate each combination as a whole concept, and this rating was the dependent variable. The rating question appeared as “How much would this experience interest you?” and presented a 9-point scale (1=not at all, 9=very much).
Data transformation and analysis procedures
Data transformation: The mathematical procedures used to transform and analyze the data in this study have been characterized in previous work [13,14,17]. Briefly, data were organized in the IdeaMap® program such that each row corresponded to a test concept, of which there were 60 per respondent. Each row had columns corresponding to the 36 elements, with an additional column containing the rating for that concept, which was the dependent variable. When an element appeared in a concept, a 1 was placed in the column for that element; if the element was absent from a concept, a 0 was placed in the corresponding column [18]. The rating of each concept was then transformed to a binary scale: a score of 1 to 6 was recoded as 0, while a score of 7 to 9 was recoded as 100. This transformation shifted the focus from the strength of the respondent’s feelings about the product to belonging to a class of “concept acceptors” (7-9 or 100) or “concept rejecters” (1-6 or 0). While this may have resulted in the loss of some metric information in the data, such a focus is conventional in consumer research, which is more interested in which class consumers fall [17].
Data analysis: Ordinary least-squares (OLS) regression with dummy variables was used to assess whether the consumer had a negative or positive response to the elements. Dummy variables regression is a type of OLS analysis in which the independent variables (elements) take on either a value of ‘1’ if the element is present in a concept, or a ‘0’ if the element is absent [19]. Essentially, OLS regression related the presence or absence of each element in the concepts to the participant’s rating (the dependent variable) [13,17]. The software package SYSTAT 13 (www.systat.com, Chicago, IL) was used to execute the regression analysis. This analysis compared independent variables (elements) to dependent variables (rating) and gave each element a numerical value. The value each element was assigned was determined by the additive equation:
Rating=k0 + k1 (element A1) + k2(element A2) + … + k36(element F6)
Where k0 was the additive constant and k1 to k36 were coefficients that corresponded to the interest values (InVs) of elements 1 to 36, respectively; this equation was calculated per respondent. The additive constant was a baseline to which the InV of each element was compared to determine an increase or decrease in overall interest for each attribute. Each subject generated an individual additive constant, and an overall baseline constant was determined by averaging all individual constants [4,13,17]. The constant represented the level of interest subjects had to the concepts of the ideal plant and plant purchasing experiences without the contribution of the ensuing elements. InVs are coefficients generated by OLS regression that describe an increase or decrease in interest of each attribute compared with the baseline constant k0 [13]. The coefficients allow for the breakdown of the combinations into their constituent parts, thus revealing the specific input of each element in the combination [20]. The coefficient showed how each element is perceived when it interacts with other elements, which may generate a more realistic response than if each element was tested separately [14]. A higher InV indicated a greater interest in the element. Every RDE study generates its own range of InVs, and thus these values are relative to each other. Larger values indicate that the element has a greater impact. Additionally, a study with a wide range of values indicates that what you say and how you say it affects the consumer [13].
Data segmentation by demographics
To determine if any a priori segments were present, the data from study 1 were grouped by reported gender, age, and ethnicity (see Supplemental Tables 3-5), while the data from study 2 were grouped by reported gender, location, and frequency of purchase of foliage plants for others (see Supplemental Tables 6-8) [12]. Significant differences between levels of various demographic questions were identified with a Student’s t test means comparison analysis or Tukey’s Honest Significant Difference (HSD) test where appropriate using the software package JMP® 12.0.1 (www.jmp.com, Cary, NC). Some demographic samples were not adequately represented, so some groups were combined and others were omitted to obtain similar sample sizes to compare to each other (see Supplemental Tables 9 and 10 for average InVs for each element for all demographic groups in study 1 and study 2, respectively).
| Gender | |||||||
|---|---|---|---|---|---|---|---|
| Men | Women | ||||||
| Base size | 109 | 150 | |||||
| Constant | 41 | 36 | |||||
| Highest | B4 Leaves have fun patterns of colors (10) | F1 This plant has been proven to improve the indoor air quality of your home (14) | |||||
| Highest | F3 Studies show this plant…enhanced productivity (9) | A5 Buy one, get one free (13)* | |||||
| Lowest | A3 A finished plant arrangement…more expensive (-3) | D5 Purchased at Walmart (-5) | |||||
| Lowest | C5 Fertilizer should be used sparingly (-11)* | F6 The plant looks delicate on a windowsill (-6) | |||||
| Age | |||||||
| 18-34 | 35-50 | 51-65 | |||||
| Base size: | 96 | 77 | 86 | ||||
| Constant: | 42 | 49 | 24 | ||||
| Highest | F1 This plant…improve indoor air quality of home (9) | F3 Studies show this plant…enhanced productivity (13) | D6 Purchased at your local farmer’s market (15) | ||||
| Highest | E5 Friends and family recommended a plant like this (9) | F1 This plant…improve indoor air quality of home (9) | F1 This plant…improve indoor air quality of home (14) | ||||
| Lowest | A3 Finished arrangement…more expensive (-7) | E4 Signs in the store provide information for this plant (-7) | E3 Information…found on a smartphone (-2) | ||||
| Lowest | C5 Fertilizer used…sparingly (-8) | E3 Information…found on a smartphone (-11) | F6 The plant looks delicate on a windowsill(-4) | ||||
| Ethnicity | |||||||
| White/Caucasian | Black/African American | Hispanic/Latino | Asian | ||||
| Base size: | 75 | 68 | 70 | 46 | |||
| Constant: | 26 | 35 | 62 | 27 | |||
| Highest | F1 This plant…improve indoor air quality (18) | E5 Friends and family recommended a plant like this (16) | B6 The leaves have a stylish shape (8) | E5 Friends and family recommended a plant like this (21) | |||
| Highest | A5 Buy one, get one free (14) | C3 This plant requires only basic care (14) | C3 This plant requires only basic care (6) | A2 Sold as a weekly special (13) | |||
| Lowest | C5 Fertilizer used…sparingly (-7) | A3 Finished arrangement…more expensive (1) | F6 The plant looks delicate on a windowsill(-12) | E4 Signs in the store provide information for this plant (-3) | |||
| Lowest | E3 Information…found on a smartphone (-10) | B2 This plant has fuzzy/soft leaves (-3) | C5 Fertilizer used…sparingly (-13) | F6 The plant looks delicate on a windowsill (-3) | |||
zTheInVs, shown in parentheses next to their corresponding element, are relative to the baseline constants (the percentage of subjects that would respond favorably to foliage plants even if no elements were presented) for each group, and are used to compare the tested elements. * denotes significance difference at P ≤ 0.05.
Table 3: The two highest and lowest elements and InVs for study 1 compared by gender, age and ethnicityz.
| Gender | |||||||
|---|---|---|---|---|---|---|---|
| Men | Women | ||||||
| Base size | 112 | 200 | |||||
| Constant | 34 | 46 | |||||
| Highest | C4 Clear sleeves so that you can see the plant (12) | E4 Buy one, get one free (14) | |||||
| Highest | E2 A free disease control packet with every plant (9) | A4 Soil pots that allow you to put the plant directly in the ground (10) | |||||
| Lowest | F1 This plant appeared on a TV commercial (-1) | F5 This plant is sold on QVC (-6) | |||||
| Lowest | F5 This plant is sold on QVC (-5) | D5 Displaying plants on the floor (-7) | |||||
| Neighbourhood | |||||||
| Rural/Small Town | Suburban | Small City | Urban | ||||
| Base size | 71 | 123 | 41 | 77 | |||
| Constant | 32 | 39 | 55 | 48 | |||
| Highest | E4 Buy one, get one free(16) | C4 Clear sleeves so that you can see the plant (10) | E4 Buy one, get one free (17) | A4Soil pots…directly in the ground (8) | |||
| Highest | E5 Coupons…in the local newspaper (13) | E4 Buy one, get one free (10) | E5 Coupons…in the local newspaper (10) | B3 Biodegradable tags (8) | |||
| Lowest | D1 Indoor garden centers (-2) | F1 This plant appeared on a TV commercial (-6) | F5 This plant is sold on QVC (-12) | B4 Bilingual tags (-6) | |||
| Lowest | D4 Plants displayed on racks (-3) | F5 This plant is sold on QVC (-8) | A5 Plastic containers (-14) | D5 Displaying plants on the floor (-7) | |||
| Frequency Of Purchase For Others | |||||||
| Never | Once or twice per 6 months (Occasional) | Once or twice a month or more (Frequent) | |||||
| Base size | 72 | 61 | 45 | ||||
| Constant | 28 | 57 | 52 | ||||
| Highest | E4 Buy one, get one free(20) | E4 Buy one, get one free (16) | A1 Biodegradable containers (14) | ||||
| Highest | A4 Soil pots…directly in the ground (16) | E5Coupons can be found in the local newspaper (15) | C6 Colorful plant sleeves (11) | ||||
| Lowest | B5 Tag color should match container (-5) | F1 This plant appeared on a TV commercial(-8) | A3 Containers with graphics (-5) | ||||
| Lowest | C1 Plastic sleeves are more durable (-9) | A5 Plastic containers (-9) | D2 Outdoor garden centers (-5) | ||||
zTheInVs, shown in parentheses next to their corresponding element, are relative to the baseline constants (the percentage of subjects that would respond favorably to foliage plants even if no elements were presented) for each group, and are used to compare the tested elements.
Table 4: The two highest and lowest elements and InVs for study 2 compared by gender, neighborhood and frequency of purchase for othersz.
| Segment 1 “Informed Consumer” Base size: 100 | Segment 2 “Cost-Benefit” Base size: 159 | |||
|---|---|---|---|---|
| Category A: Price Condition | Constant: 38 | Constant: 38 | ||
| InV (SD) | InV (SD) | |||
| A1 | This plant is offered at a discounted price | -5 (38) | 7 (40) | * |
| A2 | Sold as a weekly special | -8 (36) | 12 (45) | ** |
| A3 | A finished plant arrangement, but it is more expensive than all of the plants individually | -11(45) | 3 (43) | * |
| A4 | Price of this plant is not an issue | -6 (42) | 6 (41) | * |
| A5 | Buy one, get one free | 1 (41) | 13• (44) | * |
| A6 | Plant is less expensive because the container is disposable | -14 (35) | 9 (43) | *** |
| Category B: Quality | ||||
| B1 | Large brightly colored leaves | 11 (42) | -4 (42) | ** |
| B2 | This plant has fuzzy/soft leaves | 1 (47) | 0 (39) | NS |
| B3 | The leaves are shiny and glossy | 14 (41) | 1 (41) | * |
| B4 | The leaves have a fun pattern of colors | 14 (40) | 5 (43) | NS |
| B5 | The plant drapes gracefully over the pot | 10 (41) | 2 (42) | NS |
| B6 | The leaves have a stylish shape | 12 (39) | 4 (36) | NS |
| Category C: Care Information | ||||
| C1 | The plant should be placed indoors or on a patio | 17• (40) | 0 (44) | ** |
| C2 | Plant should be watered once or twice weekly | 18• (38) | -5 (43) | *** |
| C3 | This plant requires only basic care | 19• (38) | 3 (40) | ** |
| C4 | The expected height and width of this plant are clearly labeled | 8 (41) | -2 (45) | NS |
| C5 | Fertilizer should be used sparingly | 4 (46) | -9 (43) | * |
| C6 | An informative plant care tag comes with this plant | 10 (36) | -1 (41) | * |
| Category D: Retailer | ||||
| D1 | Available at Lowe’s | -9 (42) | 4 (42) | * |
| D2 | Available at Home Depot | -7 (37) | 9 (43) | ** |
| D3 | Purchased at Walmart | -6 (40) | 0 (41) | NS |
| D4 | Available at Garden Centers | -9 (43) | 2 (43) | * |
| D5 | Found in a Supermarket | -6 (39) | 0 (38) | NS |
| D6 | Purchased at your local farmer’s market | 2 (47) | 7 (46) | NS |
| Category E: Sources of Information | ||||
| E1 | Any questions about this plant can be answered by a plant specialist | 9 (42) | -6(40) | ** |
| E2 | The plant care tag is a great source of information | 15 (38) | -2 (41) | *** |
| E3 | Information for this plant is easily found on a smartphone while shopping | 5 (41) | -7 (38) | * |
| E4 | Signs in the store provide information for this plant | 5 (43) | -4 (42) | NS |
| E5 | Friends and family have recommended a plant like this | 15 (37) | 3 (41) | * |
| E6 | A plant that is easily found on Google | 8 (38) | -1 (40) | NS |
| Category F: Benefits to the Consumer | ||||
| F1 | This plant has been proven to improve the indoor air quality of your home | 4 (43) | 15• (43) | * |
| F2 | The plant may lower workplace stress when placed in your office | 0 (41) | 8 (42) | NS |
| F3 | Studies show this plant can lead to enhanced productivity | 2 (47) | 14• (44) | * |
| F4 | The plant adds a fresh feeling to any room | -2 (37) | 8 (45) | NS |
| F5 | The colors of the plant go perfectly with my home | 2 (37) | 8 (48) | NS |
| F6 | The plant looks delicate on a windowsill | -9 (40) | -1 (46) | NS |
z , * , ** and *** denotes significant differences at P ≤ 0.05, 0.01, or 0.001, respectively, between the InVs of the elements in each cluster. Non-significance is denoted by NS. The three highest scoring elements are denoted by •, while the three lowest scoring elements are denoted by . Standard deviations (SD) from the means comparison analysis are given in parentheses next to each InV.
Table 5: K-cluster analysis (K=2) of the 259 subjects in Study 1 revealed two segments of current or potential foliage plant purchasers that responded favorably to distinct groups of foliage plant attributesz.
| Segment 1 “More for your Money” Base size:177 Constant: 40 | Segment 2 “Advertising Amenable” Base size:135 Constant: 44.3 | |||
|---|---|---|---|---|
| Category A: Container | InV (SD) | InV (SD) | ||
| A1 | Biodegradable containers | 1 (36) | 9 (38) | NS |
| A2 | Traditional green pots | -2 (39) | 9 (39) | * |
| A3 | Containers with graphics to demonstrate what the plant will look like | 1 (39) | 5 (40) | NS |
| A4 | Soil pots that allow you to put the plant directly into the ground | 2 (34) | 14• (41) | ** |
| A5 | Plastic containers | -4 (40) | 1 (36) | NS |
| A6 | Clay pots add a nice touch | -2 (37) | 4 (45) | NS |
| Category B: Tags | ||||
| B1 | Large tags make it easier to find and read the information | 6 (39) | -4 (40) | * |
| B2 | Tags in the shape of the plant are visually appealing | 5 (36) | -1 (35) | NS |
| B3 | Biodegradable tags to be more environmentally conscious | 8 (39) | -2 (40) | * |
| B4 | Bilingual tags | 1 (42) | -8 (38) | NS |
| B5 | Tag color should match the container | 4 (35) | -8 (44) | * |
| B6 | Graphics on tag show what the plant will look like | 8 (41) | -6 (42) | ** |
| Category C: Sleeves | ||||
| C1 | Plastic sleeves are more durable | 0 (40) | 0 (38) | NS |
| C2 | Sleeves with handles allow you to easily move the plant | 1 (38) | 6 (44) | NS |
| C3 | Sleeves with graphics | -1 (37) | 3 (36) | NS |
| C4 | Clear sleeves so that you can see the plant | 7 (38) | 6 (42) | NS |
| C5 | Paper sleeves | -1 (41) | 4 (35) | NS |
| C6 | Colorful plant sleeves | 2 (37) | 9 (41) | NS |
| Category D: Store Display | ||||
| D1 | Indoor garden centers | 2 (37) | -4 (41) | NS |
| D2 | Outdoor garden centers | 6 (38) | -8 (38) | ** |
| D3 | Plants displayed on benches | 4 (36) | -8 (43) | * |
| D4 | Plants displayed on racks make good use of the space | 5 (40) | -3 (39) | NS |
| D5 | Displaying plants on the floor | 6 (42) | -15(44) | *** |
| D6 | Small plants displayed by checkout | 5 (43) | -4 (40) | NS |
| Category E: Extras | ||||
| E1 | Plants that come with a free fertilizer packet | 7 (39) | 1 (39) | NS |
| E2 | A free disease control packet with every plant | 8• (41) | -1 (39) | * |
| E3 | Plants that come with free soil packets | 7 (42) | 2 (41) | NS |
| E4 | Buy one, get one free | 14• (43) | 8 (42) | NS |
| E5 | Coupons can be found in the local newspaper | 13• (39) | -3 (37) | *** |
| E6 | Purchasing a plant enters you into a drawing to win a vacation | 6 (41) | 2 (39) | NS |
| Category F: Endorsement/Promotions | ||||
| F1 | This plant appeared on a TV commercial | -7 (40) | 4 (40) | * |
| F2 | A well-known nursery grew this plant | -2 (40) | 10 (39) | ** |
| F3 | The nursery that grew this plant is extremely involved in social media | 2 (39) | 5 (45) | NS |
| F4 | This plant appeared in Better Homes and Gardens | -4 (40) | 15• (35) | *** |
| F5 | This plant is sold on QVC | -11 (42) | 1 (40) | ** |
| F6 | This plant was produced by a renowned breeder | -4 (44) | 11• (39) | ** |
z, * , ** and *** denotes significant differences at P ≤ 0.05, 0.01, or 0.001, respectively, between the InVs of the elements in each cluster. Non-significance is denoted by NS. The three highest scoring elements are denoted by •, while the three lowest scoring elements are denoted by .
Table 6: K-cluster analysis (K=2) of the 312 subjects in Study 2 revealed two segments of current or potential foliage plant purchasers that responded favorably to distinct aspects of the foliage plant purchasing experiencez.
Cluster analysis
K-cluster analysis [21] was used to find post hoc segments within the total population that had similar InVs. K-cluster analysis was selected to look for market segmentation in the data to see whether consumers clustered for similar plant/purchasing preferences, with the goal of uncovering varying segments of a population’s mind-sets [21]. K-means cluster analysis is often employed in market studies because it yields unambiguous descriptions of the segments, with individuals appearing in only a single segment; moreover, this non-hierarchical clustering method can accommodate the larger sample sizes typically found in market studies [12]. In this application of K-clustering, clustering typically is not evaluated as much by statistical discrimination tests as it is by its usefulness in identifying segments of a population that have similar plant purchasing likes and dislikes, thus revealing potential marketing opportunities that could result in financial return [12]; however, means comparison analyses were still conducted using a Student’s t test of Tukey’s HSD test with the JMP software to determine significant differences between the top and bottom elements of the clusters.
Study 1 topline results
The goal of these two studies was to gain a better understanding of foliage plant consumers and their plant/purchasing preferences. The first study assayed the perceptions of 259 respondents and generated an overall baseline constant of 38. Elements were sorted from highest to lowest InV for the group as a whole (Table 2). The elements with the highest InVs pertained to benefits of the plant to the consumer, simplicity of plant care, aesthetics, and value. On the other end of the scale, the elements that detracted most from consumer interest involved more expensive plant arrangements, specific retailers such as Walmart, and relying on the consumer’s use of a smartphone to find information on a plant.
Study 1 demographic segmentation results
Gender: The data for study 1 were separated according to reported gender (Table 3 and Supplemental Table 3) and the data for study 2 is reported in Table 4. Plants that “can lead to enhanced productivity” (element F3) and plants that “improve the indoor air quality of your home” (F1) were both present in the top four elements for men and women. Both men and women also shared a high interest in plants that “friends and family have recommended” (E5). Women had significantly higher interest (P < 0.05) in plants that were “buy one, get one free” (A5). Interestingly, men greatly disliked (P < 0.05) the element “fertilizer should be used sparingly” (C5).
Age: The data for Study 1 were also grouped by reported age (Table 3 and Supplemental Table 4). To obtain more comparably sized groups, the age groups of 18-24 and 25-34 were combined, resulting in three sets of ages (18-34, 35-50, and 51-65). At least one element from the Benefits to Consumers category was present in the top three elements for each age range, with the plant that can “improve the air quality of your home” (element F1) present in all three groups, while the plant that can “lead to enhanced productivity” (F3) was present in the top three for groups 18-34 and 35-50. Individuals in the 18-34 group had a significantly higher interest (P < 0.05) in being able to look up information on a smartphone (E3) compared with ages 35-50; this element appeared in the bottom three elements for ages 35-50 and 51-65. In contrast, people aged 51-65 were more interested (P < 0.05) than those in the 35-50 range in obtaining information from the plant care tag (E2). Compared with ages 18-34, people aged 51-65 were more interested (P < 0.05) in plants that are less expensive because the container is disposable (A6).
Ethnicity: The data for study 1 were sorted by reported ethnicity (Table 3 and Supplemental Table 5). An element from the Benefits to the Consumer category was present in the top three elements of all ethnicities: the plant that can “improve the indoor air quality” (element F1) received the highest and third highest InV for Caucasians and African Americans, respectively, while the element “studies show this plant can lead to enhanced productivity” (F3) held the third highest InV for both Hispanics and Asians. The element “friends and family have recommended a plant like this” (E5) had the highest InV for Asians and African Americans. Those of Asian and African American ethnicity had significantly (P < 0.05) higher interest than Hispanics in plants recommended by friends and family (E5), while Asians had significantly higher interest than Caucasians in finding information on a smartphone while shopping (E3). African Americans and Caucasians also had significantly higher interest (P < 0.05) than Hispanic individuals in plants with colors that go perfectly with their home.
Study 1 cluster analysis results
Two post hoc market segments [12] from the first study were identified using K-cluster analysis (Table 5 and Figure 3). Clusters were generated automatically in the IdeaMap® software. The first segment contained 39% of the respondents (n=100), while the second segment comprised 61% of respondents (n=159). Both segments generated an overall baseline constant of 38. Individuals belonging to the first segment had the most interest in plant care information (Category C) and the avenues available to obtain this information (Category E). This segment was given the descriptor “informed consumer.” Those individuals belonging to the second segment had greater interest in benefits of the plants to the consumer (Category F) and price condition (Category A). This segment was given the descriptor “cost-benefit.” Significant differences (ranging from P < 0.0001 and P < 0.05) were found between the top and bottom elements of the two segments, demonstrating that the clusters were distinct.
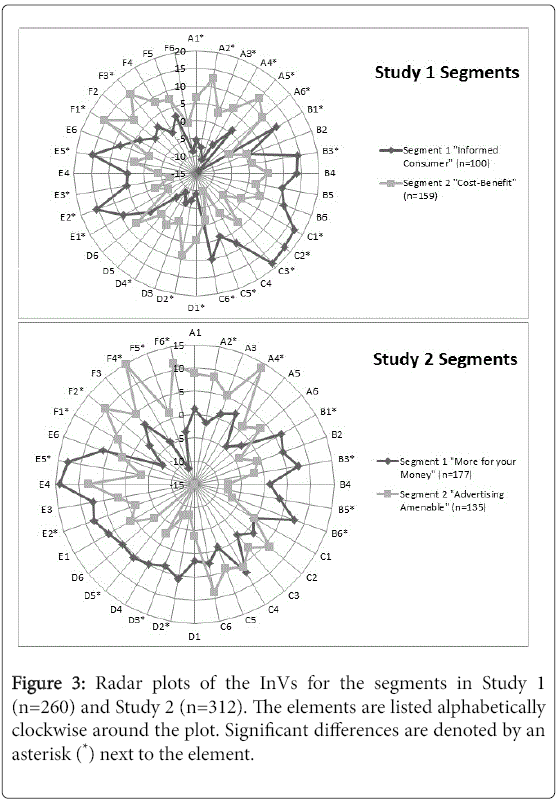
Figure 3: Radar plots of the InVs for the segments in Study 1 (n=260) and Study 2 (n=312). The elements are listed alphabetically clockwise around the plot. Significant differences are denoted by an asterisk (*) next to the element.
Study 2 topline results
The second study assayed 312 respondents for their perceptions of foliage plants at the point of purchase and generated an overall baseline constant of 42. Elements were sorted from highest to lowest InV for the group as a whole (Table 2). Elements from categories pertaining to extras included with purchasing the plant, plant containers, and plant sleeves dominated the highest InVs, with plants that are “buy one, get one free” (element E4) generating the highest overall InV. The elements that detracted the most from consumer interest involved bilingual tags, plants being displayed on the floor, and plants that were featured in television ads or on QVC.
Study 2 demographic segmentation results
Gender: The data for study 2 were separated according to reported gender (Table 4 and Supplemental Table 6). Although no significant differences were found between the preferences of the genders, differences between their top and bottom elements existed. Elements from the “Extras” category dominated the highest InV for women, with the element “buy one, get one free” (element E4) holding the top position. Elements pertaining to the container category also were present in the top elements for women (A4 and A1). The top element for men came from the “Sleeves” category (C4), with other elements from this category present in the top four (C6 and C2). Men also exhibited high interest in elements from the extras category, with elements E2 and E6 rounding out the top five. Fewer elements detracted heavily from interest in men compared with women. Plants displayed on the floor (D5) lowered interest the most for women.
Neighborhood: Sorting the data for study 2 by reported location yielded several notable differences in consumer preference (Table 4 and Supplemental Table 7). Because not all locations were adequately represented, respondents from rural areas and those from small towns were combined into a single group (N=71) to allow for comparison with respondents from urban areas/big cities (N=77). Compared with consumers in urban areas/big cities, consumers in rural areas or small towns had significantly higher interest (P < 0.05) in coupons offered in the local newspaper (element E5), as well as plants that come with a free fertilizer packet (E1). These elements lowered interest for residents of big cities. Additionally, residents of rural areas or small towns displayed greater interest (P < 0.05) in biodegradable containers (A1) compared with residents in big cities, for whom the element was neutral. Residents of rural areas or small towns also demonstrated significantly higher interest in pots that can be put directly in the soil (A4) and plastic containers (A5) compared to those living in small cities. Note that though the number of respondents from rural areas, small towns, and small cities were very similar, these groups each contained only 10% to 13% of the overall sample population, and thus the data from these groups may be limited in broader applications. Most locations differed in their top three elements, but several similarities were observed. The element “buy one, get one free” (E4) appeared in the top three for residents of small towns, suburban areas, and small cities. The element pertaining to “biodegradable tags” (B3) was present in the top three for residents of small cities and big cities, while residents of both rural areas and small cities ranked finding coupons in the local newspaper (E5) in their top three.
Frequency of purchase for others: Study 2 data were re-grouped according to the frequency of purchase of foliage plants for others into three levels: those who never buy foliage plants for others, those who occasionally buy foliage plants for others (once or twice per six months), and those who frequently purchase foliage plants for others (once or twice a month or more) (Table 4 and Supplemental Table 8). When compared to occasional purchasers, those who never purchase foliage plants had a significantly higher interest (P < 0.05) in traditional green pots (element A2). When compared to frequent purchasers, never purchasers exhibited greater interest (P < 0.05) in soil pots (A4) and plants that come with a free disease control packet (E2). The InV for the latter element (E2) was also significantly different (P < 0.05) between never purchasers and occasional purchasers.
Study 2 cluster analysis results
When K-cluster analysis was applied to the second study, two less well-defined, yet still distinct, segments emerged (Table 6 and Figure 3). The first segment contained 57% of participants (n=177), while the second segment contained 43% of the total population (n=135). Individuals belonging to the first segment demonstrated the highest interest in elements pertaining to extras included with the plant (Category E) and plant tags (Category B). This segment was given the descriptor “more for your money.” Consumers in the second segment were most interested in plant endorsements and promotions (Category F) and plant containers (Category A). This segment was given the descriptor “advertising amenable.” Four out of five of the top and bottom elements for the first segment were significantly different (ranging from P < 0.0001 to P < 0.05) from the second segment, while the top four and bottom three elements for the second segment were also significantly different (ranging from P < 0.0001 to P < 0.05).
Within the floriculture industry, foliage plant sales were the third largest contributor to the total wholesale value of floriculture sales according to the Floriculture Crops summaries for 2013 and 2014 [1,2]. By attempting to understand what comprises the ideal foliage plant and foliage plant purchasing experience for the consumer, as well as for specific demographic groups of buyers, breeders, nurseries, and retailers alike can customize their products and how they are marketed to increase consumer interest. By correctly applying the findings of the two studies presented here, this increased interest could translate into greater customer satisfaction and delight, resulting in higher sales for the retailers or foliage products [8].
Study 1
Demographic segmentation: Several elements from the first study emerged as clear drivers of consumer interest of foliage plants. Plants with marketable benefits, such as improving indoor air quality and enhancing productivity, received the highest InVs overall (refer to Materials and Methods for an explanation of interpreting InVs). This observation is consistent with a study by Hall and Dickson (2011) that demonstrates a continued interest and willingness to purchase plant products that enhance the consumer’s quality of life [22]. Retailers could boost the sales of plants with such qualities by featuring this “benefits” information with the plant. Respondents also exhibited high interest in simplicity of plant care. By advertising that a plant requires very little care, sales of such specimens could rise. Other elements detracted from consumer interest for most of the population sampled. More costly, finished plant arrangements were received negatively by most respondents. With this information in hand, retailers may find it useful to review the sales of finished arrangements to determine whether the cost of creating the arrangements is offset adequately by the sale of them. The use of a smartphone to find information on a plant while shopping also decreased interest for most groups of respondents, with a couple of notable exceptions. This element solidly increased interest for individuals in the 18-24 and 25-34 age ranges, which may reflect the surge in use of and growing reliance upon smartphones in younger individuals. According to a 2012 report by the United States Census Bureau (www.census.gov) [23], 70.6% of individuals in the 25-34 age range use smartphones, compared to 40.2% of individuals in the 45-64 age, and only 14.5% of individuals in the 65+ category. Sellers catering to a younger crowd might consider the cost reduction benefits of digitizing plant information; however, retailers in areas with a predominantly older population should consider more traditional forms of relaying information about a plant, such as with plant tags or signs in the store.
Furthermore, the ethnic breakdown in the first study revealed that while some elements have comparable InVs across the ethnicities assayed, other elements had very disparate impacts dependent upon the groups; this observation is consistent with the results from a study by Dennis and Behe that evaluates the effect of ethnicity on gardening purchases and consumer satisfaction and determines differences do exist between groups [24]. Understanding the makeup of a population could benefit retailers: for example, a vendor in Miami, FL may wish to highlight different elements than a retailer in Detroit, MI or Los Angeles, CA. By parsing these variations in preference among different ethnicities and applying the elements accordingly, retailers could better reach the major ethnic populations in their area.
Cluster Analysis Segmentation: Segmentation of the data in the first study revealed two factions of consumers with distinct preferences. The individuals in the “informed consumer” segment demonstrated the highest interest in plant care information and ways to obtain this information. Foliage plant retailers could target this population by providing care information for their foliage plants through a variety of methods. In support of this observation, Mason et al. finds that including extensive care information with a container plant increases purchase likelihood for a large portion of their study population [25]. Moreover, by applying the data generated from the demographic preferences for plant care information and its sources to this “informed consumer” segment, retailers could tailor their marketing even more to target very specific groups of informed consumers, such as individuals in the 35-65 age group, or those with Asian ethnicity. The second, larger segment could be described as the “cost-benefit” group of consumers, as individuals in this group exhibited the highest interest in beneficial aspects of the plants, as well as various price conditions. The observations of Hall and Dickson are again applicable here: consumers value plants and plant products that offer economic, environmental, and health/well-being benefits [22]. To target this segment of the population, retailers could feature information regarding the beneficial characteristics of the plant, and to entice individuals in this segment even more, offer these plants as a weekly special, or periodically as a buy one, get one free deal.
Study 2
Demographic segmentation: The second study identified more elements that enhance consumer interest of foliage plants at the point of purchase. Plants that are “buy one, get one free” garnered the highest overall InV. As such a clear driver of interest, sellers may find periodically offering such specials a lucrative strategy if they are not already doing so. On the other end of the scale, most individuals surveyed responded negatively to plants being displayed on the floor. Efforts to determine the ideal method for displaying plants was largely inconclusive for this study: overall, elements in the store display category evoked either neutral or negative responses from participants. Bilingual tags detracted from consumer interest for most of the population as well, with the notable exception of the Hispanic demographic, for which the element received the highest InV. Merchants in areas with a sizable Hispanic/Latino population should consider the use of bilingual tags if they do not have them already, as this element strongly motivated interest in this group. Additionally, the vast majority of individuals responded negatively to plants sold on QVC. This negative response may reflect the shift in home shopping from television to the internet, or could stem from a lack of name recognition by participants. Further study to elucidate the ideal endorsement and promotion strategies for foliage plants would be required, as none of the other elements in this category performed particularly strongly.
Demographic breakdowns in the second study revealed more opportunities for targeted marketing of foliage plant consumers. Plant vendors in rural areas and small towns might consider offering coupons for foliage plants and their accessories in local newspapers, as participants living in these areas demonstrated high interest in such extras. Retailers could also target foliage purchasers of varying frequencies to increase sales in these brackets. Showcasing a variety of pots, such as traditional green pots, clay pots, and soils pots, could attract attention among those who have never purchased foliage plants for others, while showcasing biodegradable containers may increase interest among frequent purchasers (once or twice a month or more). The basis for the higher preference for biodegradable containers among frequent purchasers (overall, for self and for others) is unknown; however, we speculate that these frequent purchasers may fall into one of several segments identified by Hall et al. that find biodegradable containers particularly appealing [26].
Cluster analysis segmentation: Distinct segments emerged from the cluster analysis of the second study’s data. Consumers in the first segment displayed high interest in extras included with the plant, such as a free fertilizer or soil packet, or another plant as part of a buy oneget one deal. All elements in this category performed strongly for this group. Overall, these elements had the greatest positive effect on interest. To target these “more for your money” consumers, vendors could advertise these extras through various means, or feature the extras alongside the plants in-store. The second segment was less welldefined. Individuals belonging to this “advertising amenable” segment demonstrated clear interest in certain elements from the endorsement and promotions category, as well as several elements from the container category. Sellers of foliage plants could cater to this population by advertising that certain foliage plants were bred or grown by renowned breeders and nurseries, or featured in best-selling magazines such as Better Homes and Gardens.
Strengths and limitations of the Studies
The strength of these studies resides in the ability of modified conjoint analysis and RDE to assay consumer preference while mitigating cognitive bias in a manner that is both time-efficient and cost-effective. The method allows for the parsing of product concepts to determine the elements that strongly motivate consumer interest, and the elements that do not. The studies are constrained by the static, steady-state nature of conjoint analysis as a measurement of preference [12]; however, this limitation is now offset by the cost-effective and expeditious nature of RDE studies that use technology such as the IdeaMap® software. Consumer preferences can be re-assayed periodically to keep abreast of changing trends in the foliage market.
When the two studies are considered together, certain elements stand out as important motivators of consumer interest. In both studies, women responded very strongly and positively to buy one, get one free specials; indeed, most of the population indicated very high interest in this element. Another similarity emerged in the cluster analysis of both studies. The “cost-benefit” consumer from the first study and the “more for your money” consumer of the second study shared an interest in the perceived value of their purchase. Certain elements pertaining to benefits of the plant (from the first study) and extras associated with the plant (from the second study) were also high performers overall. By incorporating the observations from these studies in a manner that is financially feasible, retailers of foliage plants could see their sales rise.
The two studies presented here demonstrate that there is not a singular ideal foliage plant or purchasing experience for everyone; however, they do provide a general consensus of customer preferences. More importantly, these studies effectively identify the differences among buyer preferences, which allows for the targeted marketing of specific segments within the purchasing population. While issues of practicality and cost-effectiveness must be kept in mind, correctly incorporating the input of the ultimate consumer into the development and marketing of foliage products and services could lead to higher customer satisfaction, and as a result, a growth in profits for the foliage plant industry.
The Plant Innovation Center kindly acknowledges the generous support from the National Foliage Foundation.