Journal of Geology & Geophysics
Open Access
ISSN: 2381-8719
ISSN: 2381-8719
Research Article - (2013) Volume 2, Issue 4
The Semi-arid Southwest part of the Punjab has intense agricultural and industrial activity and this part is affected by groundwater salinity problems. To identify the groundwater salinity using isotopes (δ18O) and ion chemistry 22 random samples were collected from semi-arid region of South West Punjab i.e. Bhatinda district. The hydro-chemical analysis shows that the southern and western parts have high values of EC. Some areas in the district especially in north, central and small patches in south-western and eastern parts showing high values of fluoride exceeding the permissible limit of 1.5 mgL-1 for drinking water standards. The water belongs to the category of very hard water. The Na% in groundwater indicates that from 17 groundwater water sampling locations water can be used for irrigation leaving only 5 sampling locations which is found unsuitable for irrigation. The enriched δ18O values are found in the eastern and western parts of the district, while southern and northern parts are showing highly depleted values. The enriched values found between the canals Bhatinda branch and Kotla branch may be attributed to evaporation from shallow water table areas. The enriched δ18O values of groundwater are indicator of salinity. There is an increase in EC and enrichment in isotopic composition as observed in some samples due to the evaporation effect and in some samples the increase is EC is found but the isotopic composition remains constant indicating the increase in EC due to geogenic reasons. Therefore, the integrated data of ion chemistry and isotope is useful for identifying the salinity in semi-arid region.
Keywords: Groundwater, Quality, Isotopic composition, Semi-arid region, Southwest Punjab
Groundwater resources in semi-arid areas are highly vulnerable to salinity problems from natural impacts and also by human influences leading to serious consequences on environment and economy of the region. The unplanned and non-scientific development of ground water resources, mostly driven by individual initiatives has led to an increasing stress on the available resources. The adverse impacts can be observed in the form of long-term decline of ground water levels, de-saturation of aquifer zones, increased energy consumption for lifting water from progressively deeper levels and quality deterioration due to salinity. There are areas in the country, where ground water development is still at low-key in spite of the availability of sufficient resources, similarly the canal command areas suffer from problems of water logging and soil salinity due to the gradual rise in ground water levels.
The groundwater quality is controlled by various factors such as soil characteristics, climate, topography, interaction with aquifer minerals, or internal mixing among different groundwater along flow paths in the subsurface [1-4].
The Punjab plains in the past 3-4 decades witnessed a boom in groundwater use and many authors have studied this problem of depleting water quality and fall in water tables [5-7]. Many districts of Punjab show 100% or even greater levels of exploitation and the same is exhibited by a secular decline in pre-monsoon water tables except for extremely wet years.
The water-logging and deteriorating ground water quality of southwest Punjab, India has affected an area exceeding 200 km2. The reasons for this are considered to be due to inadequate drainage system, excess application of irrigation water, non-exploitation of groundwater resource and excessive use of pesticides. The increasing groundwater salinity is reducing the availability of fresh water for drinking and irrigation needs. More than 75 km2 area has become saline. This is also affecting the crop production. The origin of salinity in soils and in groundwater in shallow and deeper aquifers and its growth in space and time is not well understood.
In the present study, the groundwater quality of Bhatinda district was evaluated from various deep (tube wells) and shallow aquifers, i.e., hand pumps along with the isotopic data to understand groundwater quality and conditions.
Study area
The study is carried out mainly in the Bhatinda district of Punjab. The district covers an area of 3369 sq. km and comprises of 7 blocks (Bhatinda, Nathana, Rampura, Phool, Talwandisabo, Sangat, Maur). The study area is situated between 29°33’ and 30°36’ North latitude and 74°38’ and 75°46’ East longitudes in the southern part of Punjab (Figure 1). It is nearest to the Thar Desert of Rajasthan and far away from the major rivers that run through the state. The monsoon is scanty and meager. The average rainfall is 410 mm. The district is situated within the Satluj-Ganga plain.
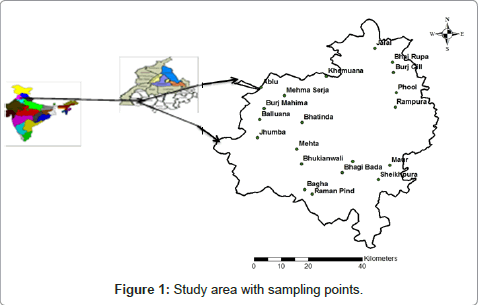
Figure 1: Study area with sampling points.
The random groundwater samples were collected from 22 sites (Figure 1) covering the entire 7 blocks of the Bhatinda district using standard protocol. Sampled wells/tube wells were selected to represent different geological formations as well as land use pattern and different depths of the aquifer.
All water samples were collected in the pre-washed polyethylene bottles. At the time of sampling, bottles were thoroughly rinsed two to three times with groundwater to be sampled. Each hand pump was properly flushed at least for five minutes before taking the sample.
Samples were monitored carefully for electrical conductivity (EC) measurement using in-situ probe and when this parameter reached to constancy, samples were collected. The sampling bottles were carefully filled just to overflowing and ensuring no air bubble is trapped inside the sample container. The samples were brought to the laboratory and stored in a cold room at 4°C.
The sample sites location with latitude & longitude was noted properly in the notebook using Garmin global positioning system (Figure 1). The samples were properly labelled and then immediately transported to the laboratory. All samples were filtered to separate the suspended sediments and the analysis was carried out as early as possible in the laboratory.
The samples were analysed for major anions F-, Cl-, NO3- and cations Ca2+, Mg2+, Na+, K+ using Dionex Ion Chromatograph ICS-5000 and stable isotope (δ18O) was measured using DI-IRMS at Nuclear Hydrology Laboratory, National Institute of Hydrology, Roorkee. For analysis of anions and cations before performing the analysis, Ion Chromatograph was calibrated using anion mixture standard and cation mixture standard. Total permanent water hardness was calculated as sum of calcium and magnesium hardness. After calculating the hardness, the hardness has been classified as per Table 1.
| Class | Range of Total Hardness (mgL-) |
| Soft | 0-60 |
| Moderately hard | 61-120 |
| Hard | 121-180 |
| Very hard | > 180 |
Table 1: Hardness classification for water.
Electrical conductivity ranged from 470 to 6000 μS/cm at 25°C. Around 83% of the district area has been found to have EC value more than 1000 μScm-1 at 25°C out of which 30% of the district area is having EC value more than 3000 μScm-1 at 25°C (Figure 2). The southern and western parts are showing high values of EC. The increase in EC may be due to rise in water levels and possibly due to comparatively more temperature in summers in the areas closer to the desert. This increases the evaporation and salts in soils rise towards surface thus causing salinity.
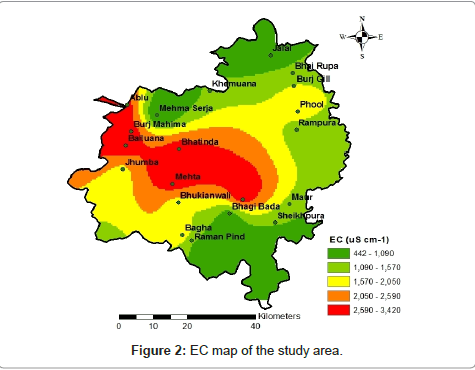
Figure 2: EC map of the study area.
Table 2 provides that the sodium (Na+) values range from 4.70mgL-1 to 509 mgL-1 and the potassium (K+) values range from 8.20mgL-1 to 199 mgL-1. The highest Na+ (509 mgL-1) was found in Ramgarh (Figure 3) and also exceeding the permissible limit (200 mgL-1) of WHO [8].
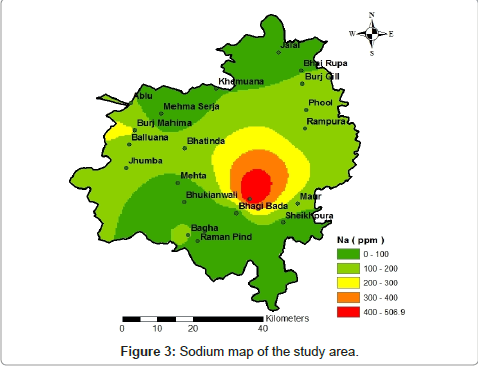
Figure 3: Sodium map of the study area.
| Sampling location | Ion Concentration (ppm) | ||||||||
| Na++ | K+ | Mg++ | Ca++ | F- | Cl- | NO3- | SO4-- | Hardness | |
| MehmaSurja | 22.80 | 8.80 | 24.40 | 62.50 | 0.00 | 86.00 | 3.10 | 27.10 | 257.0 |
| Burjmahema | 199.0 | 21.60 | 39.30 | 41.00 | 1.50 | 210.0 | 30.10 | 289.0 | 264.0 |
| Balluana | 178.0 | 75.80 | 241.0 | 152.0 | 2.60 | 300.0 | 217.0 | 359.0 | 1371.0 |
| Phul | 124.0 | 20.20 | 57.00 | 41.90 | 1.10 | 134.0 | 17.00 | 106.0 | 339.0 |
| Mehta | 168.0 | 30.00 | 218.0 | 229.0 | 4.40 | 337.0 | 69.50 | 529.0 | 1468.0 |
| Phul-300 | 127.0 | 20.10 | 98.40 | 120.0 | 0.60 | 152.0 | 55.10 | 164.0 | 705.0 |
| Bhairupa | 88.50 | 15.90 | 45.20 | 52.0 | 0.90 | 87.50 | 11.20 | 161.0 | 316.0 |
| Bhatinda | 154.0 | 42.00 | 79.60 | 116.0 | 1.10 | 205.0 | 166.0 | 228.0 | 618.0 |
| Rama | 10.20 | 105.0 | 135.0 | 116.0 | 2.20 | 22.40 | 62.00 | 51.40 | 842.0 |
| Rampura | 123.0 | 27.50 | 77.20 | 70.90 | 1.80 | 149.0 | 0.00 | 123.0 | 495.0 |
| Jhumba | 142.0 | 16.40 | 21.30 | 25.30 | 3.60 | 37.30 | 16.90 | 153.0 | 151.0 |
| Khemuana | 85.30 | 19.40 | 90.40 | 77.40 | 1.80 | 51.00 | 12.00 | 146.0 | 565.0 |
| Ablu | 127.0 | 105.0 | 89.30 | 52.00 | 0.80 | 167.0 | 113.0 | 229.0 | 497.0 |
| Bagha | 129.0 | 34.20 | 97.10 | 107.0 | 0.60 | 176.0 | 32.00 | 321.0 | 665.0 |
| Jalal | 20.00 | 199.0 | 37.10 | 41.50 | 2.00 | 7.30 | 7.20 | 47.80 | 257.0 |
| Banawala | 61.00 | 52.40 | 60.80 | 68.00 | 0.80 | 66.40 | 17.40 | 85.70 | 420.0 |
| Bhikianwalai | 23.60 | 8.20 | 43.90 | 37.00 | 0.70 | 62.30 | 46.60 | 69.40 | 272.0 |
| Burj gill | 129.0 | 9.80 | 0.00 | 18.00 | 3.30 | 33.60 | 10.80 | 70.60 | 0.00 |
| Ramgarh | 509.0 | 61.30 | 62.50 | 58.60 | 2.10 | 502.0 | 79.90 | 784.0 | 403.0 |
| Maur | 146.0 | 17.60 | 0.00 | 33.60 | 3.80 | 29.60 | 21.20 | 124.0 | 0.00 |
| Sheikhpura | 74.80 | 23.90 | 77.30 | 101.0 | 1.70 | 59.20 | 2.70 | 119.0 | 571.0 |
| Bhagibanda | 4.70 | 9.90 | 33.80 | 87.40 | 0.80 | 22.90 | 5.40 | 45.10 | 358.0 |
| Minimum | 4.70 | 8.20 | 21.30 | 17.50 | 0.60 | 7.30 | 2.70 | 27.10 | 151.0 |
| Maximum | 509.0 | 199.0 | 241.0 | 229.0 | 4.40 | 502.0 | 217.0 | 784.0 | 1468.0 |
| Mean | 120.0 | 42.00 | 81.40 | 77.60 | 1.80 | 132.0 | 47.40 | 192.0 | 542.0 |
| Range | 504.4 | 191.1 | 219.6 | 212.0 | 3.80 | 494.3 | 213.8 | 257.0 | 391.0 |
| Standard deviation | 104.1 | 45.3 | 58.3 | 49.1 | 1.1 | 122.7 | 56.5 | 180.0 | 349.0 |
Table 2: Water Quality Parameters.
The total hardness varies from 151mgL-1 to 1468 mgL-1 and the water belongs to the category of very hard water.
The fluoride (F) values ranges from 0.60 mgL-1 to 4.40 mgL-1 some areas in the district especially in north, central and small patches in south-western and eastern parts (Figure 4) showing high values of fluorides exceeding the permissible limits of 1.50mgL-1 for drinking water standards [8].
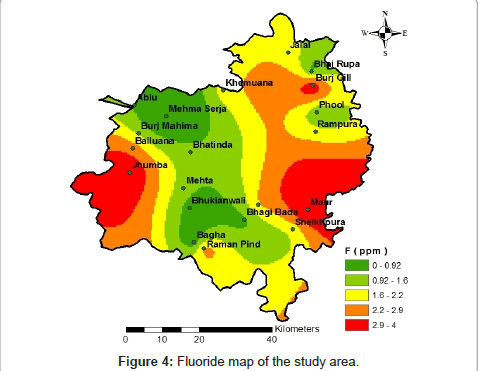
Figure 4: Fluoride map of the study area.
The chloride (Cl-) values range from 7.30 mgL-1 to 502 mgL-1 and the nitrate (NO3-) values range from 2.70 mgL-1 to 217 mgL-1.
The sulphate (SO4--) values ranged from 27.10 mgL-1 to 784 mgL-1 (Table 2, Figure 5). The concentration of nitrate exceeding the permissible limit (50 mgL-1) of WHO [8] was observed in Mehta, Phul, Bhatinda, Rama, Ablu and Ramgarh (Table 2, Figure 6) with the highest being in Balluana (217 ppm). There were some other sites from where nitrate concentrations were close to the permissible limit, i.e. Bhikianwali (46 ppm). The higher nitrate concentration can be attributed to agricultural sources, such as fertilizers, animal waste, crop residues and mineralization of soil organic nitrate and on the other hand non-agricultural sources such as septic tanks, effluents containing nitrogen discharged from industries.
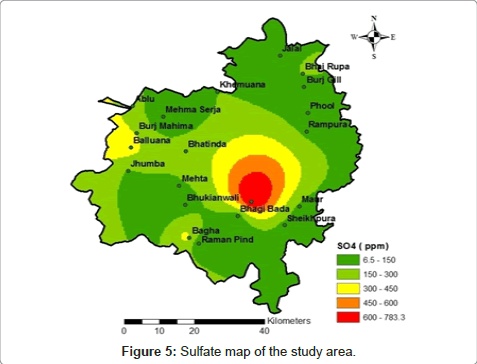
Figure 5: Sulfate map of the study area.
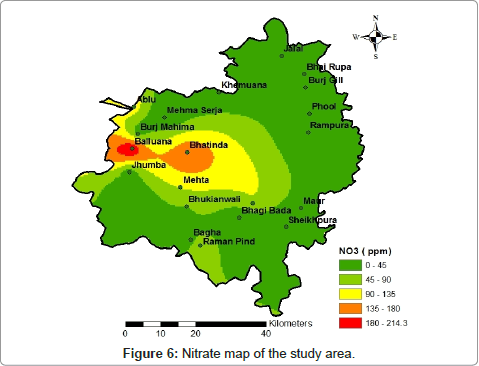
Figure 6: Nitrate map of the study area.
The δ18O values ranged from -5.85 to -11.26‰ with an average of -8.61‰ (Figure 7). The enriched values are found in the eastern and western parts of the district, while southern and northern parts are showing highly depleted values. The enriched values found between the canals Bhatinda branch and Kotla branch may be attributed to evaporation from shallow water table areas.
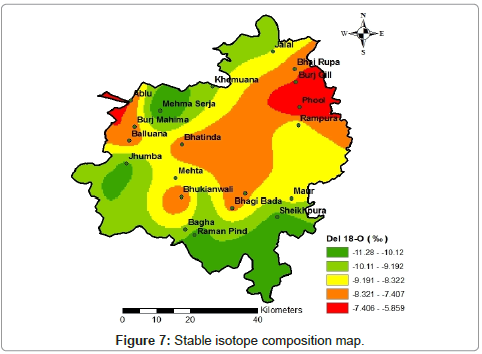
Figure 7: Stable isotope composition map.
The δ18O values ranged from -5.85 to -11.26‰ with an average of -8.61‰ (Figure 7). The enriched values are found in the eastern and western parts of the district, while southern and northern parts are showing highly depleted values. The enriched values found between the canals Bhatinda branch and Kotla branch may be attributed to evaporation from shallow water table areas.
As evident from the Figure 8, there is an increase in EC and enrichment in isotopic composition as observed in some samples due to the evaporation effect and in some samples the increase is EC is found but the isotopic composition remains constant indicating the increase in EC due to geogenic reasons.
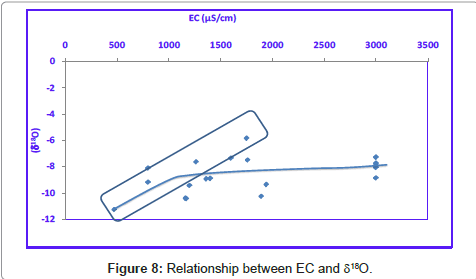
Figure 8: Relationship between EC and δ18O.
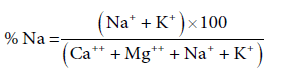
Percent sodium
Sodium plays an important role in evaluating the groundwater quality for irrigation as it causes an increase in the soil hardness and reduction in its permeability. High concentration of sodium causes soil mineral particles to disperse and less water to infiltrate [9]. Its effect becomes as infiltration rate of a soil is reduced to the extent that the crops does receive adequately amount of water. The sodium percentage (Na%) is calculated using the equation (Table 3):
| %Na | Water class | No. of samples | Samples (%) |
| <20 | Excellent | 3 | 13.64 |
| 20-40 | Good | 7 | 31.82 |
| 40-60 | Permissible | 7 | 31.82 |
| 60-80 | Doubtful | 4 | 18.18 |
| >80 | Unsuitable | 1 | 4.55 |
Table 3: Classification of groundwater on sodium percentage.
The Na % in groundwater indicates that 3 samples were excellent, 7 samples were good, 7 samples belong to permissible criterion leaving 4 samples of groundwater in doubtful category (Table 4) and only 1 sample taken from Ramgarh in unsuitable category. Thus, 17 groundwater water sampling locations water can be used for irrigation leaving only 5 sampling locations unsuitable for irrigation. Adsorption of sodium on clay by its exchange with Mg2+ and Ca2+ Ions takes place when sodium is high. This results in poor permeability and drainage of soil, leading to restricted air and water circulation in it and thus makes it hard [9-12]. The areas with high value (doubtful) of Na % in groundwater are Burjmahema, Jhumba, Ablu and Jalal.
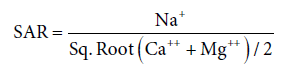
Sodium Absorption Ratio (SAR)
It is used to measure of alkali/sodium hazard to crops. The excessive sodium content relative to the calcium and magnesium reduces the soil permeability and thus inhibits the supply of water needed for the crops. It is an important parameter to determine the suitability of groundwater for irrigation. The excess sodium or limited calcium and magnesium are evaluated by SAR [13].
The SAR values for the samples are shown in Table 4. The SAR value’s indicated that only 3 samples of groundwater taken from BurjMahema, Jhumba and Ramgarh belong to doubtful (S3) category.
| SAR | Water class | No. of samples | Samples (%) |
| <10 | Excellent | 15 | 68.18 |
| 10-18 | Good | 4 | 18.18 |
| 18-26 | Doubtful | 3 | 13.64 |
| >26 | Unsuitable | - | - |
Table 4: Classification of groundwater based on SAR values [14].
The hydrochemical analysis of the study reveals that the groundwater of the study is contaminated in terms of nitrate concentration exceeding much above the permissible limits of WHO. The major cause for nitrate pollution is mainly anthropogenic. The Na % in groundwater indicates that from 17 groundwater water sampling locations water can be used for irrigation leaving only 5 sampling locations which is found unsuitable for irrigation. The enriched values of δ18O are found in the eastern and western parts of the district, while southern and northern parts are showing highly depleted values. The enriched values found between the canals Bhatinda branch and Kotla branch may be attributed to evaporation from shallow water table areas. The enriched δ18O values of groundwater are indicator of salinization.
An increase in EC and enrichment in isotopic composition is observed due to the evaporation effect. Therefore, the integrated data of ion chemistry and isotope is useful for identifying the salinity in semiarid region. On the basis of this study, suitable management practices can be used to overcome the deteriorating quality and improving the sustainability of the groundwater in Semi-arid region of Punjab.
Authors would like to thank Director, National Institute of Hydrology, Roorkee for his constant support and encouragement for conducting this study.