Journal of Proteomics & Bioinformatics
Open Access
ISSN: 0974-276X
ISSN: 0974-276X
Research Article - (2021)Volume 14, Issue 8
Glioblastoma multiforme (GBM) is a malignant tumor affecting the brain or spine, is a fast growing and aggressive brain tumor. There is a need to identify novel targets in GBM to improve our understanding of disease biology and that can be used for developing new therapeutics. Hence, the aim of our study was to explore key genes which are associated with GBM using computational methods. In the present study, we have constructed an interaction network of 159 genes in GBM. 13 out of 159 genes were selected as hub genes using topological analysis methods i.e. CYTOHUBBA and MCODE. Functional enrichment analysis for these 13 genes were performed using DAVID and found that the genes were enriched in various functions and pathways among which regulation of apoptotic process, cell proliferation were the most associated with it. Gene ontology analysis reveals that 14, 111 and 17 terms were found in the cellular process, biological process and molecular function respectively. The survival analysis for these 13 genes was performed using the Kaplan Meier plot. This revealed that 9 out of 13 hub genes were related to overall survival of GBM patients. VEGFA, TP53, STAT3, EGFR, NOTCH2, MMP9, MYC, HRAS, PTEN may serve as potential key genes which are associated with GBM for diagnosis, prognosis and treatment of GBM.
Interacting genes; Tumor; Cancer; Proteins
Glioblastoma multiforme is a tumour of grade IV on WHO classification, is the most aggressive and malignant primary tumor of the brain. This tumor is located in hemispheres or subtentorial tumors in the brainstem and cerebellum [1]. Development of glioblastoma multiforme is mostly associated with reducing the regulation of checkpoint G1/S of a cell cycle and occurrence of multiple genetic abnormalities of tumor cells. Glioblastoma process occurs in the trans-barrier space of the Blood-Brain Barrier (BBB), which prevents the translocation of polarized and/or high-molecular-weight substances from the bloodstream towards the brain. Glioblastoma multiforme treatment includes tumor resection, as well as radiotherapy and chemotherapy. Treatment and prognosis depend on the tumor location, degree of its malignancy, genetic profile, proliferation activity, patient’s age and the Karnofsky performance scale score. Ionizing radiation is one of the few known risk factors to definitely show an increased risk of glioma development and also due to environmental factors like exposure to vinyl chloride, pesticides, smoking, petroleum refining, and synthetic rubber manufacturing can be associated with the development of gliomas [2]. Some Genetic disorders which are related to GBM are tuberous sclerosis, Turcot syndrome, multiple endocrine neoplasia Type IIA, and neurofibromatosis Type I [3]. As we know gliomas are high degrees of intratumor which have not been cured due to its diffuse nature of disease within the brain parenchyma and settled below the pial margin, surround neurons and vessels and migrate through white matter and do not metastasize exterior to CNS [3]. We can expect that GBM may occur due to 4 DNA repairs like nucleotide excision repair, base repair, mismatch or reversal of lesions in recombination. GBM consists of poorly differentiated neoplastic astrocytes, diminished apoptosis, and necrosis. The current diagnosis tools used for diagnosing GBM are Magnetic Resonance Imaging (MRI) and Computed Tomography (CT) scan which uses magnetic rays and x-rays respectively to locate and estimate the size of tumor in the brain. However, these tools fail to recognize the small tumors during its early stages. Hence the need to identify the tumor in early stages is prominent as it can be cured by minimal surgical resection. In this study, DEGs were identified using NCBI gene advanced search builder datasets. Next we constructed a protein- protein interaction network of DEGs based on the STRING database and visualized the network. And then 2 topological analysis methods were adopted to select the hub genes [4]. Modules in the network related to the hub genes were abstracted by MCODE, CYTOHUBBA. In addition, in order to explore the role of the 13 selected hub genes in the pathogenesis of GBM, we performed GO function and KEGG pathway enrichment analysis for the genes using DAVID. Finally, Kaplan-Meier analysis was performed to evaluate the predictive value of these hub genes. Thus, these genes may be used as potential biomarkers.
Search Tool for the Retrieval of Interacting Genes and proteins (STRING)
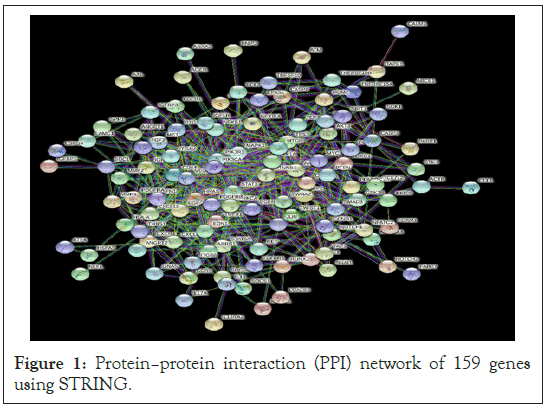
STRING database aims to collect and integrate the information and predict the protein protein interactions(direct), network related to functional pathways (indirect) like post translational modifications, Transcriptional regulation, catalysis, binding and inhibition based on their color coding of interactions[5] and Using NCBI (https://www.ncbi.nlm.nih.gov/), we have retrieved differentially expressed genes of Glioblastoma Multiforme and uploaded 159 genes to the online tool, STRING database (https://string-db.org/) which is used to predict PPI and the database can now also be probed from inside cytoscape software.
Cytoscape
Cytoscape software is open source for complex network analysis, visualization of molecular interaction networks and biological pathways and also integration of these networks with annotations, gene expression profiles.
Cytohubba
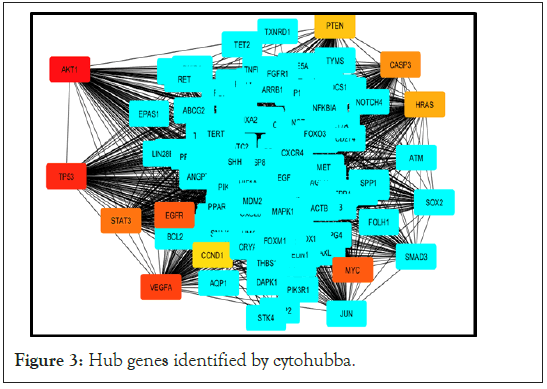
Cytohubba provides a simple interface to analyze a network with eleven scoring methods for degree, Edge Percolated Component, Maximum Neighborhood Component, Density of Maximum Neighborhood Component, Maximal Clique Centrality and six centralities (Bottleneck, EcCentricity, Closeness, Radiality, Betweenness, and Stress based on shortest paths) [6]. The higher the degree of connectivity of nodes, the greater the role of network stability. And the degree of connectivity of each node is calculated by using the plug-in Cytohubba [7]. Here, Red colour node with highest degree, orange colour node with intermediate degree and yellow colour node with lowest degree.
Molecular Complex Detection (MCODE)
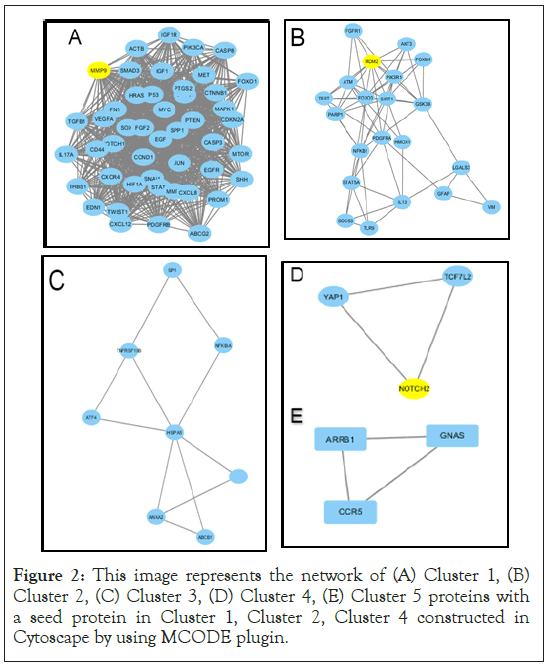
MCODE plugin (application) is integrated in the open-source network visualization and analysis platform of Cytoscape platform used for network clustering that finds highly interconnected regions in a network. The algorithm contains 3 stages; vertex weighting, molecular complex prediction, post-processing. This algorithm has an advantage over other graph clustering methods that is having a directed mode to set the clusters of interest without considering the rest of the network and allows to examine the cluster interconnectivity, which is applicable for protein networks [8].
Database for Annotation, Visualization and Integrated Discovery (DAVID)
DAVID assists in the interpretation of genome-scale datasets by facilitating the transition from data collection to biological meaning which uses an algorithm that condenses the list of genes or associated Biological terms into organised classes of related gene i.e biological modules which reduces redundant results and visualizes [9]. DAVID contains five integrated and web based functional annotation web-based functional annotation tool suites: the DAVID Gene Functional Classification Tool, the DAVID Functional Annotation Tool, the DAVID Gene ID Conversion Tool, the DAVID Gene Name Viewer and the DAVID NIAID Pathogen Genome Browser [10].
UALCAN
UALCAN is a web portal which is used to perform in depth analysis of TCGA expression data. It uses The Cancer Genome Atlas (TCGA) that facilitates the study of variation in gene expression and survival associations across tumors. which analyze relative expression of a query genes, compares these genes between tumor and normal samples and with different tumor subgroups i.e individual cancer stage, tumor grade, patent age, gender; estimates the effect of gene expression level and clinicopathologic features on patient survival and also identifies up and down-regulated genes in individual cancer types [11]. Using UALCAN, we have obtained the Kaplan–Meier plot to evaluate the prognostic values of genes in GBM cancer patients, which was applied to analyze the associations between the identified hub genes and overall survival.
PPI network
After identification of genes, we investigated protein-protein interactions using the STRING database, got a dense network with genes 145 interacting protein with 554 interactions (edges), that is after removal of disconnected nodes/proteins, observed the highly interconnected cluster (with confidence value 0.900) with high degree of functional associations.
Identification of hub genes
We identified hub genes with highest connectivity within the network using cytohubba that resulted in 10 genes i.e, AKT1, TP53, STAT3, EGFR, CCND1, VEGFA, PTEN, CASP3, HRAS, MYC and 3 seed genes MMP9, MDM2, NOTCH2 from cluster 1,2,4 respectively .
Functional enrichment analysis of PPI network and GeneOntology (GO)
Using the DAVID database we analysed both Functional enrichment and Gene Ontology, Functional enrichment analysis for these 13 genes were performed using DAVID and found that the genes were enriched in a variety of functions and pathways among which regulating apoptosis, cell proliferation, positive regulation of epithelium cell proliferation were the most associated with it. And the results of GO functional enrichment indicated GO terms for 111 Biological Processes (BP) as shown in Table 1, 14 Cell Components (CC) as shown in Table 2 and 17 Molecular Functions (MF) as shown in Table 3.
| S. No | Term | Count | P-value |
|---|---|---|---|
| 1 | negative regulation of apoptotic process | 11 | 1.20E-14 |
| 2 | positive regulation of protein phosphorylation | 6 | 1.70E-08 |
| 3 | cell proliferation | 7 | 8.50E-08 |
| 4 | positive regulation of cell proliferation | 7 | 3.50E-07 |
| 5 | response to estradiol | 5 | 3.90E-07 |
| 6 | cellular response to hypoxia | 5 | 4.80E-07 |
| 7 | positive regulation of gene expression | 6 | 6.40E-07 |
| 8 | response to drug | 6 | 1.30E-06 |
| 9 | response to UV-A | 3 | 1.40E-06 |
| 10 | positive regulation of epithelial cell proliferation | 4 | 9.30E-06 |
Table 1: Top 10 terms in BP category.
| S. No | Term | Count | P-value |
|---|---|---|---|
| 1 | nucleoplasm | 9 | 8.10E-05 |
| 2 | nucleus | 11 | 1.90E-04 |
| 3 | cytosol | 9 | 2.90E-04 |
| 4 | cytoplasm | 10 | 1.20E-03 |
| 5 | protein complex | 4 | 2.20E-03 |
| 6 | plasma membrane | 8 | 8.00E-03 |
| 7 | nuclear body | 2 | 2.20E-02 |
| 8 | membrane | 5 | 4.70E-02 |
| 9 | cell surface | 3 | 4.80E-02 |
| 10 | mitochondrion | 4 | 5.20E-02 |
Table 2: Top 10 terms in CC category.
| S. No | Term | Count | P-value |
|---|---|---|---|
| 1 | Identical protein binding | 8 | 2.10E-07 |
| 2 | Enzyme binding | 6 | 2.00E-06 |
| 3 | Protein kinase binding | 5 | 1.00E-04 |
| 4 | Protein binding | 13 | 3.90E-04 |
| 5 | Protein phosphatase binding | 3 | 8.80E-04 |
| 6 | Transcription factor binding | 4 | 9.30E-04 |
| 7 | Double-stranded DNA binding | 3 | 1.50E-03 |
| 8 | Nitric-oxide synthase regulator activity | 2 | 5.70E-03 |
| 9 | Protein complex binding | 3 | 9.00E-03 |
| 10 | Platelet-derived growth factor receptor binding | 2 | 1.10E-02 |
Table 3: Top 10 terms in MF category.
Survival analysis
Kaplan–Meier analysis revealed that 9 out of the 13 hub genes including VEGFA, TP53, STAT3, EGFR, NOTCH2, MMP9, MYC, HRAS, PTEN were related to the overall survival of GBM patients (p<0.5). From the given set of 13 genes, genes of p value <0.5 were considered to be related to overall survival analysis.
Genes or proteins involved in GBM and their related gene network analysis are of immense importance because it provides valuable information on biological and molecular complexes, signaling pathways of those genes, which are considered as reasons for the initiation and progression of disease and may contribute to early diagnosis and to develop effective therapies.
In our study, we have identified DEGs, based on these DEGs a PPI network using STRING (Figure 1) is constructed where 145 nodes formed the network with 554 edges. From the constructed protein network using STRING, we predicted densely interconnected clusters among 159 functional partners using MCODE. Accordingly, we found five (5) efficient clusters (Figure 2). From these clusters we obtained seed nodes MMP9, MDM2, NOTCH2 for cluster 1, cluster 2 and cluster 4 respectively. We also predicted top 10 hub genes (AKT1, TP53, STAT3, EGFR, CCND1, VEGFA, PTEN, CASP3, HRAS, MYC, MMP9, MDM2, NOTCH2) among 159 functional partners using CYTOHUBBA (Figure 3). Then a union of these hub genes i.e. the seed nodes from clusters of MCODE and hub genes from CYTOHUBBA (AKT1, TP53, STAT3, EGFR, CCND1, VEGFA, PTEN, CASP3, HRAS, MYC, MMP9, MDM2, NOTCH2) were selected and subjected to functional enrichment analysis and survival analysis. For functional enrichment analysis we used tools like DAVID. In order to explore the role of the 13 selected hub genes, we performed GO function and KEGG pathway analysis for them. It was observed that a majority of the genes were involved in this pathway, and were interconnected with several other essential processes. From DAVID, the results of GO function enrichment indicated GO terms for 111 biological processes (BP), 14 cell components (CC) and 17 molecular functions (MF), and found that these genes were enriched in various functions and pathways. Kaplan–Meier analysis (Supplementary Figure 1) revealed that 9 out of the 13 hub genes including VEGFA, TP53, STAT3, EGFR, NOTCH2, MMP9, MYC, HRAS, PTEN were related to the overall survival of GBM patients.

Figure 1: Protein–protein interaction (PPI) network of 159 genes using STRING.

Figure 2: This image represents the network of (A) Cluster 1, (B) Cluster 2, (C) Cluster 3, (D) Cluster 4, (E) Cluster 5 proteins with a seed protein in Cluster 1, Cluster 2, Cluster 4 constructed in Cytoscape by using MCODE plugin.

Figure 3: Hub genes identified by cytohubba.
These genes have crucial roles in regulating apoptotic processes and cell proliferation, therefore could serve as potential therapeutic targets and also as biomarkers for prognosis or diagnosis of GBM. VEGFA was recently shown to increase tumor-initiating stem cell abundance in glioblastoma. VEGFA promotes cancer invasion and metastasis through mechanisms that are not fully understood. VEGFA not only creates a vascular niche for expanding stem cells, it was recently shown to increase the stem-like cell population in certain human malignancies, including breast cancer. Hypoxia, caused by angiogenesis inhibitors, stimulates VEGFA gene expression, and would thus contribute to CSC expansion and disease recurrence and progression [12]. From the selected set of genes TP53 was found to be the most mutated gene. It is also one of the most commonly deregulated genes in cancer. The p53-ARF-MDM2 pathway is deregulated in 84% of glioblastoma (GBM) patients and 94% of GBM cell lines [13]. MDM2 targets p53 (protein of TP53 gene) for degradation, acting as a negative regulator. MDM2 transcription is induced by p53, creating a negative feedback loop regulating the activity of p53 and the expression of MDM2. Amplification of MDM2 and MDM4 can inactivate p53, leading to loss of various tumor suppressor functions including growth arrest, apoptosis, DNA repair, and senescence [14]. EGFR plays an important role in tumor growth, participating in cell motility, adhesion, invasion, and angiogenesis [15]. Some reports claim that 97% of primary GBM show EGFR amplification. STAT3 is activated in a high percentage of glioblastoma. It contributes to tumourigenesis in glioblastoma by inhibiting apoptosis, which has been demonstrated by the use of RNAi knockdowns and STAT3 inhibitors [16]. PTEN is a phosphatase which metabolises PIP3, the lipid product of PI 3-Kinase, directly opposing the activation of the oncogenic PI3K/AKT/mTOR signalling network. Accordingly, loss of function of the PTEN tumour suppressor is one of the most common events observed in many types of cancer [17]. MYC serves an oncogenic function by inhibiting differentiation and up-regulating proliferation and also being a mitotic stimulus induces apoptosis and it renders an undifferentiated status to differentiated astrocytes [18]. The NOTCH2, MMP9, HRAS were also found to play an important role in many other cancers. This study provides important clues for exploring potential key genes and targets for the diagnosis, prognosis and treatment of GBM [19-22].
Through topological analysis methods, we identified 13 hub genes for GBM. We validated these hub genes through functional enrichment analysis, Kaplan–Meier analysis. The results suggested that nine of the 13 selected hub genes including VEGFA, TP53, STAT3, EGFR, NOTCH2, MMP9, MYC, HRAS, PTEN may serve as potential prognostic biomarkers and therapeutic targets for GBM. In conclusion, the identified hub genes contribute to the understanding of the molecular mechanisms underlying the development of GBM and they may be used as diagnostic and prognostic biomarkers and molecular targets for the treatment of patients with GBM in the future. However these results need further confirmation by laboratory experiments.
Citation: Niveditha D, Jahanavi M (2021) Identification of Potential Key Genes Associated with GBM using Computational Methods. J Proteomics Bioinform.14:548.
Received: 09-Aug-2021 Accepted: 23-Aug-2021 Published: 30-Aug-2021
Copyright: © 2021 Niveditha D, et al. This is an open-access article distributed under the terms of the Creative Commons Attribution License, which permits unrestricted use, distribution, and reproduction in any medium, provided the original author and source are credited.