Biochemistry & Pharmacology: Open Access
Open Access
ISSN: 2167-0501
ISSN: 2167-0501
Research Article - (2012) Volume 1, Issue 7
Catalase is well known antioxidant enzyme which protects cells from the toxic effects of hydrogen peroxide. Unlike peroxidase, it catalyses the dissociation of hydrogen peroxide directly into H2O and O2. Our results show that apart from the known catalytic action, mammalian catalase can generate Hydroxyl Radicals (HRs) in experimental conditions. At low concentrations of H2O2 (<20 μM), the presence of bovine liver catalase (BLC) increased the generation of HRs in the reaction mixture. Differential productions of HRs due to either presence of azide or urea induced structural changes of BLC suggest that the enzyme participates in the production of HRs. The possible character is unusual in contrast to the well-established fact that catalase reduce the generation of reactive oxygen species in a biological system. The work is being presented with a discussion on experimental limitations we faced throughout the study.
<Keywords: Mammalian catalase; Free radical; Hydroxyl radical generation
3AT: 3-amino-1,2,4-triazole; BLC: Bovine Liver Catalase; Bpy: 2,2'-Bipyridyl; EDTA: Ethylene Diamine Tetra Acetic Acid; Flu: Fluorescence; HRs: Hydroxyl Radicals; NADP(+): Nicotinamide Adenine Dinucleotide Phosphate; NADPH: reduced form of NADP(+); ROS: Reactive Oxygen Species; TA: Terepthalic Acid
Catalases are generally characterized by breaking down hydrogen peroxide into H2O and O2 through the mechanism where hydrogen peroxide alternately oxidizes and reduces the haem iron at the active site (Rean 1,2) [1,2]. Although the structure, mechanism of action and functions of catalases have been studied for many years, research continues to reveal differences in the role of mammalian catalase compared to those of prokaryotes. For example, mammalian catalase use unbound NAD(P)H to prevent substrate inactivation without displacing catalase-bound NADP(+) [3]. Studies on catalase have gained momentum recently owing to their postulated impact in extending lifespan [4-6]. Recent reviews emphasize on the need of further research to answer the unexplained findings related to mammalian catalase [3,7].
Mammalian catalase is a homotetramer with a subunit molecular mass of ~60 kDa and belongs to a group of monofunctional catalases with small subunit size. Each subunit contains a haem group at the active site, which is internally located and approachable by a passageway that becomes narrow, thereby accessible for only substrates of small size. During catalytic reaction, intermediate compound-I at low concentrations of H2O2 and in the presence of one-electron donors may give rise to the compound-II; that is an inactive form of the enzyme (Rean 3) [3]. Reaction 1, 2 and 3 shows the alterations occurs at the active site during the catalytic reaction. ‘Por’ denotes porphyrin ring which with iron ion forms the haem group.
Resting state (Por•• - FeIII) + H2O2 ----> Compound-I (Por+• - FeIV =O) + H2O (1)
Compound-I (Por+• - FeIV =O) + H2O2 ----> Resting state (Por•• - FeIII) + H2O + O2 (2)
Compound-I (Por+• - FeIV =O) + e¯ ----> Compound-II (Por•• - FeIV =O) (3)
In the present work, we have shown that mammalian catalase (bovine liver catalase) is involved in the generation of Hydroxyl Radicals (OH•). The possible character is unusual in contrast to the well-known fact that catalase reduces the generation of reactive oxygen species (ROS) in biological system.
All chemicals used for the present experiments were of analytical grade. Bovine liver catalase (BLC) and 3-amino-1,2,4-triazole (3AT) was obtained from Sigma, USA. Terepthalic acid (TA) and other chemicals were obtained from HiMedia, India.
Preparation of the reagents
5 mM stock solution of TA was prepared in 50 mM sodium phosphate buffer (Na2HPO4/ NaH2PO4) at pH 7.4. As per requirement it was diluted in the same buffer to prepare 0.5 mM TA working solution. 100 μM FeSO4.7H2O, 100 mM 2,2'-bipyridyl (Bpy), 10 mM 3AT and 10 mM sodium azide (NaN3) solutions were prepared in distilled water. After measuring initial concentration spectrophotometrically with help of molar extinction coefficient (43.6 M-1cm-1 at λ240), H2O2 was diluted to get 10,100 and 1000 μM concentrations. 40 mg BLC (2,950 units/mg of protein) was dissolved in 10 ml of 50 mM sodium phosphate buffer (pH 7.4). After that it was centrifuged at 3500 g for 10 minutes to get clear solution.
Detection of hydroxyl radical generation
TA was used as a specific fluorescent probe for the detection of HRs. Nonfluorescent compound TA reacts with hydroxyl radical to form a stable and highly fluorometric product 2-OH-TA (λex 315 nm, λem 426 nm) [8,9]. In reaction mixture, HRs were generated by the well known Fenton’s reaction (Fe2+ + H2O2 → Fe3+ + OH• + OH¯). Both substrates of the Fenton’s reaction (H2O2 and FeSO4.7H2O; 100 μM each) were added consecutively in 2.5 ml of 0.5 mM TA working solution. To check the linearity of the curve 50,100 and 200 μl quantity of the substrates were used. The reaction mixture was incubated at 37°C for 15 min. At the end of reaction, fluorescence intensity was measured with a Jasco FP-6300 spectrofluorometer in a 4 cm3 quartz cuvette. Readings were taken at λex 315 nm, λem 426 nm, band width 5 nm both for excitation and emission; and with high sensitivity. The fluorescence intensity was the measure of hydroxyl radicals (HRs) generated by the Fenton’s reaction.
Effect of chelator on generation of HRs by free iron
Bipyridyl, citric acid, fructose, EDTA-Na2, glycine, L-arginine and L-lysine were used to analyse the relative strength of iron chelation. Free amino acids have been found effective for chelating iron in various studies [10,11]. 2 ml of 0.5 mM TA and 50 μl of 100 μM FeSO4.7H2O were added in seven test-tubes. 50 μl of each chelator (10 mM) was added in separate test tube followed by addition of 250 μl of 0.6% H2O2. It was incubated for 15 minutes and HR generation was measured as described in previous subheading.
HR generation by catalase
To detect the HR generation by catalase following experiment was designed. As shown in the Table 1, 100 mM Bpy, BLC, 10 mM 3AT, 10 mM NaN3 and 1000 μM H2O2 were added in 0.5 mM TA solution to prepare series of reaction mixtures (Rm). Final volumes were made equal by water and incubated for 10 minutes at 37°C before adding up 1000 μM H2O2. In addition, the Rm-4, 5 and 6 were prepared simultaneously with 10 and 100 μM H2O2. The three different concentrations (10,100 and 1000 μM) provided 0.2, 2.0 and 20 μM H2O2 in final volume of Rm. After all additions reaction mixtures were incubated overnight at 37°C. Fluorescence was measured at λex 315 nm, λem 426 nm, band width 5 nm both for excitation and emission; and with high sensitivity.
| No. | Reaction mixtures (Rm) | |
|---|---|---|
| 1. | 2.0 ml TA + 200 µl Bpy | + 50µl H2O2 |
| 2. | 2.0 ml TA + 200 µl Bpy + 10µl 3AT | + 50µl H2O2 |
| 3. | 2.0 ml TA + 200 µl Bpy + 10µl NaN3 | + 50µl H2O2 |
| 4. | 2.0 ml TA + 200 µl Bpy + 250µl BLC | + 50µl H2O2 |
| 5. | 2.0 ml TA + 200 µl Bpy + 250µl BLC + 10µl 3AT | + 50µl H2O2 |
| 6. | 2.0 ml TA + 200 µl Bpy + 250µl BLC + 10µl NaN3 | + 50µl H2O2 |
Table 1: Fluorescence probe-TA, iron chelating agent-Bpy, enzyme-BLC and enzyme inhibitor-NaN3/3AT were added in six different test tubes according to above table. Reaction mixtures were incubated for 15 minutes at 37°C and afterwards H2O2 was added in each test tube.
Effects of various concentrations of urea on generation of HRs by catalase
To confirm the generation of HRs by catalase it (HR) was measured in presence of different concentrations of urea. 0,1,2,3 and 4 M urea solutions were prepared in 50 mM phosphate buffer at pH 7.4. 1.8 ml of each urea solution was taken in separate test-tube with 50 μl BLC. In the same way another set of test-tubes was prepared by adding 50 μl phosphate buffer instead of BLC. Thus at each given concentration of urea two test-tubes were prepared with and without BLC. After 10 minutes incubation at room temperature, 200 μl TA (5 mM), 200 μl Bpy, 50 μl H2O2 (100 μM) were added in each test-tube. Fluorescence was measured at room temperature with λex 326 nm, λem 426 nm, band width 5 nm both for excitation and emission, at medium sensitivity. Δ Fluorescence (Flu. of one urea solution with BLC – Flu. of same urea solution without BLC) at each urea concentration was calculated.
Determining the fluorescence spectrum of catalase in presence of urea
The fluorescence of a protein is due to mainly tryptophan and tyrosine. Fluorescence spectra (λmax of emission) provide both a characteristic parameter for a particular protein and structural information concerning the average degree of burial of both amino acids present in the protein [12]. The precise wavelength of emission, in the case of tryptophan, maximum values have been observed over a broad range between 308 nm (highly nonpolar) and 352 nm (fully exposed to solvent). If λmax is located at lower wavelengths, the tryptophan must be buried in a nonpolar environment. Shift of λmax towards 350 nm indicate the solvent induced conformational change that causes it to be exposed to the solvent.
To confirm the structural changes of BLC fluorescent spectra were recorded in each set of reaction mixtures prepared to see the effect of various concentrations of urea on HR generation by catalase. At λex 280 nm fluorescence emission spectra was recorded (λex 270-400 nm) at medium sensitivity.
The detection of Hydroxyl Radicals (HRs) by TA is a highly sensitive and specific method and it has been used to detect HR generation in nonenzymatic systems [8,9]. In the present study we have used it for the first time for detection of HRs generated by catalase. TA is a perfect qualitative reagent and can also quantify HRs however in present study it was used to detect relative HR generation in different reaction mixtures.
Figure 1 shows the units of fluorescence in the reaction mixture which was directly proportional to the amount of HRs produced by the Fenton’s reaction. At a given concentration of Fe2+/H2O2 system, iron chelating agents like glycine, fructose, L-arginine and L-lysine did not change HR generation significantly whereas presence of EDTA and citric acid increased the production of HRs at least by two folds (data not shown). Presence of Bpy reduced HR generation maximum when compared with other chelating agents. The concentration of Bpy was 100 times more compared to Fe2+ in the reaction mixture (Figure 1) where it reduced the HR generation up to 55-60%.
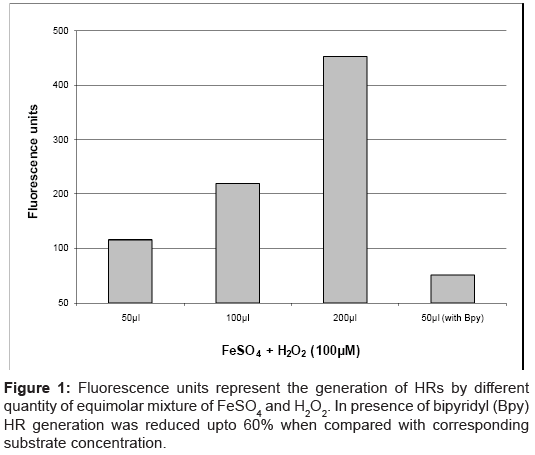
Figure 1: Fluorescence units represent the generation of HRs by different quantity of equimolar mixture of FeSO4 and H2O2. In presence of bipyridyl (Bpy) HR generation was reduced upto 60% when compared with corresponding substrate concentration.
Experimental findings presented in Figure 2 indicate that catalase generates Hydroxyl Radicals (HRs) when react with low concentrations (<20 μM) of H2O2. The initial fluorescence of the reagent blank may be due to contamination of iron in the reaction mixture participating through Fenton’s reaction (Rm -1). Enzyme inhibitors did not show any change in fluorescence activity of reagent (Rm -2 and 3). Presence of BLC (Rm -4) increased the HRs generation; thus the fluorescence was enhanced by ~90 units. In Rm -6, NaN3 amplified the generation of HRs. 3AT did not alter the HR generation significantly (Rm-5).
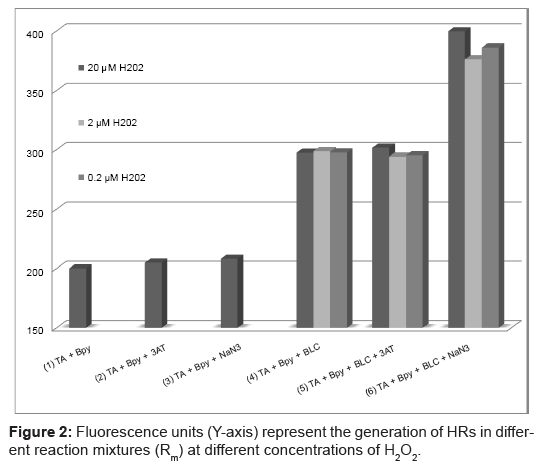
Figure 2: Fluorescence units (Y-axis) represent the generation of HRs in different reaction mixtures (Rm) at different concentrations of H2O2.
HR generation by catalase (Δfluorescence units) was measured at different concentrations of urea (Figure 3). The generation of fluorescence due to catalase was 22 units in absence of urea. It was increased upto 30.3 units at 2 M urea and afterwards decreased upto 15.1 units at 4 M urea. In the same solutions protein fluorescence spectra were recorded (Figure 4). A protein fluorescence spectrum is widely used as a tool to monitor changes in proteins and to make inferences regarding local structure and dynamics [12]. Peak of fluorescence spectra of BLC shifted towards 350nm with increasing concentration of urea. It confirms the structural changes of BLC occurred in the presence of urea.
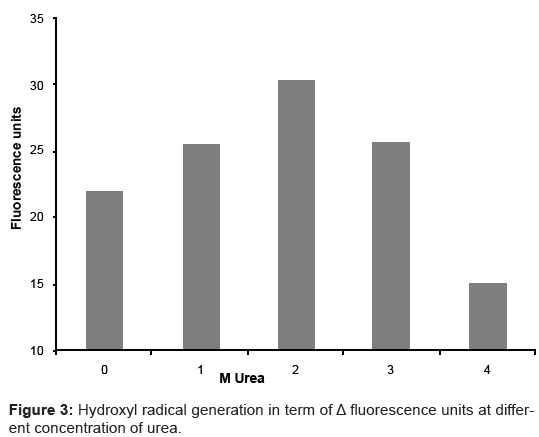
Figure 3: Hydroxyl radical generation in term of Δ fluorescence units at different concentration of urea.
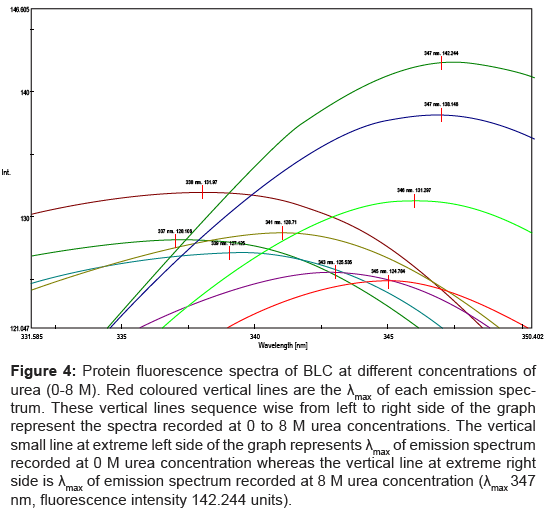
Figure 4: Protein fluorescence spectra of BLC at different concentrations of urea (0-8 M). Red coloured vertical lines are the λmax of each emission spectrum. These vertical lines sequence wise from left to right side of the graph represent the spectra recorded at 0 to 8 M urea concentrations. The vertical small line at extreme left side of the graph represents λmax of emission spectrum recorded at 0 M urea concentration whereas the vertical line at extreme right side is λmax of emission spectrum recorded at 8 M urea concentration (λmax 347 nm, fluorescence intensity 142.244 units).
During catalytic reaction, Hydroxyl radicals (HRs) are always thought to be generated due to impurities (mainly free iron ions) in reaction mixture [13]. As such, catalases are so well known for their antioxidant nature that perhaps no one looked for their oxidant role. Catalase activity is always measured in term of rate of either H2O2 degradation or O2 formation. The half life of HR is also very less (10-9 sec) [9]. Perhaps these are the reasons that the oxidant character of mammalian catalase was missed.
The linear increase in fluorescence with increasing amount of HRs generated by Fenton’s reaction confirmed the validity of the TA method (Figure 1). Both substrates of Fenton’s reaction (FeSO4 and H2O2) when added in equimolar concentrations produced HRs. Increase in concentration of these substrates in reaction mixture proportionally generates more HRs and accordingly they (HRs) produced more fluorescence by reacting with TA.
In our experiments, generation of HRs in the reaction mixture can occur by two possible sources; one is the free iron ion (Fe2+) and the other is by catalase. The bidentate chelator Bpy predominantly binds Fe2+ and avoids its participation in Fenton’s reaction. In reaction mixture, the HR generation by free iron was reduced by addition of Bpy so that small variations in fluorescence due to possible HR generation by the enzyme can be detected efficiently. The presence of Bpy will not affect generation of HR by catalase as the haem iron is present in deep buried active site which is not accessible to Bpy. Other well established chelators like desferrioxamine preferentially binds Fe3+ (product of Fenton’s reaction) hence they were purposefully avoided [14].
The presence of BLC increased the HRs generation in reaction mixture (Rm -4). It was required to confirm that HRs is being generated at the active site of the enzyme. Therefore further experiments were performed. Inhibitors were used to block the active site and structural changes were induced to modify near vicinity of active site.
His75 is present near the active site and it is involved in the mechanism of catalytic reaction. 3AT (3-amino-1,2,4-triazole) reacts with His75 and compound-I (intermediate of catalytic reaction) to inhibit catalytic reaction [2]. Sodium azide (NaN3) also acts as an inhibitor by converting compound-I into inactive compound-II [15]. The active site of catalase is accessible to both, 3AT and NaN3 so the production of HRs should be altered by the presence of these inhibitors of catalytic reaction.
Mechanism of azide inhibition (Rean 4 and 5) showed that NaN3 promote the formation of inactive compound-II [15].
Compound I + N3¯ + H+ -------> Compound II + N3• (4)
Compound II + N3¯ + H+ ------> Catalase Fe3+ + N3• + H2O (5)
The formation of azidyl radical was found to be carbon monoxide-insensitive, indicated that resting state enzyme was not involved in the reaction. Detection of free radical formation provided evidence for one-electron oxidation/reduction mechanisms (Rean 3). It has therefore been proposed that the oxidation of azide by catalase proceeds by a cycle similar to peroxidases, involving Compound-I and Compound-II [15,16]. Most peroxidaes, including lactoperoxidase, contain ferriprotoporphyrin IX as a prosthetic group. The formation of hydroxyl radical has been detected during the irreversible inactivation of lactoperoxidase in the presence of excess H2O2 [17,18].
As shown in Figure 3, increase in fluorescence in the presence of azide (Rm-6) confirms that similar to lactoperoxidase, catalase was inhibited by azide and HRs was produced in the reaction mixture. If the HR generation was due to impurities in reaction mixture the same effect would be generated in Rm-3. 3AT require H2O2 generation in reaction mixture at constant rate for augmentation of its inhibitory effects [2] thus it did not alter the generation of HRs significantly (Rm-5).
The close vicinity of active site plays very important role in enzyme activity. If HRs in reaction mixture were generated by catalase, it should be affected by structural changes of the enzyme. Different concentrations of urea were used to induce structural changes in the enzyme. At each concentration of urea, reaction mixture was prepared with and without addition of BLC. It was followed by the measurement of fluorescence intensity and calculation of ΔFluorescence (ΔFlu) as described in materials and methods. If the HR generation was only due to impurities, there should be equal production of HRs (ΔFlu) in each reaction mixture (Figure 3). At λex 315 nm urea also produce some fluorescence. These minute fluctuation were diminished by using λex 326 nm in the particular experiment.
Protein fluorescence spectra demonstrate that the presence of urea (0 to 4 M) brings about structural changes in BLC (Figure 4). Differential productions of HRs (ΔFlu) in presence of different urea concentrations with same amount of BLC (Figure 3) suggest that the enzyme is involved in the production of HRs and this production is affected by structural changes of the enzyme. If change in fluorescence was due to different concentrations of urea, there would be a continuous increase/decrease in fluorescence with increasing concentration of urea. As shown in Figure 4, the peak of fluorescent spectra does not raise at 1-5 M urea but shift towards 350 nm. It shows that native catalase tetramer acquire some structural modification. These structural rearrangements may alter the nearby environment of haem group in different way, and therefore, can generate opposite effects at different urea concentrations (Figure 3). The HR generation was monitored only upto 4 M urea concentration because, as shown in Figure 4, at 5 M and above urea concentration there was a sharp increase in protein fluorescence. It indicates the major changes in protein structure like complete unfolding.
Our preliminary data like a) in presence of BLC the generation of HRs in reaction mixture was increased and b) differential productions of HRs due to either presence of azide or urea induced structural changes of BLC; indicate that the BLC participate in the generation of HRs at low concentrations (<20 μM) of H2O2. However, the present study had certain limitations. It is required to have a system free from impurities to study the generation of HRs by catalase. The effect of free iron ion (participation in Fenton’s reaction) increased by many folds at high concentrations (mM) of H2O2. The measurement of catalase activity at low concentrations (μM) of H2O2 requires very sensitive instruments. Maintaining low concentrations of H2O2 in reaction mixture is another difficulty because it is unstable at 37°C, optimum temperature for enzyme activity. Due to these limitations we could measure neither catalase activity under the conditions used for HR formation nor the generation of HRs at high concentrations of H2O2. The fluorescence product 2-OH-TA is not available commercially therefore we measured relative HR generation in different reaction mixtures. We sincerely admit that we were unable to quantify the concentrations of HRs produced in different experiments and due to that, could not use statistical calculations. For each value, same experiment was repeated three times simultaneously and average of results was used for data interpretation. All experiments were repeated once again after a gap of one month and the pattern of findings were same. The quantification of HRs produced by catalase was also required for the study of reaction kinetics.
The mammalian catalase has been described “a venerable enzyme with new mysteries”. There are several findings related to mammalian catalase which are still unexplained [3,4,7]. For example, in specific conditions enzyme consume H2O2 as its only substrate without generating O2 [19]. Recent studies provide evidence of interlink between intracellular catalase, amyloid aggregation and increased ROS generation; and role of these interactions in Alzheimer disease [20]. HR generation can be a new feature of mammalian catalase which could provide explanation of unexplained findings. It requires further studies coupled with advanced techniques to establish our findings completely.
HR generation by BLC catalase is a new possible product. A system free from impurities, generation of low concentrations of H2O2 at constant rate and a sensitive as well as specific fluorescent probe for detection and quantification of HRs are prerequisites to confirm the findings. If characterized completely, the new character will provide the opportunity to explore the role of catalase again as an ‘HR producer’ in cell signaling, aging and apoptosis making it more relevant in human health and diseases.