Journal of Geology & Geophysics
Open Access
ISSN: 2381-8719
ISSN: 2381-8719
Research Article - (2014) Volume 3, Issue 1
Hydrochemical investigations, which are significant for the assessment of water quality, have been carried out to study the sources of dissolved ions in hot springs water of some part of Jebel Mara mountain, Darfur region, Sudan. The temperature of hot springs water was varies from 50°C to 60°C. Samples collected from hot springs near Koronga village at Jebel Mara, were analyzed for major solutes and trace elements as part of larger study to characterize the geochemical signature of these ground waters. In these study, four major cations (Ca++, Mg++, Na+ and K+), three major anions (Cl-, SO42- and HCO3) and some trace elements (Mn, Zn, Pb, Fe and P) were analyzed in these ground water samples. This study reveals that most waters taken from hot springs has high values of Hydrogen ion concentration (pH) , high values of electrical conductivity (E.C), and high concentrations of total hardness (T.H), total dissolved solids (T.D.S) , bicarbonates (HCO3), sodium (Na+) and Magnesium (Mg++). All these high values of pH, T.D.S, T.H, Na and HCO3 are mainly due to dissolution of these ions from rock bearing minerals of the study area. Normal values of trace elements like Iron (Fe), Copper (Cu), Lead (Pb), Iodine (I) and Zinc (Zn) whereas, high concentrations of Manganese (Mn). The study classified hot springs waters as Calcium-Magnesium-Sodium Bicarbonate type. Using USDA classification, water has been classified as C2 S1 (medium conductivity-salinity and low sodium content). The discharge values of hot springs measured to be between 1-2 L/S for all hot springs near Koronga village. The thermal waters are associated with Tertiary basalt and heat for these thermal waters is obtained during deep circulation in fracture basalt and is related to volcanic or tectonic activity. This study suggested that the geothermal waters of Jebel Mara area are of meteoric origin. Hot springs waters (thermal water) have also been used for medical therapy.
Keywords: Darfur region; Jebel Mara Mountain; Hot springs; Geochemistry; Classification of water
Jebel Mara volcanic complex situated in the western and southern Darfur state, with highest part situated some 80 miles from El Fashir town. The complex appears to have been formed during Tertiary but explosive and intrusive activity probably extended into Pleistocene and seen into recent. The predominant rocks are basalt, but trachyte and phonolite are said to be common locally. Pyroclastic rocks occur near the crater, and the Jebel Mara itself is describe as massive crater 5 Km. in diameter with two crater lakes, one saline (natron), the other fairly fresh, surrounded by walls of ash and tuff, pumice occurs locally. A number of hot springs were observed throughout the area especially near the crater.
In apparent contrast to the arid climate, there are many discharge springs in the western part of Dariba crater, in Jebel Mara Mountains. These springs contains an unusually high concentration of Sulphur vapor, high discharge and high dissolved material which lead to high content of anions and cations, the ongoing research shows that in the ten springs watershed, the springs also contribute significantly to the hydrologic budget of the system. Ground water issuing from hot springs in ash basalt, are believe to consist of local recharge from Dariba Crater (Cater lake), more than 2 Km. to the south east. Water from Dariba Crater believes to come in inter basin flow to reach the hot springs through fissures and cracks connected to each other. Bathing in natural thermal waters is very popular in Jebel Mara area. Thermal waters have also been used for medical therapy.
Thermal waters in Jebel Mara region are characterized by an average temperature of at least 15°C above the mean annual air temperature of its locality. They range in temperature from31°C to 55°C.
The Basalt aquifer extends from the Jebel Mara in south Darfur state to Kutum region in the north Darfur. This aquifer is recharged from the precipitation in Jebel Mara where the ground water moves radially to all directions. Thermal waters are found on several sides along the Jebel Mara Dom in the greater Darfur. The behavior of the groundwater systems in the study area of the uplift of Tertiary intrusion, due to the separation caused by a juxtaposition of aquifer on the flank with aquitards across the fault or low land area.
This study focuses on the thermal waters in Jebel Mara region. In the study area there are about10 thermal springs. The elevated temperature of many spring water s is the result of deep circulation under normal geothermal gradients.
This paper may help to determine the geo-hydrological and geohydrochemical history, determine the geochemical signature in the thermal waters in J. Mara and to give an idea about the development of water chemistry within the Jebel Mara Doming.
Study area
The Marra Mountains (Jebel Marra) stands with majesty and are a range of volcanic peaks created by a massif that rises up to 3,000 m. It is located in the center of the Darfur region of Sudan (Figure 1). It stretches from several hundred miles from the small town of Kas in the south to the out skirts of El Fashir in the north covering an area of almost 12800Km2 .The highest point is Dariba Crater (two lakes are there the largest and the smallest) (Figures 2 and 3). The upper reaches of the massif is a small area of temperate climate with high rainfall and permanent springs of water. The last eruption occurred around 2000 BC. The area under investigation located in arid to a semi-arid climate between 24°25’ -24°35’ E and latitude 13° 10’ -13° 20’ N (Figure 1).
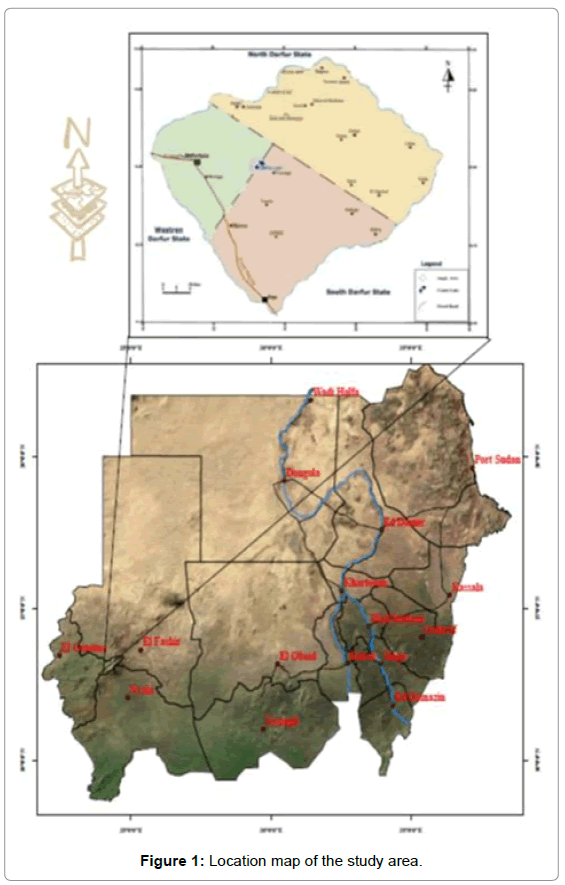
Figure 1: Location map of the study area.
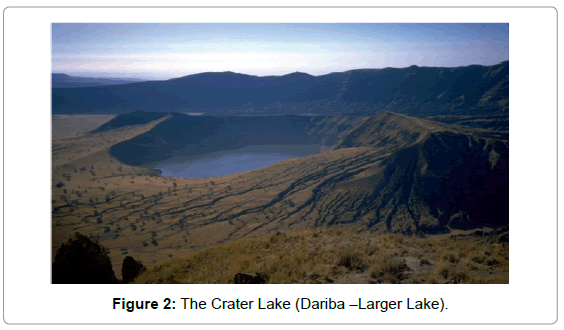
Figure 2: The Crater Lake (Dariba –Larger Lake).
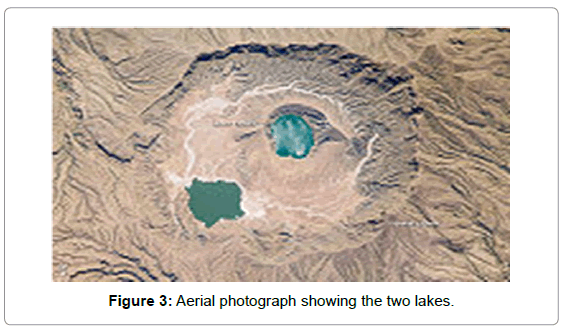
Figure 3: Aerial photograph showing the two lakes.
The area is characterized by two main seasons;
a. Dry season started approximately from Nov. to May, and
b. Rainy season from June to Oct.
The climate in semi-arid condition varies from region to region and from season to season. During the rainy season, the average rainfall varies from about 900 mm. in the western districts to more than 1100 mm. at the upper zone (hilly area). The average temperature varies from 15°C (during January) to 40°C (during May). The natural lake (Dariba Crater) located just 2 Km. southwest of the hot springs (Figure 1). About ten warm springs were recorded on Jebel Idwa, a subsidiary cone about 2 Km far from Dariba Crater Lake. Some hot springs and fumaroles along the northwest margin of the inner Dariba Crater Lake were recorded; the other hot springs (Figures 4-7) were situated near Koronga village. The temperature of springs waters ranging from 55° to more than 60°C.
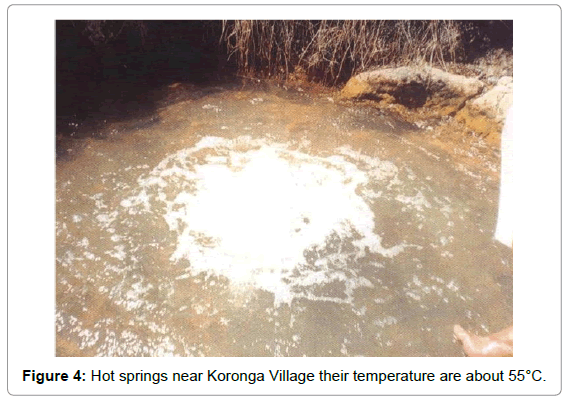
Figure 4: Hot springs near Koronga Village their temperature are about 55°C.
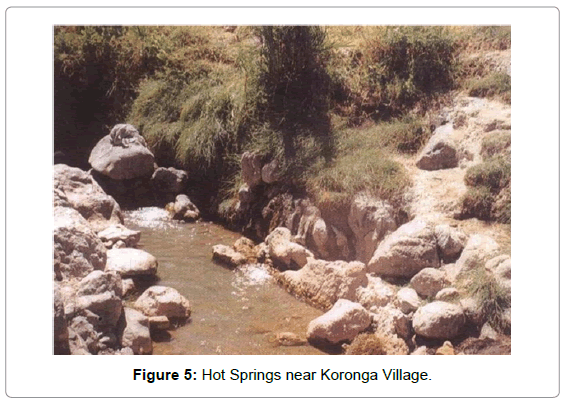
Figure 5: Hot Springs near Koronga Village.
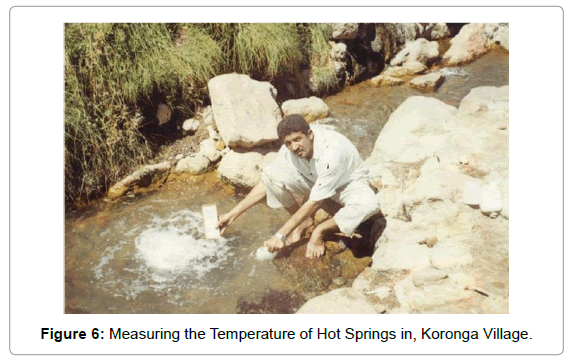
Figure 6: Measuring the Temperature of Hot Springs in, Koronga Village.
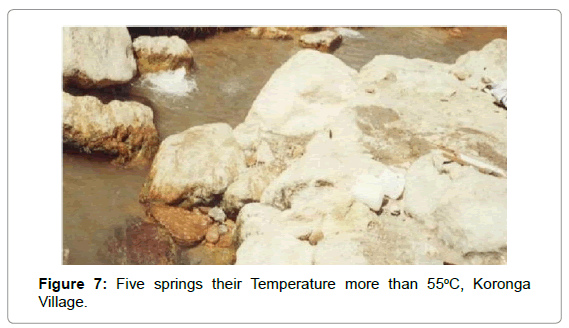
Figure 7: Five springs their Temperature more than 55°C, Koronga Village.
Methods
Chemical analysis:
Inorganic constituents: Water samples were collected from ten hot springs near Koronga village, about 2km away from Dariba Crater during May 2002 (Figure 8). According to the standards of the W.H.O. and American Public Health Association [1,2] the major ions (Ca2+, Mg2+, Na+, K+, HCO3 -, Cl-, SO4 2-, NO3 -, PO4 3-) were determined in at Alneelain University laboratories and Veterinary Research Laboratory, Figure 1: Location map of the study area. Soba, Khartoum State for major and trace elements Temperature, conductivity (EC), and pH were measured in the field by using Field Multi Electrode Meter. Alkalinity (CO3 2-and HCO3 -) was determined by titration with HCl using Phenolphthalein and Bromocresol-green indicators. Sulfate (SO42-) was determined by precipitation of BaSO4 and then measuring the absorbency with a spectrophotometer at λ=420 nm. Chloride (Cl-) was determined by titration with AgNO3 using Potassium chromate indicator. Sodium (Na+) and Potassium (K+) were determined by flame photometer. The total hardness (Ca2++ Mg2+) was determined by titration with Na2-EDTA using Erichrome black-T indicator while the Calcium (Ca2+) was determined by using Murexide indicator. Nitrate (NO3 -) was determined by using UVspectrophotometer at λ= 220 nm. Routine analyses have been analyzed to understand the suitability of water for domestic uses (Table 1).
| Sample ID | pH | TDS [mg/l] | Na [mg/l] | K [mg/l] | Mg [mg/l] | Ca [mg/l] | Mn [mg/l] | Fe [mg/l] | Zn [mg/l] | Cu [mg/l] | Cl [mg/l] | SO4 [mg/l] | HCO3 [mg/l] | WATERTYPE |
|---|---|---|---|---|---|---|---|---|---|---|---|---|---|---|
| JM-1 | 9.7 | 1150 | 75 | 35 | 80 | 95 | 1.62 | 0.45 | 0.61 | 0.15 | 35 | 25 | 800 | MgCaHCO3 |
| JM-2 | 9.59 | 445 | 30 | 10 | 35 | 25 | 1.65 | 0.51 | 0.19 | 0.09 | 30 | 10 | 300 | Mg HCO3 |
| JM-3 | 9.27 | 365 | 10 | 5 | 15 | 50 | 1.66 | 0.5 | 0.19 | 0.04 | 35 | 30 | 215 | CaMgHCO3 |
| JM-4 | 9.49 | 930 | 70 | 25 | 45 | 85 | 1.68 | 0.49 | 0.21 | 0.83 | 46 | 25 | 630 | CaMgHCO3 |
| JM-5 | 9.65 | 750 | 45 | 20 | 65 | 35 | 1.68 | 0.47 | 0.21 | 0.06 | 35 | 40 | 500 | Mg HCO3 |
| JM-6 | 9.66 | 700 | 60 | 15 | 45 | 70 | 1.99 | 0.51 | 0.22 | 0.09 | 45 | 25 | 420 | MgCaHCO3 |
| JM-7 | 9.5 | 440 | 32 | 11 | 33 | 24 | 1.62 | 0.64 | 0.21 | 0.04 | 32 | 12 | 295 | Mg HCO3 |
| JM-8 | 9 | 730 | 44 | 19 | 62 | 33 | 1.7 | 0.54 | 0.32 | 0.63 | 36 | 39 | 490 | Mg HCO3 |
| JM-9 | 9.5 | 668 | 58 | 16 | 42 | 68 | 1.8 | 0.42 | 0.31 | 0.082 | 43 | 23 | 410 | MgCaHCO3 |
| JM-10 | 9.2 | 494 | 12 | 8 | 18 | 68 | 1.65 | 0.51 | 0.61 | 0.09 | 38 | 33 | 225 | CaMgHCO3 |
Table 1: Physico- chemical analysis of thermal water in J. Mara.
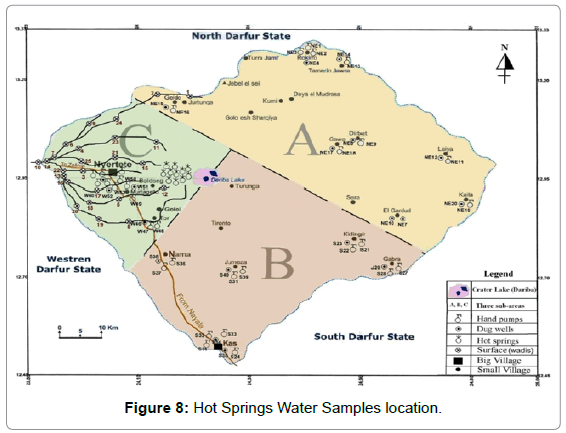
Figure 8: Hot Springs Water Samples location.
Accuracy of analysis: Reliability of water analysis can be detected by electrical balance. Normally the major cations: Ca, Mg, Na and K and the major anions: HCO3, SO4, Cl, and NO3 are taken as m eq/l. two equations are common:
Error % =100* (ΣCat-ΣAn)/ (ΣCat+ΣAn) (1)
Error % =100* (ΣCat-ΣAn)/0.5 (ΣCat+ΣAn) (2)
Equation 2 is common in Germany, while equation 1 is common by many other countries. PhreeqC offers a more precise method by taking into account all positive and negative charged complexes. In this study the electrical balance error calculated by PhreeqC was used and evaluation of data was with respect to a 5% criteria.
Electrical conductivity: It measures the ability of water to conduct an electric current. It is directly related to the total dissolved salts (ions) in the water. It is abbreviated as EC and is reported in micro Siemens per centimeter (μS/cm). EC is not independent from temperature since EC increases if temperature increases. This can be expressed with a linear regression function: an increase or decrease by 1oC will cause an increase or decrease of about 2% in EC.
Total dissolved solids: Total dissolved solids (TDS) comprise inorganic salts (principally calcium, magnesium, potassium, sodium, bicarbonates, chlorides and sulfates) and some small amounts of organic matter that are dissolved in water. The water could be classified according to its TDS value into four types: fresh, brackish, saline, and brine [3] (Table 2).
| Water Category | TDS (mg/L) |
|---|---|
| Fresh | 0-1000 |
| Brackish | 1000-10000 |
| Saline | 10000-100000 |
| Brine | >100000 |
Table 2: Hot Springs water classification according to Caroll [3].
Classification of the hydrochemical data
In order to classify water samples into group’s graphical and statistical methods were used. Piper, Durov, Schoeller, Langlier-Ludwig comes with Aquachem version 3.7.42, Dendrogram cluster analysis was performed SPSS 11, while bar chart were drawn with Plotchem version 7.7.
The main purpose of the Piper diagram is to cluster the samples that have similar chemical composition. Piper [4] proposed this diagram where it plots the major ions (as percentage of milli-equivalents) within two triangles at the base. The total cations and anions are set equal to 100%. The data points in the two base triangles are projected onto an adjacent diamond grid (Figure 9 and Table 3) show the water classifications according to Furtak and Langguth [5].
| Water Types | Field (See Figure 2) |
|---|---|
| Normal earth alkaline water | |
| With prevailing bicarbonate With prevailing bicarbonate and sulfate or chloride With prevailing sulfate or chloride | A |
| B | |
| C | |
| Earth alkaline water with increased portions of alkalis | |
| With prevailing bicarbonate With sulfate and chloride | D |
| E | |
| Alkaline water | |
| With prevailing bicarbonate With prevailing sulfate-chloride | F |
| G |
Table 3: Classification of Hot Springs waters after Furtak and Langguth [5].
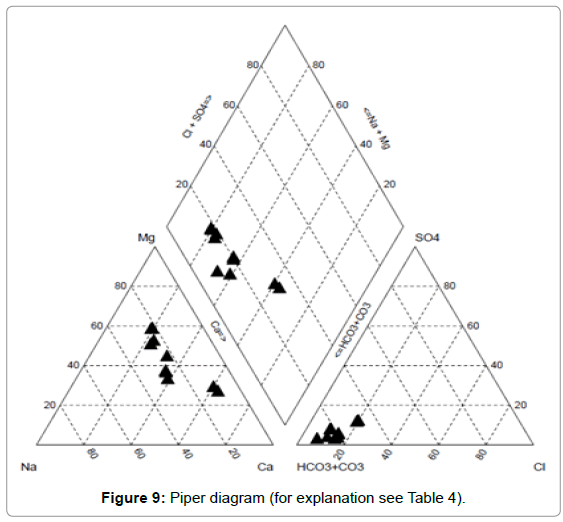
Figure 9: Piper diagram (for explanation see Table 4).
The main purpose of the Durov diagram is to cluster the data points indicating the samples with similar chemical composition as well as to reveal a useful relationships and properties for a large sample groups. It plots the major ions (as percentages within two triangles, where the total cations and anions are set equal to 100%. The points in the two triangles are then projected onto a square grid that is perpendicular to the third axis of each triangle (Figure 10 and Table 4) illustrate the classification of Lloyd and Heathcoat [6].
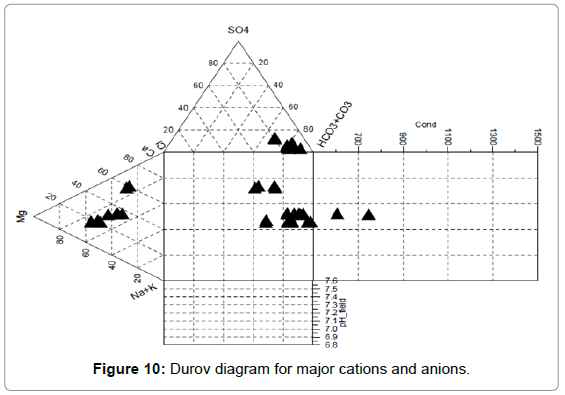
Figure 10: Durov diagram for major cations and anions.
| Water type | Field (seeFig.3) |
|---|---|
| HCO3 and Ca are dominant, frequently indicates recharging water in limestone, sandstone, and other aquifers. | 1 |
| Water dominated by Ca and HCO3 ions with presumed association with dolomite if Mg is significant. However, an important ion exchange is presumed if the Na is significant. | 2 |
| HCO3 and Na are dominant which indicates an ion exchanged water, although the generation of CO2 at depth can produce HCO3 where Na is dominant under certain circumstances. | 3 |
| SO4 dominates, or anion discriminant and Ca dominant, Ca and SO4 dominant, frequently indicates a recharge water in lava and gypsiferous deposits, otherwise a mixed water or water exhibiting simple dissolution might be indicated. | 4 |
| No dominate anion or cation, which indicates water exhibiting simple dissolution or mixing. | 5 |
| SO4 is dominant or anion discriminant and Na dominant; which is a water type that is not frequently encountered and indicates probable mixing influence. | 6 |
| Cl and Na are dominant, which is frequently encountered unless cement pollution is present otherwise the water may result from reverse ion exchange of Na-Cl waters. | 7 |
| Cl is a dominant anions and Na dominate the cations, which indicates that the ground waters can be related to reverse ion exchange of Na-Cl waters. | 8 |
| Cl and Na dominant frequently indicate end-point waters. | 9 |
Table 4: Water classification and geochemical processes that could affect the water genesis after Lloyd and Heathcoat [6].
Schoeller plots are semi logarithmic diagrams, which were developed by Schoeller [7] to represent the analysis of major ions in milli equivelant per liter (meq/l) and in order to demonstrate the different hydrochemical water types on the same diagram (Figure 11). It has the advantage that actual sample concentration are displayed and compared, but the number of analysis that can be illustrated at one time is limited.
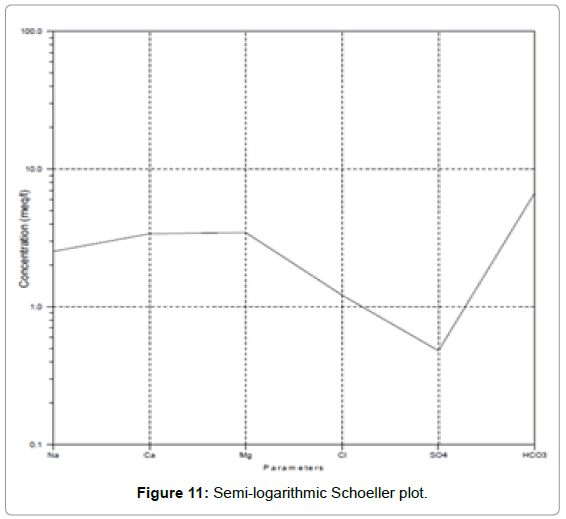
Figure 11: Semi-logarithmic Schoeller plot.
Statistical evaluation of the hydrochemical parameters
The statistical analysis was done using SPSS 11. The minimum, maximum, mean and standard deviations were calculated for each parameter. Frequency diagrams were drawn to detect if the distribution of the variables were normal or not, then this was tested with Kolomogorov-Smirnov test for the goodness of fit. If the calculated significance value (α) is higher than the proposed significant level (α=0.05) this indicates a normal distribution of the studied parameter. Since most of the variables are not normally distributed; the nonparametric Spearmans rank correlation analysis was adopted to calculate the correlation coefficient.
Mann-Whitney test was applied to determine if the average of the results of the two sampling campaigns could be used for further statistical analysis. To group the samples into clusters according to their major chemical constituents; a Dendrogram was drawn trying different clustering methods and measure intervals. The Ward’s method with the Euclidean distance was found to give the best Dendrogram that could be reasonably interpreted and represent the actual hydrochemical situation. Kruskal-Wallis and Mann- Whitney tests were applied to test the significance of the differences between the groups found by cluster analysis.
Geochemical Modeling
The hydrochemical parameters were modeled with PhreeqC version 2.10.03, Solomineq88 and Aquachem version 3.7.42 with its PhreeqC interface. The modeling included geochemical speciations, saturation indices calculations, mixing water samples, and reverse modeling.
The Aquachem software package deals with the graphical analysis as well as modeling of aqueous geochemical data. It covers a variety of functions and calculations for interpreting and comparing hydrochemical data. It features a built-in graphical interface to PhreeqC to perform some of PhreeqC’s simulation capabilities.
The PhreeqC is based on an ion dissociation aqueous model [8] and was used to calculate equilibrium concentrations (activities) of the chemical species in the solution and the saturation indices of solid phases in equilibrium with the solution as well as the reverse modeling
Saturation index
The saturation index (SI) is used to express whether a solution is in equilibrium with a solid phase or if it is under or over saturated in relation to a solid phase respectively. The degree of water saturation with respect to a mineral is expressed by:
SI=Log (IAP/Ksp)
Where IAP is the ion activity product and Ksp is the solubility product.
Practically, SI value ranging between -0.2 and 0.2 indicates equilibrium (Merkel and Planner-Friedrich 2005). SI value of more than 0.2 indicates water that is super saturated to the corresponding mineral. SI value less than -0.2 indicates water that is under saturated with respect to the corresponding mineral.
Inverse mass balance modeling
Garrels and Mackenzie [9] introduced the inverse mass balance modeling for the first time. Inverse mass balance modeling attempts to determine sets of mole transfers of phases that account for changes in water chemistry between one or a mixture of initial water compositions and a final water composition [8].
The major advantage of PhreeqC inverse modeling is its capability to include uncertainties in the analytical data that are in the inverse modeling calculation; this capability produces a robust modelcalculated mole transfers.
According to Zhu and Anderson [10] the applicability of the inverse mass balance modeling hinges on a number of assumptions and they are:
• The two water analysis of the initial and final wells or springs should represent volumes of water that flow along the same path;
• Dispersion and diffusion do not significantly affect solution chemistry;
• A chemical steady state prevailed during the time considered;
• The mineral phases, which are used in the calculation, are or were present in the aquifer.
Scale forming and corrosivity
The thermal waters have been tested to determine whether they are corrosive or scale forming. The Langlier saturation index (ΔpH) was calculated in order to determine whether the waters are corrosive or scale forming. The ΔpH can be calculated by:
ΔpH=pH-pHs
Where the pH is the measured pH value
The pHs was calculated using PhreeqC, where it is the pH value at equilibrium with calcite. According to German standards, the permissible limit is when ΔpH range between –0.2 and 0.2. When the ΔpH> 0.2; the water is considered to be scale forming, when the ΔpH< -0.2; the water is considered to be aggressive [11].
The results were obtained in the field, water chemistry labs (major elements). It includes also the results derived from statistics, geochemical modeling using PhreeqC (analysis error, species distribution, saturation indices, and calculated reaction inverse modeling paths) and SolminEQ88 (saturation index depend on pressure).
Field data and chemical analysis
10 samples were collected and analyzed twice from the thermal springs in the area of study. The physical and chemical parameters were applied for all of the 10 samples as mentioned (Methods). The result of the first sampling campaign, the second sampling campaign and the averaged chemical analysis are tabulated in Table 1.
Total dissolved solids and Electrical conductivity
Since there was no direct measurement for the total dissolved solids (TDS) in the field, the equation of Freeze and Cherry (1979) was used to estimate the TDS value where all the components of this formula are in mg/l as follows:
TDS (mg/l)=Ca2++Mg2++Na++K++SO4 2-+Cl-+NO3 -+0.5*HCO3 -
Table 1 presents the calculated TDS from the previous formula and the types of water according to Caroll classification (1962). It can be noticed that the type of water samples are almost fresh waters because even the waters which are classified as brackish waters are having values on the fresh-brackish water threshold.
The electrical conductivity (EC) measurements, which are conducted for the thermal waters showed that the EC values in the study area ranges between 240 μS/cm to 746 μS/cm where the lowest value is being recorded in JM-3 well and the highest is recorded in JM-1 well.
Since the EC and TDS are measurement of the total salt content, there must be a certain relation between them. The correlation between these two parameters for the samples was plotted in Figure 12 TDS in mg/l can be calculated from EC μS/cm according to the formula:
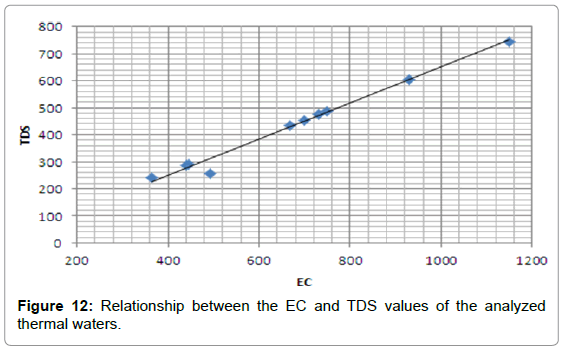
Figure 12: Relationship between the EC and TDS values of the analyzed thermal waters.
TDS mg/L= 0.581 EC μS/cm.
The relatively small residues between TDS and EC and vice versa are a proof that the chemical composition of all waters is considerably similar.
Statistical analysis
Tables 5 and 6 show the descriptive statistics (minimum, maximum, mean and standard deviation) for the study area. By drawing the frequency histograms and by applying the Kolomogorov-Smirnov test for all of the variables of the studied thermal waters. Table 6 shows the results of Kolmogorov-Smirnov test for normality where the fore, mentioned four variables were having a significant of more than 0.05 indicating a normal distribution.
| Parameter | Unit | Minimum | Maximum | Arithmetic Mean | Standard deviation |
|---|---|---|---|---|---|
| Cond | uS/cm | 240 | 746 | 428 | 164.3 |
| TDS | mg/l | 365 | 1150 | 667.2 | 244.1 |
| Ca | mg/l | 24 | 95 | 55.3 | 25.46 |
| Mg | mg/l | 15 | 80 | 44 | 20.5 |
| Na | mg/l | 10 | 75 | 43.6 | 22.63 |
| K | mg/l | 5 | 35 | 16.4 | 8.9 |
| Cl | mg/l | 30 | 46 | 37.5 | 5.44 |
| HCO3 | mg/l | 215 | 800 | 428.5 | 185.4 |
| SO4 | mg/l | 10 | 40 | 26.2 | 9.96 |
Table 5: Descriptive statistics of the study area.
The Pearson correlation requires a normal distribution and interval scaling. The bi-variate correlation procedure of SPSS computes the correlation coefficient (r), which requires also a normal distribution and since most of the variables are not normal distributed, the nonparametric Spearman’s rank correlation has been used. The correlation matrix between all of the variables is shown in Table 6. Also shows a summary of the positive (+ (0.01)) and negative (-(0.01)) significant correlation at α=0.01 and the positive (+ (0.05)) and negative (-(0.05)) significant correlation at α=0.05.
| pH | T | EC | TDS | Ca | Mg | Na | K | Cl | SO4 | HCO3 | |
|---|---|---|---|---|---|---|---|---|---|---|---|
| T | |||||||||||
| EC | |||||||||||
| TDS | +(0.01) | ||||||||||
| pH | +(0.01) | +(0.01) | |||||||||
| Ca | +(0.01) | +(0.01) | +(0.01) | ||||||||
| Mg | +(0.01) | +(0.01) | +(0.01) | +(0.01) | |||||||
| Na | +(0.01) | +(0.01) | +(0.01) | +(0.01) | +(0.01) | ||||||
| K | +(0.01) | +(0.01) | +(0.01) | +(0.01) | +(0.01) | +(0.01) | |||||
| Cl | +(0.01) | +(0.01) | +(0.01) | +(0.01) | +(0.01) | +(0.01) | +(0.01) | ||||
| SO4 | +(0.01) | +(0.01) | +(0.01) | +(0.01) | +(0.05) | +(0.01) | +(0.01) | +(0.05) | +(0.01) | ||
| HCO3 | +(0.01) | +(0.01) | +(0.01) | +(0.01) | +(0.01) | +(0.01) | +(0.01) | +(0.01) | +(0.05) | ||
| NO3 |
Table 6: Significant correlations at α = 0.01 and α = 0.05.
Geochemical modeling
Percent error, ionic strength and electrical balance: The percent error was calculated by PhreeqC according to the equation: Percent error =100*(Cat-|An|) / (Cat+|An|). Table 7 shows the percent error for the chemical analysis of the first sampling campaign, second sampling campaign and the averaged samples. The error was found to be less than 5% for all of those samples. The accuracy of the analysis is good and can be used for further modeling.
The lowest ionic strength in water samples was found in JM-7 well with a value of 1.49٠10-1mol/l while the highest value was found in JM-1 with 4.06٠10-1mol/l (Table 7).The electrical balance is ranging between 3.74٠10-1 and 4.88٠10-2 in the study area.
| Sample ID | Electrical balance | Ionic strength | % Error (1st) | % Error (2nd) |
|---|---|---|---|---|
| JM-1 | 3.74E-01 | 4.06E-01 | 0.29 | 0.5 |
| JM-2 | 1.10E-01 | 1.52E-01 | -0.4 | -0.15 |
| JM-3 | 4.99E-02 | 1.52E-01 | 0.19 | -0.44 |
| JM-4 | 2.59E-01 | 3.19E-01 | -0.22 | -0.09 |
| JM-5 | 1.50E-01 | 2.36E-01 | -0.14 | -0.62 |
| JM-6 | 2.10E-01 | 2.79E-01 | 0.18 | 0.12 |
| JM-7 | 1.01E-01 | 1.49E-01 | -0.21 | -0.06 |
| JM-8 | 1.39E-01 | 2.27E-01 | 0.09 | 0.12 |
| JM-9 | 2.05E-01 | 2.69E-01 | 0.79 | 1.56 |
| JM-10 | 8.79E-02 | 1.92E-01 | 0.12 | -0.06 |
Table 7: The ionic strength, electrical conductivity and percent error of the Jebel Mara.
Saturation indices: Table 8 shows the calculated saturation indices of relevant minerals for the collected samples (JM-1, JM-2, JM-3, JM-4, JM-5, JM-6, JM-7, JM-9, and JM-10). With increasing of salinity (going from 240 to group 746); the waters tend to become more saturated with respect to Anhydrite and Gypsum. The following phases were found to be under saturated: Anhydrite, and Gypsum.
| Saturation Index | ||||||||||
|---|---|---|---|---|---|---|---|---|---|---|
| Phase | JM-1 | JM-2 | JM-3 | JM-4 | JM-5 | JM-6 | JM-7 | JM-8 | JM-9 | JM-10 |
| Anhydrite | -0.01 | -0.61 | 0.14 | 0.04 | -0.07 | 0 | -0.54 | -0.09 | -0.03 | 0.23 |
| Gypsum | 0.2 | -0.39 | 0.36 | 0.26 | 0.15 | 0.22 | -0.32 | 0.13 | 0.19 | 0.44 |
| H2(g) | -27.4 | -27.18 | -26.54 | -26.98 | -27.3 | -27.32 | -27 | -26 | -27 | -26.4 |
| H2O(g) | -1.51 | -1.51 | -1.51 | -1.51 | -1.51 | -1.51 | -1.51 | -1.51 | -1.51 | -1.51 |
| Halite | -2.91 | -3.3 | -3.72 | -2.81 | -3.1 | -2.87 | -3.25 | -3.1 | -2.91 | -3.62 |
| O2(g) | -28.39 | -28.83 | -30.11 | -29.23 | -28.59 | -28.55 | -29.19 | -31.19 | -29.19 | -30.39 |
Table 8: The saturation indices for the relevant minerals of the water samples.
Inverse modeling: Only the pH and the major cations and anions (Na, K, Ca, Mg, SO4 and HCO3) were used in the modeling. The difference between the low mineralized precipitation in the recharge area and the higher mineralized thermal ground water analysis are supposed to be resulting from the reaction between the water and the minerals which have been selected in the inverse model according to the previous knowledge of the geology of the area and the aquifers. The object of this inverse modeling is to find a set of suitable minerals, which when react in a certain amount will account for the difference in composition between the starting solution (precipitation) and the final solution (thermal waters) (Table 8). In the inverse modeling the minor elements, trace elements, reaction kinetics, oxidation or concentration throughout evaporation were not taken into consideration. Significant amount of Gypsum has to dissolve in JM-2 and JM3 (-3.8٠10-1) compared to the 4.70٠10-1mol/l in JM-10. Also the Gypsum except JM-7 is having positive saturation indices.
• All Samples taken from hot springs has its temperature ranged between 55°-60° C, higher pH values which consider alkaline in range (9.00-9.66), high T.D.S. (365-1150 mg/l), rich in sodium (10-75 mg/l), rich in bicarbonate (215-800 mg/l) and higher total hardness. Springs No. 1, 4 and 8 can be classified as hard water. Chlorides concentrations in hot springs are restricted in range (less than 55 mg/l). Sulphate concentrations were less than 75 mg/l. All samples analyses for sulphate fall within the permissible limit.
• Alkalinities concentrations range from moderates to high values (from 215 to 800 mg/l. It appears that alkalinity decreases toward direction. Water taken from hot spring classified as Calcium -Sodium –Bicarbonate Chloride type. In the study area, thermal water associated with Tertiary rocks. Heat for thermal waters comes from volcanic, tectonic activity and deep water circulation in the fracture rocks. All Samples from hot springs classified as C1S1and C1S2. All geothermal waters in Jebel Mara Mountain are closely associated to joints and fractures of Tertiary basalt. All hot springs waters classified as medium hard water except spring No. JM-3.
• Most of the Jebel Mara thermal waters are fresh waters except JM-1spring which are brackish water.
• The formula [TDS mg/l=0.581 EC μS/cm] represents the relationship between the EC and the TDS for the thermal waters of the study springs.
• Hydrochemically, most analyzed thermal water samples can be classified as MgHCO3, MgCaHCO3 and CaMgHCO3-types as earth alkaline water with increased portions of alkalis, the low salinity waters are with prevailing bicarbonates.
• The thermal waters are mostly nitrate free and release H2 and O2 as a result of oxidation-reduction processes. The Na/Cl ratios (for most of the samples) were found to be around unity, which indicates the halite dissolution. The Ca/SO4 ratios were found to be higher than the unity. This indicates Gypsum. It indicates also deviation towards calcium enrichment. The Na/ Ca ratios were found to be increasing with the increasing of the salinity. This indicates a faster dissolution of halite than the Gypsum.