Biochemistry & Pharmacology: Open Access
Open Access
ISSN: 2167-0501
ISSN: 2167-0501
Research Article - (2015) Volume 4, Issue 3
Objective: The present study was designed to analyze the level of micronutrients among apparently normal and healthy children who were randomly selected from various parts of District Bannu, Khyber Pakhtunkhwa, Pakistan in order to evaluate any hidden deficiency of micronutrients malnutrition. Place and duration of the study: The study was designed & compiled in the Department of Biochemistry, Bannu Medical College, Bannu in 2012 while, analytical analysis of the study was carried out at High tech Laboratory, Agriculture university, Faisalabad. Materials and methods: In this cross-sectional descriptive analytical study, micronutrients in blood samples of pre-school children belonging to various areas of District Bannu, Khyber paktunkhwa, Pakistan were determined by Polarized Zeeman Atomic Absorption Spectrometer, Z-8200, Hitachi Japan. Results: Total number of studied population were 100 individuals, out of which 56 % were healthy children with mean age of 49.83 ± 1.78 months, while 7% were overweight with mean age of 57.29 ± 1.55 months, whereas, 7% were obese with mean age of 59 ± 00 months and 30% were underweight with mean age of 36.07 ± 2.94 months respectively. The mean BMI was 15.45 ± 0.16 kg/m2 in the healthy children, 18.32 ± 0.58 kg/m2 in overweight children, 19.69 ± 0.18 kg/m2 in obese children and 11.28 ± 0.32 kg/m2 in underweight children. Mean iron (Fe) levels and the mean Zinc (Zn) levels of overweight and underweight were slightly lower than healthy and obese (P ≥ 0.05) but not statistically significant. Serum Copper (Cu) levels were significantly increased (P<0.05) in under weight and obese individuals. In the age group of <1 year, the overall mean serum Zinc (Zn) contents were 64.30 ± 5.6 μg/dl, serum Iron (Fe) contents were 59.37 ± 5.1 μg/dl, while serum Copper (Cu) contents were 129.09 ± 10.9 μg/dl respectively. In the age group 1-2 years the mean serum Zinc (Zn) contents were 59.10 ± 3.2 μg/dl, the mean serum Iron (Fe) contents were 55.41 ± 3.2 μg/dl and the mean copper contents were 130.68 ± 13.5 μg/dl respectively. In the age group 2-3 years the mean serum zinc contents were 70.24 ± 4.7 μg/dl, The mean serum iron contents were 64.93 ± 4.6 μg/dl and the mean copper contents were 126.70 ± 7.9 μg/dl respectively. Similarly, in the age group 3-4 years the mean serum Zinc (Zn) contents were 46.78 ± 0.7 μg/dl, the mean serum Iron (Fe) contents were 57.94 ± 4.7 μg/dl and the mean Copper (Cu) contents were 109.09 ± 7.9 μg/dl respectively. Result shows that Zinc (Zn) level is high in age group of 2-3yrs and low in the rest of age groups. Similarly, Iron level is found high in 2-3yrs age group and 4-5 yrs age group. The overall mean serum zinc, iron and copper contents among male children were 65.38 ± 1.7 μg/dl, 64.69 ± 2.2 μg/ dl and 113.35 ± 3.2 μg/dl and among female children were 59.09 ± 2.4 μg/dl, 54.23 ± 2.4 μg/dl and 123.23 ± 5.2 μg/dl respectively. The serum Zinc, Iron and Copper levels in children dependent on mixed food were 56.33 ± 3.8 μg/dl, 55.60 ± 5.0 μg/dl and 81.61 ± 8.04 μg/dl, while on bottle feeding it were 60.57 ± 2.03 μg/dl, 58.86 ± 3.3 μg/dl, 112.99 ± 4.6 μg/ dl and on mother milk it were 64.94 ± 3.8 μg/dl, 62.39 ± 2.2 μg/dl and 121.54 ± 3.8 μg/dl respectively. Conclusion: We found low serum iron level in 25% of children, high serum copper level in 12% and low serum copper level in 07% of children while low serum zinc level in 50% of the children. This study provides basic information to allied health professionals, planners, and policymakers and we hope that it will encourage them to find better ways of combating afore mentioned micronutrients.
<Keywords: Micronutrients, Hidden deficiency, Pakistani population
Micronutrients are vitamins and minerals, which though needed in very small quantities, but still human beings need them to have strong bodies and mental vitality, resist various diseases, and produce normal and healthy children. In majority of cases the deficiency of micronutrients is either caused by inadequate access to food or high burden of disease or parasitic infections. In addition the dietary and feeding practices of particular community also play a part. The deficiency of micronutrients has negative effects on the heath and body functions of human beings [1].
Although vitamins and minerals are a very small part of our body tissues, but no doubt they have a vital role in growth and development. Being required in very minute amount they rightly support the term “micronutrients” [2]. The deficiencies of most micronutrients rich foods or their poor absorption have devastating health consequences on our bodies and mind [3].
One can define vitamins as those organic compounds which are required in small amounts in our diet from animals/plants sources, for maintenance of health, promotion of growth and reproduction, while minerals can be defined as inorganic compounds, which are not obtained from animals or plants, but rather obtained from the earth crust [4]. Their lack increases the overall risk of mortality and morbidity, including poor cognition and intellectual development, poor immune functions and poor capacity of work. In fact the devastating effects of micronutrient deficiencies more pronounced on children, pregnant and lactating women [5]. It is evident that around the world, at least two billion people live with vitamin and mineral deficiencies. Each year 3.5 million children under five years die because of malnutrition and it also impairs hundreds of thousands of growing minds [6]. Moreover it account for an estimated 11% of the global burden of disease [7].
It is said that silently micronutrient deficiencies affect people and entire communities in a vicious cycle of poor health, poor productivity and ultimate poverty. In majority of cases the affected victims never know the actual cause for their sufferings [8]. In connection to micronutrients malnutrition in pre-school children this study was planned to explore the hidden deficiency of micronutrients in the apparently healthy young children of district Bannu, Khyber Pakhtunkhwa, Pakistan.
After getting approval of the study from ethical committee of the institute, the following protocols were adopted for the determination of micronutrients in blood samples of pre-school children belonging to different parts of district Bannu.
Apparatus and glassware
In order to avoid the likelihood of contamination with trace elements, all glassware and bottles used for the separation of serum from samples were drenched in weak 10% Nitric Acid (HNO3) overnight and rinsed carefully with deionized water and double distilled water.
Instruments
Atomic Absorption Spectrophotometer (AAS) model Hitachi Polarized Zeeman Atomic Absorption Spectrometer, Z-8200, Japan was used for elemental (metals) analyses.
Selection of subjects
Total of one hundred (100) apparently normal healthy pre-school children (age < 5 years), from different ethnic groups of District Bannu , Khyber Pukhtunkhwa, Pakistan were selected for analysis, in order to evaluate their blood samples for any hidden deficiency of micronutrients malnutrition.
Inclusion criteria
• Preschool children of 1 – 5 years age group.
• Apparently healthy and symptom free children.
Exclusive criteria
• Children with any organic illnesses.
• Children suffering from protein caloric malnutrition or any vitamin(s) or mineral deficiency.
• Children with family history of genetic disorders.
• Children with haemoglobinopathies (thelesemais, sickle cell anemia etc).
• Children taking any medicines which can affect absorption of various micronutrients.
Collection and storage of samples
Blood samples of approximately 5 ml were drawn from antecubital vein using disposable syringes of 5 ml with butterfly needles of 22G with all aseptic measures. The blood was transferred to a sterilized and already labeled glass tubes and serial numbers were endorsed on the proforma. The blood was centrifuged in centrifuged machine (IEC Model DORP 6000 Centrifuged Machine) at 1500 – 2000 rpm for 10 minutes [9]. The separated layer of serum was clipped out with micropipette into sterile and properly labeled disposable plastic capped (eppendorf) tubes. All the tubes were stored at –20° C to be used for determination of the desired micronutrients.
Serum samples preparation for AAS
The collected serum samples were subjected to wet digestion before Elemental (Cu, Fe, Zn) determinations by using Atomic Absorption Spectrophotometer (AAS) model Hitachi Polarized Zeeman Atomic Absorption Spectrometer, Z-8200, Japan. One ml of serum was taken into a digestion flask and 10 ml of concentrated HNO3 was added. Mixture was heated at 60 to 70° C for about 15 minutes. After cooling, 5 ml of HClO4 was added in the flask. The contents of the flask were heated vigorously till the volume reduces to 1-2 ml. The contents were diluted up to the desired volume by adding de-ionized water [10].
Results of the study are tabulated at tables and Figures (Table 1) reveals that out of 100 individuals, 56 % were healthy children with mean age of 49.83 ± 1.78 months, while 7% were overweight with mean age of 57.29 ± 1.55 months, whereas, 7% were obese with mean age of 59 ± 00 months and 30% were underweight with mean age of 36.07 ± 2.94 months respectively. The mean BMI was 15.45 ± 0.16 kg/m2 in the healthy children, 18.32 ± 0.58 kg/m2 in overweight children, 19.69 ± 0.18 kg/m2 in obese children and 11.28 ± 0.32 kg/m2 in underweight children.
| Category | n | BMI (kg/cm2) | Age (months) | Zinc (µg/dl) | Iron (µg/dl) | Copper (µg/dl) |
|---|---|---|---|---|---|---|
| H | 56 | 15.45 ± 0.6 a | 49.83 ± 1.78 a | 62.72 ± 1.68 a | 61.76 ± 2.35 a | 108.28 ± 3.92 a |
| Ov | 7 | 18.32 ± 0.58 b | 57.29 ± 1.55 b | 56.39 ± 6.10 ab | 58.35 ± 10.06 ab | 103.89 ± 7.89 ab |
| Ob | 7 | 19.69 ± 0.18 c | 59.00 ± 0.00 bc | 66.85 ± 2.42 Abc | 66.21 ± 2.87 abc | 120.78 ± 9.03 abc |
| Un | 30 | 11.28 ± 0.32 d | 36.07 ± 2.94 d | 58.72 ± 3.01 Ab | 58.72 ± 3.01 abc | 134.48 ± 4.45 c |
Table 1: Micronutrients level in various categories of children
Table 2 shows that in the age group of <1 year, the overall mean serum Zinc (Zn) contents were 64.30 ± 5.6 μg/dl, overall mean serum Iron (Fe) contents were 59.37 ± 5.1 μg/dl, while the mean serum Copper (Cu) contents were 129.09 ± 10.9 μg/dl respectively. In the age group 1-2 years the mean serum Zinc (Zn) contents were 59.10 ± 3.2 μg/dl, the mean serum Iron (Fe) contents were 55.41 ± 3.2 μg/dl and the mean copper contents were 130.68 ± 13.5 μg/dl respectively.
| Age (yrs) | n | BMI (kg/cm2) | Age (months) | Zinc (µg/dl) | Iron (µg/dl) | Copper (µg/dl) |
|---|---|---|---|---|---|---|
| < 1 | 5 | 11.87 ± 1.68 a | 7.80 ± 1.80 a | 64.30 ± 5.62 a | 59.37 ± 5.09 A | 129.09 ± 10.91 a |
| 1-2 | 8 | 12.71 ± 1.82 ab | 20.88 ± 1.33 b | 59.10 ± 3.21 ab | 55.41 ± 3.14 ab | 130.68 ± 13.52 ab |
| 2-3 | 16 | 13.11 ± 0.56 abc | 34.00 ± 0.71 c | 70.24 ± 4.65 abc | 64.93 ± 4.63 abc | 126.70 ± 7.85 abc |
| 3-4 | 18 | 13.56 ± 0.62 abcd | 46.78 ± 0.69 d | 61.36 ± 3.90 abcd | 57.94 ± 4.68 abcd | 109.09 ± 7.85 abcd |
| 4-5 | 53 | 16.14 ± 0.33 e | 58.40 ± 0.21 e | 62.05 ± 1.58 abcd | 61.71 ± 2.40 abcd | 113.38 ± 3.49 abcd |
Table 2: Micronutrients level in various age groups
In the age group 2-3 years the mean serum zinc contents were 70.24 ± 4.7 μg/dl, The mean serum iron contents were 64.93 ± 4.6 μg/ dl and the mean copper contents were 126.70 ± 7.9 μg/dl respectively. Similarly, in the age group 3-4 years the mean serum Zinc (Zn) contents were 46.78 ± 0.7 μg/dl, the mean serum Iron (Fe) contents were 57.94 ± 4.7 μg/dl and the mean Copper (Cu) contents were 109.09 ± 7.9 μg/ dl respectively. Result shows that Zinc (Zn) level is high in age group of 2-3yrs and low in the rest of age groups. Similarly, Iron level is found high in 2-3yrs age group and 4-5 yrs age group.
Table 3 shows that overall mean serum Zinc, Iron and Copper contents in 64 male and 36 female children. The overall mean serum zinc, iron and copper contents among male children were 65.38 ± 1.7 μg/dl, 64.69 ± 2.2 μg/dl and 113.35 ± 3.2 μg/dl and the overall mean serum Zinc, Iron and Copper contents among female children were 59.09 ± 2.4 μg/dl, 54.23 ± 2.4 μg/dl and 123.23 ± 5.2 μg/dl respectively.
| Gender | N | BMI (kg/cm2) | Age (months) | Zinc (µg/dl) | Iron (µg/dl) | Copper (µg/dl) |
|---|---|---|---|---|---|---|
| Male | 64 | 15.17 ±0.37 a | 48.91 ±1.83 a | 65.38 ± 1.65 a | 64.69 ±2.19 a | 113.35 ±3.51 a |
| Female | 36 | 13.86 ±0.45 b | 43.25 ±2.68 a | 59.09 ±2.38 b | 54.23 ±2.44 b | 123.23 ±5.15 a |
Table 3: Gender wise distribution of Micronutrients level
The results in Table 4, shows the distribution of serum Zinc, Iron and Copper contents in urban and rural children. The overall mean serum zinc, iron and copper contents amongst 48 urban children were 62.84 ± 1.94 μg/dl, 61.12 ± 2.36 μg/dl and 117.80 ± 4.68 μg/dl respectively and the overall mean serum zinc, Iron and copper contents among rural children were 63.37 ± 1.99 μg/dl, 60.75 ± 2.52 μg/dl and 116.08 ± 3.67 μg/dl respectively, showing no significant difference among the rural and urban children however, the serum zinc levels of rural children were slightly higher than the urban children. Same is the case of copper which is found low in urban when compared to rural. The BMI and age were also not significantly different in both urban and rural children (P > 0.05).
| Residence | n | BMI (kg/cm2) | Age (months) | Zinc (µg/dl) | Iron (µg/dl) | Copper (µg/dl) |
|---|---|---|---|---|---|---|
| Urban | 48 | 14.72 ± 0.39 a | 47.19 ± 2.21 a | 62.84 ± 1.94 a | 61.12 ± 2.36 a | 117.80 ± 4.68 A |
| Rural | 52 | 14.68 ± 0.43 a | 46.58 ± 2.15 a | 63.37 ± 1.99 a | 60.75 ± 2.52 a | 116.08 ± 3.67 A |
Table 4: Trace elements in urban & rural populations of the study
The results shown by Table 5 represent the distribution of serum zinc, iron and copper levels with respect to different mode of feeding including mother feeding, bottles or mixed feedings in the study subjects. In total of 100 subjects, seven (07) were on mixed pattern, twenty eight (28) were bottled fed and sixty five (65) were mother / breast fed. BMI in mixed group was 16.38 ± 0.8 as well in bottle fed & mother fed it is 15.66 ± 0.5 and 14.11 ± 0.4 respectively. It shows significant difference from each other (P = 0.05). The serum Zinc, Iron and Copper levels in children dependent on mixed food were 56.33 ± 3.8 μg/dl, 55.60 ± 5.0 μg/dl and 81.61 ± 8.04 μg/dl. The serum zinc, iron and copper levels in children dependent on bottle feeding were 60.57 ± 2.03 μg/dl, 58.86 ± 3.3 μg/dl and 112.99 ± 4.6 μg/dl respectively. The serum Zinc, Iron and Copper levels in children dependent on mother milk were 64.94 ± 3.8 μg/dl, 62.39 ± 2.2 μg/dl and 121.54 ± 3.8 μg/dl respectively. The comparison shows a higher concentration of zinc, iron and copper among children who were fed on mother milk as compared to those children who were fed on mixed food or bottles milk.
| Group | n | BMI | Zinc | Iron | Copper | ||||||||||||
|---|---|---|---|---|---|---|---|---|---|---|---|---|---|---|---|---|---|
| M | 7 | 16.4 | - | 0.78 | a | 56.3 | - | 3.79 | a | 55.6 | - | 5.01 | a | 81.6 | - | 8.04 | a |
| B | 28 | 15.7 | - | 0.5 | ab | 60.8 | - | 2.03 | ab | 58.9 | - | 3.29 | ab | 113 | - | 4.59 | b |
| MF | 65 | 14.1 | - | 0.37 | c | 64.9 | - | 1.87 | b | 62.4 | - | 2.18 | ab | 122 | - | 3.78 | b |
Table 5: Micronutrients level in various feeding methods
Micronutrient deficiencies are important nutritional problems and are widespread in many developing countries [11,12]. Micronutrients have long been accepted as indispensable for optimal health. The medical implication of trace elements is still somewhat contentious. Among the trace elements, iron, copper and zinc are of scrupulous interest.
The present study demonstrated that micronutrient deficiencies were found to be somewhat common among apparently healthy preschool children living in the region of district Bannu (Pakistan). The prevalence of micronutrient deficiencies, (iron, copper, zinc) and their relationships were investigated in the present study. The findings of the present study showed that although overall serum iron level was within normal limits in 75% of the studied population, the mean iron levels were high in obese individuals, overweight and underweight subjects. But obesity has been associated with low-serum iron concentrations. The inverse relationship between iron status and adiposity was first reported in 1962, when Wenzel et al. surprisingly found a considerably lower mean serum iron concentration in obese compared with nonobese children [13]. But our findings are supported by a recent study of Muhammad Ramzan et al., in D.I.Khan, Khyber Pakhtunkhwa, Pakistan, who found none of the obese school children as Iron deficient [14]. Similarly overall serum zinc level was found low in 50% of the subjects, the mean zinc levels were slightly higher in overweight and underweight subjects but not statistically significant (P=>0.05). It is estimated by World Health Organization (WHO) that approximately 27% (168 million) of children under five years of age are underweight [15]. Underweight remains a persistent dilemma in developing countries, where poverty is a strong fundamental determinant, and causative agent to household food insecurity. Besides these poor child care, maternal under nutrition, lack of breastfeeding and inadequate zinc bioavailability may be the few causes of low serum zinc level in underweight and overweight pre -school children. Iron and zinc are two examples of common nutrient deficiencies found in overweight and underweight children [16]. The prevalence of overweight among children has been increasing at an alarming rate.In a recent study it was found that children with higher zinc levels were less apt to be obese than children with low levels [17]. While our study shows unexpected high level of zinc in obese pre- school child as compared to overweight, underweight and healthy children (66.85 ± 2.87) (Table 1).
In our study as a whole serum copper level was found normal in 81% of the studied population, deficient in 7% and high in 12% of the cases (Table 4).The higher serum copper level was observed in more in rural samples, which need further evaluations. Serum copper levels were significantly high in underweight subjects in comparison with obese and overweight subjects. Although the result is again unexpected but there are a number of environmental factors which can further exacerbate the problem of copper excess. For the past forty or forty-five years, the use of copper pipes in household plumbing has contributed substantially to ingestion of increased amounts of copper, especially in the presence of "softened" water. Also, zinc deficient diets may lead to copper excess. Food processing and the deficiency of zinc in our soils are contributing directly or indirectly to the risk of copper excess. There is some clinical evidence which suggests that copper excess in children with ADD (Attention Deficit Disorder) and certain types of behavior disorders may begin in utero. Heavy copper excess in a mother may be strongly associated with copper excess in one or more of her children depending on how much stress she experienced during that particular pregnancy [18].
Age wise distribution of serum iron, zinc and copper are shown to be strong predictors of child nutritional status. The effect of age is probably mediated by breastfeeding or more intense parental attention in younger children especially in the age of 2-3 years. The present study shows that girls are more likely to suffer from under nutrition than boys, as it is evident from our results that serum zinc, iron and copper contents among male children were 65.38 ± 1.65 μg/dl, 64.69 ± 2.19 μg/dl and 113.35 ± 3.15 μg/dl and among female children were 59.09 ± 2.38μg/dl , 54.23 ± 2.44 μg/dl and 123.23 ± 5.15 μg/dl respectively.
The health and nutrition profile of the girl child through the transition from early childhood to early womanhood does not come through as clearly as the threatened chances of her survival, unequal distribution of food in the family, with a definite gender discrimination against the female has been observed even in rich families in our society, but the lines of discrimination in poorer societies seem to be etched deeper [19]. Even when conservative families can afford to feed a good diet to both male and female children only the boys are given the rich diet and girls a much poorer one. This is mainly because of the conviction that a girl given rich food comes of age and starts menstruating earlier [20]. Otherwise in poorer families the female children are generally neglected and sons get preference in terms of best as well as larger share of food.
When we decided to undertake this study we were expecting that copper deficiency if present, would most likely affect the nutritionally vulnerable sectors of the children population. Contrary to our expectations, female children had the highest levels of serum copper in our study, as the copper contents among male children in our study were 113.35 ± 3.15 μg/dl and among female children were 123.23 ± 5.15 μg/dl respectively, showing a bite high concentration in female children as compared to male children (Table 1 and Figure 1). The observation that females tend to have higher serum copper levels than male children is not clear to us, although zinc deficiency has been reported with copper excess [21]. We think that the copper status of male subjects needs more clarification/evaluation with larger sample size.
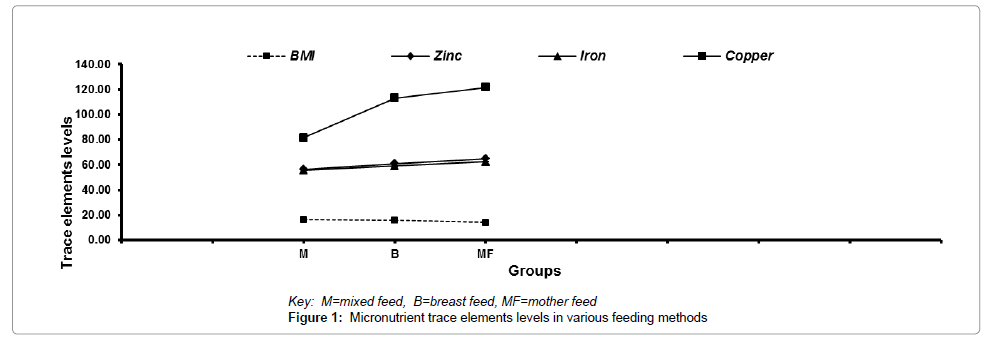
Figure 1: Micronutrient trace elements levels in various feeding methods
In Pakistan there is significant difference between urban and rural children’s population in terms of economic status, life style and nutritional status. Ample evidence shows that urban children generally have a better nutritional status than their rural counterparts. Our results showed that serum zinc, iron and copper contents among urban children were 62.84 ± 1.94 μg/dl, 61.12 ± 2.36 μg/dl and 117.80 ± 4.68 μg/dl, while in rural children, it were 63.37 ± 1.99 μg/dl, 60.75 ± 2.52 μg/dl and 116.08 ± 3.67 μg/dl respectively, showing deficiency of micronutrients in rural children in comparison with urban children of District Bannu, Khyber Pakhtunkhwa, but the difference was not significant, which is an agreement to previous studies [22].
The results by urban-rural classification showed that iron deficiency anemia was more prevalent in rural than in urban children, while no significant differences were observed in the prevalence of zinc between urban and rural children respectively (Table 4).The same has been supported by other investigators, in both urban and rural regions, females were more attributed to anemia [23]. In children, severe anemia can impair growth and mental development. Children with severe irondeficiency anemia may also have an increased risk for stroke [24]. The low Hb and MCV are associated with low serum ferritin concentration in anemic children [25]. In the population survey it has been reported that children and women of childbearing age are more affected. It was found that iron deficiency anemia may vary from 17% to 70% in preschool children; while in adolescents it may vary between 14% to 42% and in child bearing age from 11% to 40% [26].
Breast milk is the basic right of child and is the most excellent first food for babies [27]. The nutrients present in the breast milk are the species specific formula for excellent growth and development. In the present study the children who were fed by their mother showed no deficiency of micronutrients as compared to bottle fed children and children who were dependent on mixed food. The period from birth to two years of age is widely recognized as the critical period, during which growth retardation and micronutrient deficiencies can occur. Nutritional vulnerability during this period results from poor breastfeeding and addition of complementary food, coupled with high rates of infectious diseases [28]. At present, the feeding bottle are s viewed as a” symbol of modernity”; the majority of infants appear to be fed on bottles which can be purchased in the smallest shops(kokas), even in remote villages [29]. Breast feeding directly promotes overall health of the child and results in decreased childhood morbidity and mortality [30]. Although breast feeding is well experienced in our community but the ratio of exclusive breast feeding is low. Mothers have meager knowledge of benefits of breast feeding. The lack of exclusive breastfeeding, early introduction of harmonizing foods and wrong preparation of formula milk may also be the causes of micronutrient deficiencies in bottle fed and mixed food dependent children.
The results of this study shows prevalence of micronutrients deficiency in apparently healthy pre-school-age Pakistani children of District Bannu, Khyber Pakhtunkhwa. We found low serum iron level in 25% of children, high serum copper level in 12% and low serum copper level in 07% of children while low serum zinc level in 50% of the children. This study provides basic information to allied health professionals, planners, and policymakers and we hope that it will encourage them to find better ways of combating afore mentioned micronutrients.
Areas where micronutrient deficiencies are extremely high (due to dietary inadequacies), regular supplementation is essential for correction of nutritional status and thereby for improvement of health status of the children <5 years. Moreover a comprehensive food policy may be adopted which includes food availability and distribution with special attention to maternal and child as well elderly and low-income people.