
Immunotherapy: Open Access
Open Access
ISSN: 2471-9552

ISSN: 2471-9552
Research Article - (2022)Volume 8, Issue 6
Poly-Cystic Ovary Syndrome (PCOS) may be characterized by skeletal muscle abnormalities. Pioglitazone has a certain therapeutic effect on skeletal muscle metabolism in PCOS patients. To investigate the other effects of pioglitazone on skeletal muscle and its mechanism. We used Weighted Gene Co-expression Network Analysis (WGCNA) to identify potential key genes and signaling pathways involved in pioglitazone affecting skeletal muscle in PCOS patients. First, download the chip data of GSE8157 from GEO database. Then, modules related to genes expressed in skeletal muscle of PCOS patients before and after pioglitazone treatment were screened by WGCNA and core genes and differential gene analysis methods were further selected according to the correlation characteristics between modules and clinical manifestations. Finally, the selected genes were enriched for analysis. Four significantly up-regulated genes were screened out by differential gene analysis: MTBP, MAPK14, RBBP6 and PTPRC (Protein Tyrosine Phosphatase Receptor Type C). They are both associated with cell cycle regulation and immune cell (T-cell) antigen receptor signaling. The effect of pioglitazone on skeletal muscle of PCOS patients is mainly reflected in the regulation of abnormal expression of cell cycle and immune cell-related genes. Among them, HFE gene has the most obvious regulation effect on T lymphocyte activity, which may be a potential gene target for the treatment of PCOS.
Immune; PCOS; Pioglitazone; Bioinformatics analysis; Skeletal muscle; Tc cell
Poly-Cystic Ovary Syndrome (PCOS) is the most common disease of dysgenesis and endocrine metabolic disorder of women of reproductive age. Its characteristic phenotypes include elevated androgen levels, irregular menstruation and polycystic ovary [1].The hyper androgenic manifestations of PCOS include dyslipidemia, insulin resistance, type-2 Diabetes Mellitus (DM2), obesity, cancer, infertility, and coronary heart diseases [2]. At present, there is evidence to support the key role of elevated androgen levels in PCOS pathogenesis, which affects the function of various tissues of the body, among which skeletal muscle is one of the main targets of androgen. Skeletal muscle as a key metabolic active organ is the most effective organ for insulin-stimulated glucose uptake in the body [3], it might deeply affect systemic glucose tolerance and serum insulin levels. And plays an important role in the development and progression of type 2 diabetes [4].
Additional studies have found that an important subgroup of patients with PCOS may have autoantibodies [5] that differ in their pathophysiological autoimmune components. It has previously been documented in PCOS, for example, anti-nuclear, anti-thyroid, anti-SM, anti-histone, anti-ovarian, and anti-islet cell antibodies [6]. Studies have verified the dose-dependent effect of gonadotropin-releasing hormone receptor activation in gonadotropin-releasing hormone receptor transfected cells by purifying antibodies of high gonadotropin-releasing hormone receptor antibodies from PCOS subjects; This in vitro activity was antagonized by the gonadotropin-releasing hormone receptor antagonist Siltrafic [7], this finding supports the involvement of gonadotropin-releasing hormone receptor antibody in the pathogenesis of PCOS disease. Further studies have found the effect of gonadotropin-releasing hormone receptor antibody on the insulin receptor/PI3K/Akt/Glut signaling pathway in liver and skeletal muscle. Therefore, skeletal muscle is still closely related to the pathogenesis and clinical manifestations of PCOS patients and the abnormality of immune components may become an important potential mechanism. At present, most studies on skeletal muscle abnormalities in PCOS patients still focus on hormone levels, while ignoring the abnormal gene expression in skeletal muscle itself.
Thiazolidinediones, including pioglitazone, have been shown to improve metabolic disorders in patients with PCOS [8]. Recent microarray study,demonstrated significant differential expression of several genes in skeletal muscle of women with PCOS after pioglitazone treatment, and that pioglitazone treatment significantly reduced fasting serum insulin in PCOS subjects. Improved insulin-stimulated Rd, glucose oxidation, and NOGM [9]. This study confirmed that pioglitazone has a certain effect on skeletal muscle abnormalities in PCOS patients, but it still focuses on the study of hormone levels and has not been further explored. Therefore, this studies mainly mined potential key genes and signal pathways related to pioglitazone's influence on skeletal muscle of PCOS patients through comprehensive analysis of WGCNA. This mining information further explored the effects of pioglitazone on skeletal muscle of PCOS patients at the genetic level, and the results showed that the effects of pioglitazone on skeletal muscle of PCOS patients were not only reflected in hormone level, but also on immune cells and cell cycle, which could not be ignored. The results of this study may provide a new association between pioglitazone and PCOS patients and providing value for subsequent studies.
Data retrieval and preprocessing
The GSE8157 gene expression profile data and clinical information used for analysis are derived from the GEO database. The platform is GPL570; four groups of samples were included, including pioglitazone pretreatment group, pioglitazone post-treatment group, placebo group and blank control group. This study uses R programming language to download and preprocess the data, including constructing gene expression matrix, transforming probe name into gene name, and finally obtaining gene matrix and clinical information matrix suitable for WGCNA analysis.
Construction of co-expression network and identification of modules
To research the expression network of pioglitazone on the effects of related genes in muscle of PCOS patients, we use the WGCNA software package in the R to construct the weighted gene co-expression network. According to the standard of scale-free network β, the correlation matrix is transformed into adjacency matrix. And then by dynamic shear method (dynamic tree cut) and combined with module recognition to draw the gene tree map. Modules are defined as the branch cutoff of the tree, and each module is marked with a unique color. Module Eigengene (ME) is defined as the first principal component of the module. Finally, WGCNA software package is used to determine the most relevant modules for clinical information.
Identification of core genes
After determining the correlation between the module and clinical information, we selected the appropriate module and screened the core genes. We first constructed the PPI network of selected modules and imported them into the cytoscape to screen out the largest Degree of the first 30 genes by cytohuaab. Meanwhile, we imported string database processed genetic data into excel, the largest top 30 genes were screened by calculating the repeat rate of genes. Finally, we take the intersection gene of the two methods as the core gene.
Gene clustering and differential expression analysis
To explore genes associated with different stages, we used methods of gene clustering and differential expression analysis. Visualization results of differential gene expression analysis by means of ggplot2 package. Briefly, the read counts were entered to build the analysis objects. DEGs at different stages were illustrated using a volcano plot according to the ggplot2 package. Genes with a p-value<0.05 and absolute fold change ≥1 were regarded as differentially expressed genes.
Core gene GO and KEGG analysis
For further study of the molecular mechanism of core gene in the effect of pioglitazone on skeletal muscle of PCOS patients. We used the cluster profile package of R software for GO and enrichment analysis of these core genes and KEGG signaling pathways. We used the cluster profile package of R software to analyze the enrichment of these core genes GO and KEGG signaling pathways. Before analysis, we transferred gene names from “symbol” to “entrezid” according to org. Hs.eg.db package (V3.8.2) [10].
Data preprocessing
GSE8157 data sets were retrieved and downloaded, with a total of 43 samples and 1728 gene probes. In this set of data, the samples were divided into 4 groups, including 10 cases in pretreatment group, 10 cases in post-treatment group, 13 cases in placebo group and 10 cases in blank control group. After that, we transformed the data id and processed the matrix, and finally got 1006 expression genes. The row of clinical information matrix was named sample name, column name was MPP, MPAP, MPC and mpc (represented pretreatment, post-treatment, comfort group and blank control group respectively).
WGCNA building modules and significantly associated with clinical phenotypes
WGCNA correlation analysis was performed on all the processed genes. In order to satisfy the prerequisite that the co-expression network meets the non-scale network, that is, the logarithm of the node with k connectivity lgk is negatively correlated with the probability logarithm of the node lg [p(k)], and the correlation coefficient should >0.8. We need to use the R software WGCNA package to set the network construction parameter selection range and calculate the scale-free topology matrix. Finally, the analysis package automatically selects and calculates the resulting soft threshold β=5. And then calculate the difference coefficient between gene points to obtain a systematic clustering tree (minmodulesize=30,mergecutheigh=0.25). Through Figures 1a and 1b, we get the module division tree diagram of figure. Each color represents a different module. After screening, a total of 4 modules except gray module were obtained, and then the correlation between the selected module and clinical phenotype was calculated. Figure 2 shows the heat map between different color modules and clinical phenotypes. Blue indicates negative correlation, red indicates positive correlation. The results showed that the modules with three colors had a significant correlation with clinical phenotypes: brown, blue and yellow. After the calculation according to the hypergeometric enrichment algorithm,screened and classified genes in the previous step are mapped into each module in Figure 3. The pie chart shows the module distribution ratio (the gray module is a collection of genes that cannot be aggregated to other modules, not included in the pie chart). By sorting out the module information and selecting the stable module with good P value and correlation, the results are shown in the Table 1. The results showed that genes were significantly enriched in brown, blue and yellow modules, and the relationship between binding genes and clinical phenotypes in the above modules. We used the genes in the blue and yellow modules as target genes and performed the following analysis (the blue module contained 240 genes, while the yellow module contained 196 genes). We found that the yellow module is highly correlated with pretreatment and post-processing, which is positively correlated with pretreatment and negatively correlated with post-processing. Therefore, we screened and enriched the core genes of yellow module genes. The blue module is always highly positively correlated with pretreatment and post-processing, so we analyze the differential genes of the blue module.
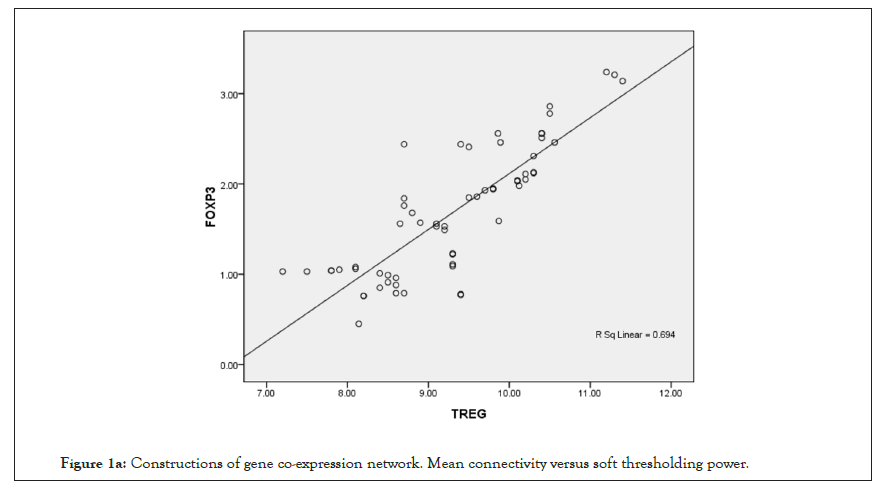
Figure 1a: Constructions of gene co-expression network. Mean connectivity versus soft thresholding power.
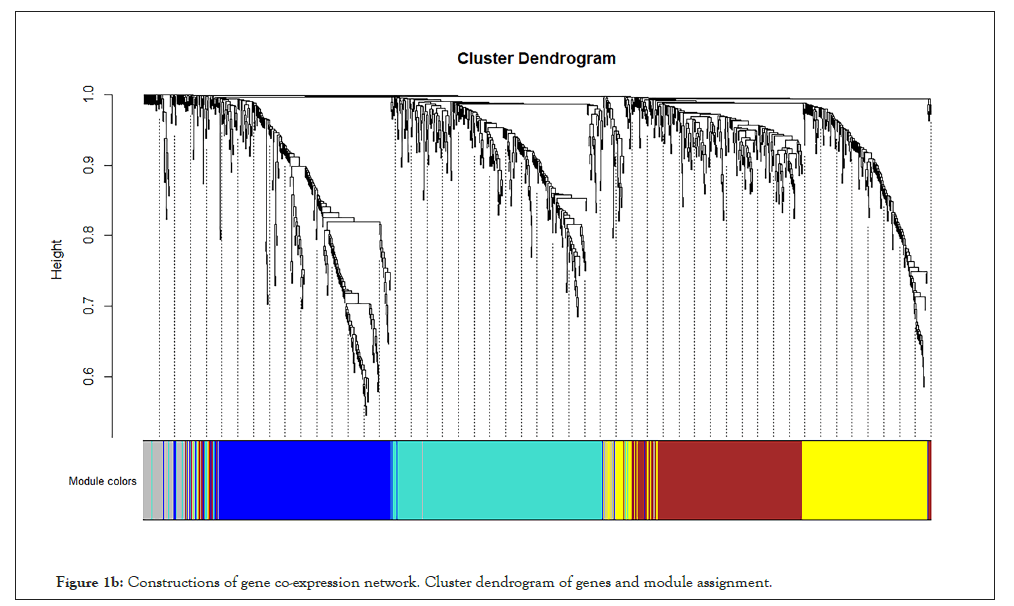
Figure 1b: Constructions of gene co-expression network. Cluster dendrogram of genes and module assignment.
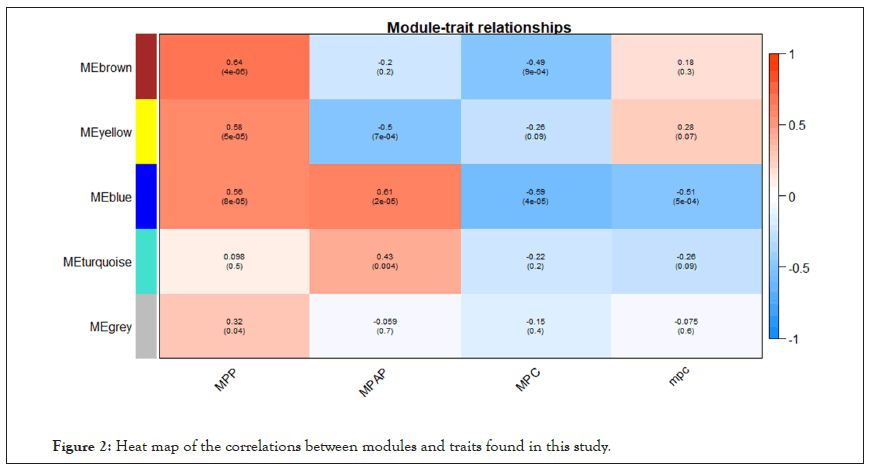
Figure 2: Heat map of the correlations between modules and traits found in this study.
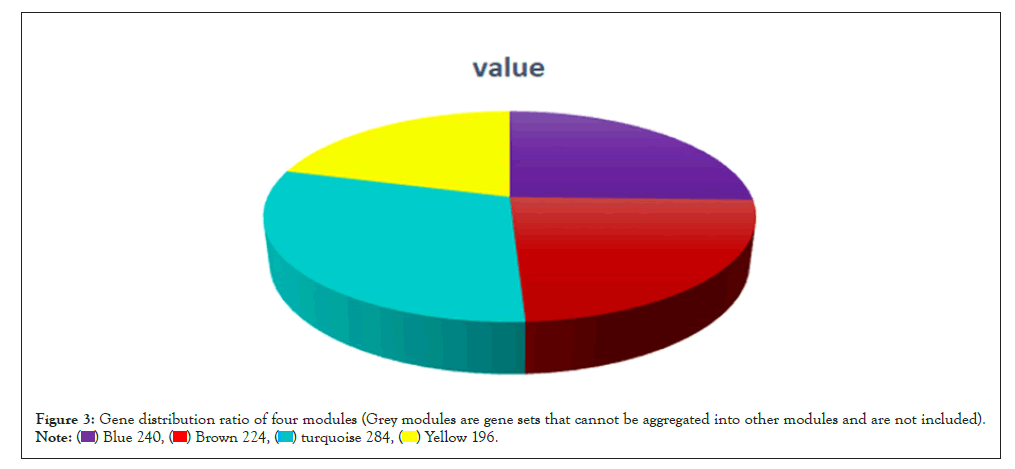
Figure 3: Gene distribution ratio of four modules (Grey modules are gene sets that cannot be aggregated into other modules and are not included). 
| Sample | Colour | Gene | Correlation | P Value |
|---|---|---|---|---|
| MPP | Brown | 224 | 0.64 | 4.00E-06 |
| Yellow | 196 | 0.58 | 5.00E-05 | |
| Blue | 240 | 0.56 | 8.00E-05 | |
| Turquoise | 284 | 0.098 | 0.5 | |
| Grey | 63 | 0.32 | 0.04 | |
| MPAP | Brown | 224 | -0.2 | 0.2 |
| Yellow | 196 | -0.5 | 7.00E-04 | |
| Blue | 240 | 0.61 | 2.00E-05 | |
| Turquoise | 284 | 0.43 | 0.004 | |
| Grey | 63 | -0.059 | 0.7 |
Table 1: Stable module with good P value and correlation.
Screening of core genes
To further screen the core genes of the selected modules. We first uploaded 240 genes within the yellow module to the STRING database and constructed a PPI network (using low confidence 0.150 as screening criteria). The obtained data are imported into the Cytoscape and the first 30 genes Degree are screened by the CytoHubba plug-in Figure 4. Meanwhile, we import the STRING data into the excel and use the Countif function to screen out that top 30 genes with the most repeat frequency. Finally, the intersection of the two methods (27 genes) Table 2 is taken as the core gene for subsequent analysis (Figure 5).
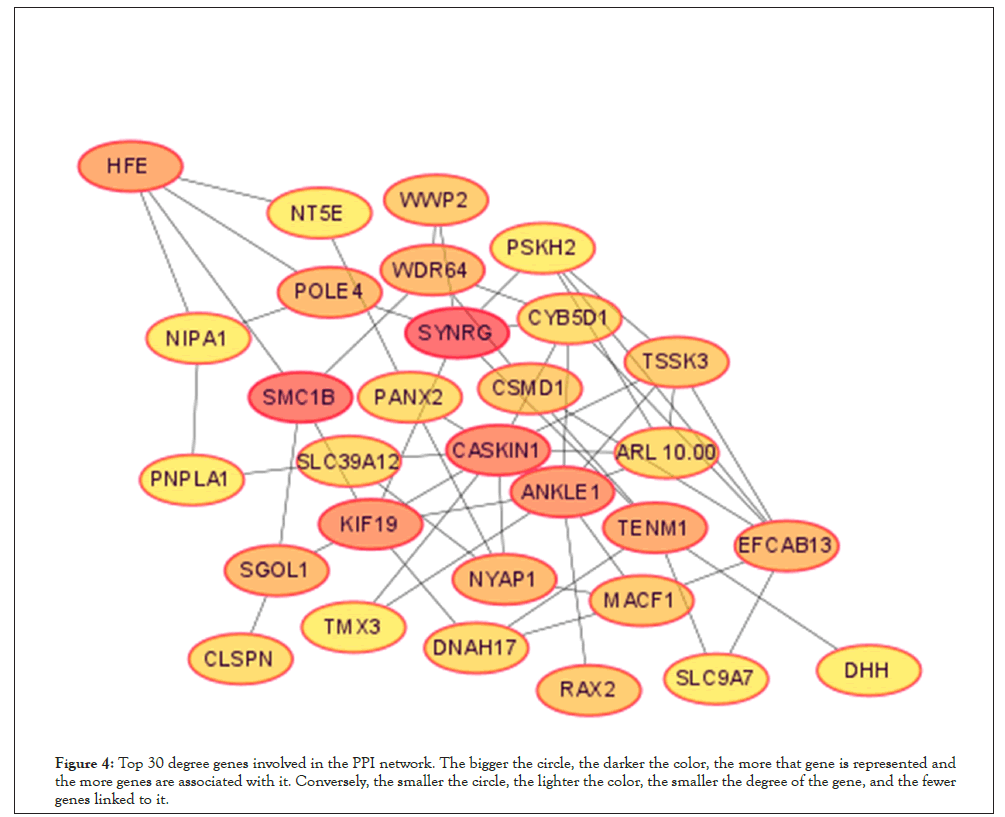
Figure 4: Top 30 degree genes involved in the PPI network. The bigger the circle, the darker the color, the more that gene is represented and the more genes are associated with it. Conversely, the smaller the circle, the lighter the color, the smaller the degree of the gene, and the fewer genes linked to it.
| Cytoscape hub gene name | Score | Excel hub gene name | Time |
|---|---|---|---|
| CASKIN1 | 29 | SYNRG | 16 |
| ANKLE1 | 24 | SMC1B | 14 |
| TSSK3 | 22 | CASKIN1 | 13 |
| SYNRG | 21 | ANKLE1 | 12 |
| SMC1B | 15 | KIF19 | 12 |
| KIF19 | 14 | HFE | 10 |
| SGOL1 | 13 | TENM1 | 10 |
| ARL10.00 | 12 | EFCAB13 | 9 |
| POLE4 | 12 | NYAP1 | 9 |
| HFE | 12 | POLE4 | 9 |
| NYAP1 | 12 | SGOL1 | 9 |
| TENM1 | 11 | WDR64 | 9 |
| STK32A | 11 | CSMD1 | 8 |
| CLSPN | 10 | MACF1 | 8 |
| KIAA1524 | 9 | RAX2 | 8 |
| FIGNL1 | 9 | TSSK3 | 8 |
| EFCAB13 | 9 | WWP2 | 8 |
| WDR64 | 9 | ARL10.00 | 7 |
| MACF1 | 9 | CLSPN | 7 |
| CYB5D1 | 9 | CYB5D1 | 7 |
| WWP2 | 8 | DNAH17 | 7 |
| SLC39A12 | 8 | PANX2 | 7 |
| PSKH2 | 8 | SLC39A12 | 7 |
| CSMD1 | 8 | ARPP21 | 6 |
| RAX2 | 8 | DHH | 6 |
| HS6ST3 | 7 | FIGNL1 | 6 |
| PANX2 | 7 | KIAA1524 | 6 |
| RDH10 | 7 | NIPA1 | 6 |
| DNAH17 | 7 | NT5E | 6 |
| TMX3 | 7 | PNPLA1 | 6 |
Table 2: Cytoscape and excel hub gene: Yellow gene is the intersection gene, namely the hub gene.
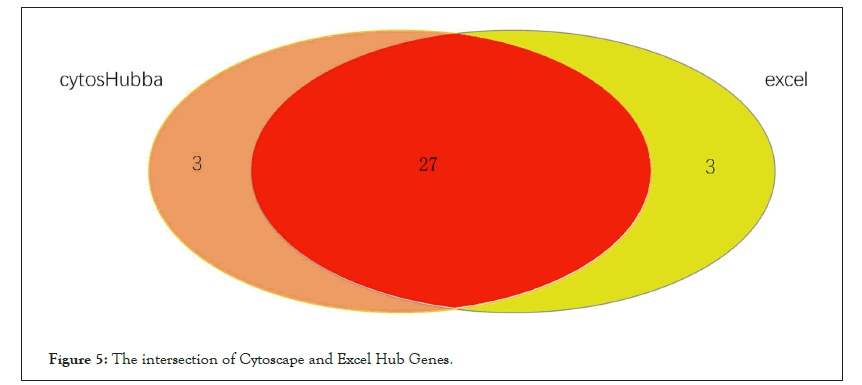
Figure 5: The intersection of Cytoscape and Excel Hub Genes.
GO and KEGG enrichment analysis of core genes
For the purpose of further exploring the molecular biological mechanism of core genes in the effect of pioglitazone on skeletal muscle of PCOS patients, we performed GO and KEGG enrichment analysis of core genes in the yellow module. GO enrichment analysis of core genes showed in Figure 6, these 22 potential key genes are mainly enriched in the activities of enzymes that affect cell (such as ubiquitin protein ligase activity, protein dimer activity)and is associated with muscle movements (such as cellular activity and excitatory protein filament binding) and cell cycle (RNA polymerase 2 transcription factor binding).Meanwhile, KEGG enrichment analysis showed in Figure 7, these 27 potential key genes are mainly related to cell division cycle and neuromuscular disease.
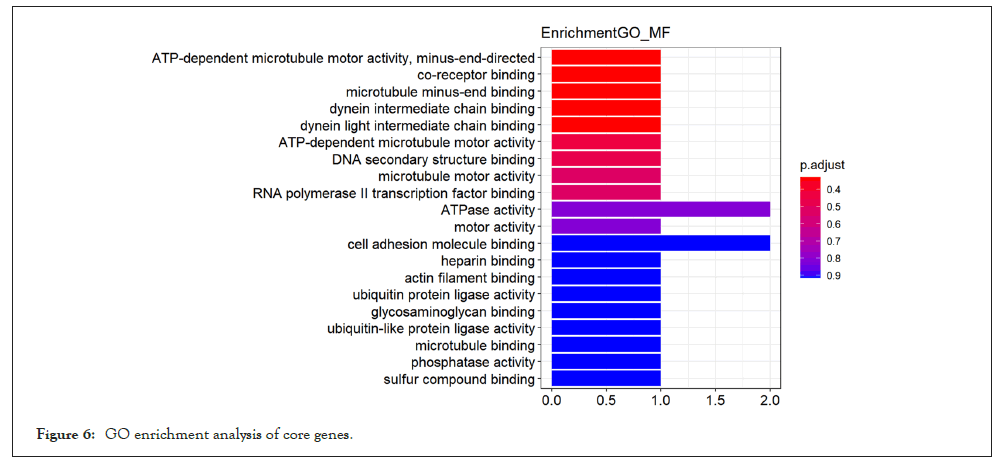
Figure 6: GO enrichment analysis of core genes.
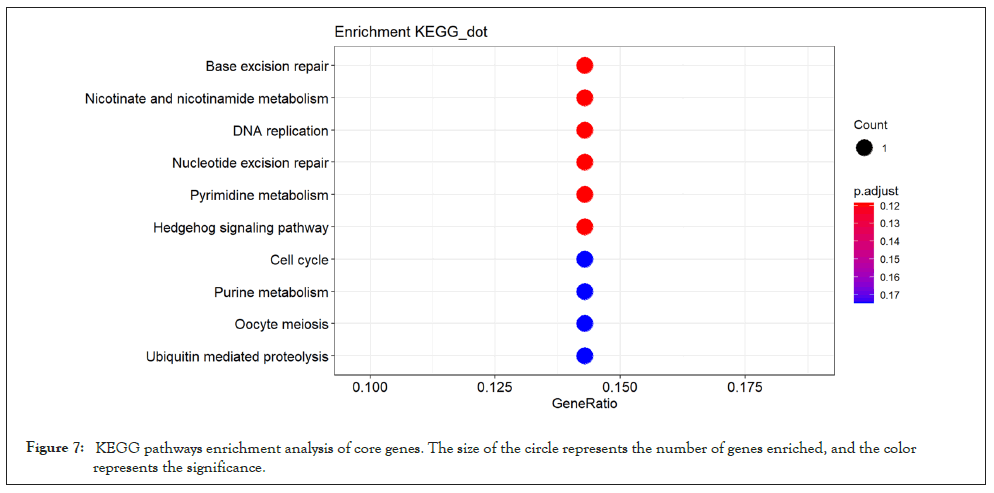
Figure 7: KEGG pathways enrichment analysis of core genes. The size of the circle represents the number of genes enriched, and the color Figure 5: The intersection of Cytoscape and Excel Hub Genes. represents the significance.
Differential gene analysis
Based on the high correlation between blue module and pretreatment group and post-processing group, to explore the genes that changed greatly in the samples before and after pioglitazone treatment, we chose to analyze the differential expression of genes in the blue module. We downloaded GSE8157 data from the GEO database for differential genetic analysis, the genes in the blue module were screened and extracted (109 genes were extracted). We clustered the resulting data. At the same time, the differential expression analysis was screened by using the ggplot2 package to draw the volcanic map (Parameter set to logFC>1, P value<0.05) (Figure 8). Four significantly upregulated differential genes (MTBP, MAPK14, RBBP6 and PTPRC) were obtained for subsequent analysis. At the same time, we screened the expression matrix data corresponding to the genes for differential gene analysis from the original gene expression matrix data and drew the cluster graph (Figure 9).
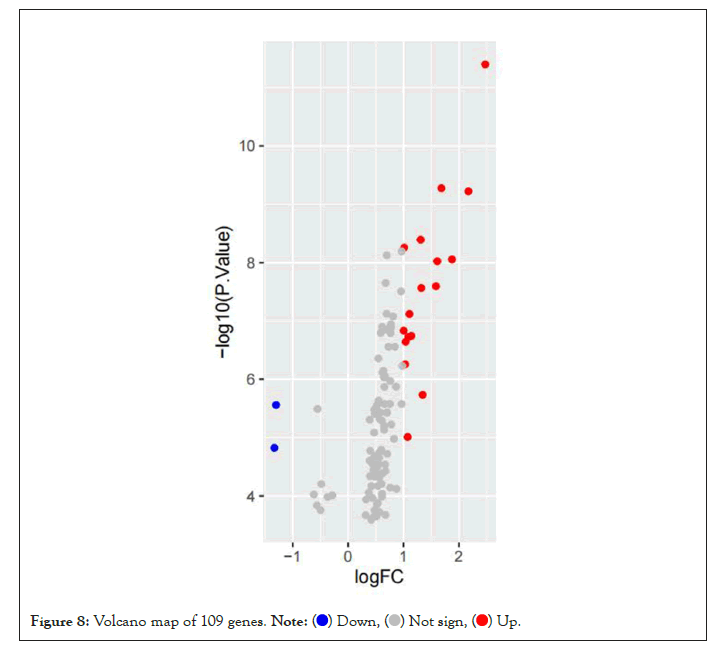
Figure 8: Volcano map of 109 genes. 
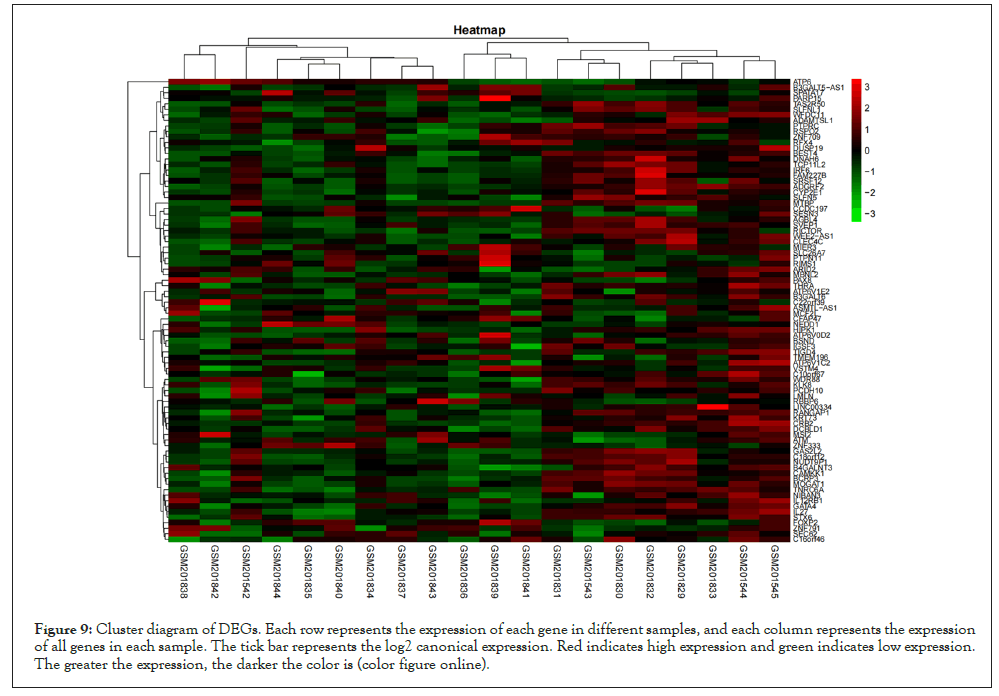
Figure 9: Cluster diagram of DEGs. Each row represents the expression of each gene in different samples, and each column represents the expression of all genes in each sample. The tick bar represents the log2 canonical expression. Red indicates high expression and green indicates low expression. The greater the expression, the darker the color is (color figure online).
Poly-Cystic Ovary Syndrome (PCOS) is a common cause of infertility in women of childbearing age. This disease is often associated with endocrine disorders. Due to unclear pathogenesis and the diversity of complications, PCOS patients suffer from multiple physiological and psychological pressures. Evidence showed that pioglitazone can ameliorates metabolic disorders in PCOS patients and corrects preexisting down regulation of pathways in skeletal muscle (pioglitazone Pio repeat) in PCOS patients. In order to explore the other effects of pioglitazone on skeletal muscle expression genes in PCOS patients, the skeletal muscle tissue chip dataset GSE8157 of PCOS patients before and after pioglitazone treatment was used for biogenic analysis. Through WGCNA analysis method, modules with high correlation with clinical phenotypes were found, and different analysis methods were selected according to different characteristics of the correlation between modules and clinical phenotypes. After GO analysis of core genes in yellow module, it was found that these 27 genes were mainly related to cell cycle and cellular enzymes. In addition, most of these genes were found to be related to immune cells shown in Table 3. Among them, some genes are related to activation of T-cells, such as GO: 2001185 and GO: 0002710 and some genes are related to antigen presentation, such as GO: 0002483 and GO: 0019885. These genes were found to be correlated with HFE gene, which was directly targeted by cytotoxic TCR αβ T lymphocytes [11]. Meanwhile, HFE positive can select a CD8 positive T cell subtype, and support the theory that the immune system is involved in iron metabolism control [12]. Studies have shown that the systemic immunity of PCOS patients is dominated by Th1 type immunity, and Th1/Th2 imbalance is associated with obesity, especially abdominal obesity, and may be one of the underlying mechanisms of PCOS disease [13]. All of these results showed that pioglitazone potential impact on the immune cells of patients with PCOS may play a larger role in the treatment process and can be expressed by skeletal muscle cells. In addition to PCOS obesity being associated with immune responses, insulin resistance is also associated with immune responses, which can stimulate the onset of low-grade inflammation [14]. PCOS and other high-risk reproductive disorders are associated with Nod-Like Receptor Protein 3 (NLRP3) inflammatory bodies, a key regulator of host immune response. Current research suggested that NLRP3 inflammasome plays an important role in female reproductive disorders and provides new insights into the treatment of PCOS patients [15].
| ID | Description | P value | Gene ID | Count |
|---|---|---|---|---|
| GO:2001185 | Regulation of CD8-positive, alpha-beta T cell activation | 0.018957998 | HFE | 1 |
| GO:0002483 | Antigen processing and presentation of endogenous peptide antigen | 0.023284621 | HFE | 1 |
| GO:0019885 | Antigen processing and presentation of endogenous peptide antigen via MHC class I | 0.023284621 | HFE | 1 |
| GO:0002710 | Negative regulation of T cell mediated immunity | 0.024722833 | HFE | 1 |
| GO:0006359 | Regulation of transcription by RNA polymerase III | 0.026159052 | TENM1 | 1 |
| GO:0002577 | Regulation of antigen processing and presentation | 0.02902552 | HFE | 1 |
| GO:0036037 | CD8-positive, alpha-beta T cell activation | 0.02902552 | HFE | 1 |
| GO:0019883 | Antigen processing and presentation of endogenous antigen | 0.033310337 | HFE | 1 |
| GO:0002719 | Negative regulation of cytokine production involved in immune response | 0.03473465 | HFE | 1 |
| GO:0002724 | Regulation of T cell cytokine production | 0.04605826 | HFE | 1 |
| GO:0046636 | Negative regulation of alpha-beta T cell activation | 0.04605826 | HFE | 1 |
| GO:0002701 | Negative regulation of production of molecular mediator of immune response | 0.048869562 | HFE | 1 |
| hsa03410 | Base excision repair | 0.01619996 | POLE4 | 1 |
| hsa03030 | DNA replication | 0.017662859 | POLE4 | 1 |
| hsa03420 | Nucleotide excision repair | 0.02301287 | POLE4 | 1 |
Table 3: The enriched GO terms (biological process ontology) in the hub genes (p value <0.01).
After KEGG analysis of the core genes, it can be found that the core genes have certain correlation with cell cycle, such as DNA replication, nucleotide excision and repair, etc. According to KEGG, it can be found that the gene IDS of basal excision repair, DNA replication and nucleotide excision repair are all POLE4, indicating that POLE4 pathway plays an important role in the regulation of cell cycle. But its specific function still needs further discussion.
By analysis of the blue module of differential gene, we found that MTBP, MAPK14, RBBP6 and PTPRC genes were up-regulated significantly, which suggest that four genes may be closely related to expression the genes of skeletal muscle after treated with pioglitazone. Studies have also shown that MTBP has at least 30,000 binding sites, most of which are located in regions related to transcriptional regulation, and these regions are also the preferred regions for replication initiation and these binding sites of MTBP are functionally important for DNA replication, and can provide an additional level of specificity. H3K4 methylation is involved in DNA replication [16] and with highly relevant to MTBP binding sites. In addition, MTBP knockout can promote apoptosis and inhibit clonogenesis, and when overexpressed, it enhances tumorigenicity in vitro and in vivo [17]. MAPK14 is mainly involved in the local inflammatory cascade of surrounding tissues [18], which was initially identified as activating tyrosine phosphorylated proteins in immune cells macrophages that play an important role in the induction of inflammatory cytokines [19]. Overexpression of this gene may cause abnormal activation of inflammatory cells in PCOS patients and thus affect the function of normal cells. RBBP6 up-regulation can lead to cell cycle arrest, which is a common feature of tumor [20]. Rna-interference (RNAi) -mediated RBBP6 knockout has been shown to reduce A549 cell proliferation and xenograft tumor growth, which may be a potential prognostic biomarker and therapeutic target for NON-small cell lung cancer [21]. RBBP6 also involved in the regulation of cell cycle, apoptosis and differentiation [20,22-24]. PTPRC (Protein Tyrosine Phosphatase Receptor Type C, also known as CD45) is an important regulator of T and B cell antigen receptor signaling [25]. PTPRC was not only correlated with T-cell and B cell antigen receptor signal transduction, but also highly correlated with TGFβ receptor 1 expression and TGFβ is the main pathway leading to the occurrence of PCOS. Can we further study PTPRC gene and find PTPR. It may indicate that there may be some changes in immune cells or immune markers during the treatment of PCOS patients with pioglitazone.
Current research evidence indicates that most of the changes in the expression genes in skeletal muscle of PCOS patients treated with pioglitazone are reflected in the effects on cell cycle and immune cells, no matter the analysis of core genes or differential genes. In other words, the therapeutic effect of pioglitazone on PCOS patients can be well reflected in skeletal muscle through related cell cycles and immune cells, but further studies are needed to investigate the cascade reaction of related cell cycles and immune cells in skeletal muscle of PCOS patients. Among them, HFE gene has the most obvious regulation effect on T-lymphocyte activity, which may be a potential gene target for the treatment of PCOS. This study is helpful to provide new research ideas for the follow-up study on the treatment idea or effect of pioglitazone and the treatment monitoring and prognosis of PCOS patients. However, there are still deficiencies in this study. We only conducted the study through the method of bio information analysis, and the role of some genes and the potential role of drugs still need to be further verified by experiments.
The research leading to these results received funding from (Provincial Scientific Research Training Program for college students (SRTP), China) under Grant Agreement No [S202010760017].
[Crossref] [Google Scholar] [PubMed].
[Crossref] [Google Scholar] [PubMed].
[Google Scholar] [PubMed].
[Crossref] [Google Scholar] [PubMed].
[Crossref] [Google Scholar] [PubMed].
[Crossref] [Google Scholar] [PubMed].
[Crossref] [Google Scholar] [PubMed].
[Crossref] [Google Scholar] [PubMed].
[Crossref] [Google Scholar] [PubMed].
[Crossref] [Google Scholar] [PubMed].
[Crossref] [Google Scholar] [PubMed].
[Crossref] [Google Scholar] [PubMed].
[Crossref] [Google Scholar] [PubMed].
[Crossref] [Google Scholar] [PubMed].
[Crossref] [Google Scholar] [PubMed].
[Google Scholar] [PubMed].
[Crossref] [Google Scholar] [PubMed].
[Crossref] [Google Scholar] [PubMed].
[Crossref] [Google Scholar] [PubMed].
[Crossref] [Google Scholar] [PubMed].
[Crossref] [Google Scholar] [PubMed].
[Crossref] [Google Scholar] [PubMed].
[Crossref] [Google Scholar] [PubMed].
[Crossref] [Google Scholar] [PubMed].
[Crossref] [Google Scholar] [PubMed].
Citation: Xu Q, Song YH, Chen YN, Wang BL, Du GQ, Li Y (2022) HFE Gene Regulation of T-Lymphocyte Activity Can be a Potential Target of PCOS. Immunotherapy (Los Angel). 8:206.
Received: 01-Nov-2022, Manuscript No. IMT-22-19910; Editor assigned: 03-Nov-2022, Pre QC No. IMT-22-19910 (PQ); Reviewed: 15-Nov-2022, QC No. IMT-22-19910; Revised: 22-Nov-2022, Manuscript No. IMT-22-19910 (R); Published: 02-Dec-2022 , DOI: 10.35248/2471-9552.22.08.206
Copyright: © 2022 Xu Q, et al. This is an open-access article distributed under the terms of the Creative Commons Attribution License, which permits unrestricted use, distribution, and reproduction in any medium, provided the original author and source are credited.