Journal of Geology & Geophysics
Open Access
ISSN: 2381-8719
ISSN: 2381-8719
Research Article - (2015) Volume 4, Issue 4
The qualitative and quantitative assessment of groundwater is obligatory pre-requisite for developing countries like India with rural based economy. It is essential to evolve a strategy for ecologically sustainable development of groundwater resources which can be done only through exploration of hydro-geological environment. In the present study, groundwater studies, with special emphasis on groundwater quality and its variation with season have been carried out for upland areas of Nellore district, situated on the East Coast of India. Groundwater quality data of samples collected during pre and post monsoon season in the year 2011 by State Groundwater Department, Nellore have been used for finding its suitability for drinking and agricultural purposes. The data pertaining to the following parameters / ions, viz., Hydrogen Concentration(pH), Total Dissolved Solids(TDS), Total Hardness(TH), Calcium(Ca2+), Magnesium(Mg2+), Chlorides(Cl), Sodium(Na+), Potassium(K+), and Sulphates(SO42+) has been analyzed. It has been observed that in post-monsoon period most of the water samples are found not suitable for drinking. For evaluation of water quality for irrigation, US Salinity Laboratory’s and Wilcox’s diagrams, and percent Sodium (Na+) are used. It is found that the majority of the groundwater samples are not good for irrigation in post-monsoon compared to that in pre-monsoon.
Keywords: Ground water quality; Seasonal variation; TDS; TH; Ca; Mg; Cl; Na; K; SO4
Ground water is an important natural source of water supply all over the world. Its use in irrigation, industries and domestic usage continues to increase where perennial surface water source are absent [1]. The modern civilization, over exploitation, rapid industrialization and increased population has lead to fast degradation of our environment [2]. To meet the rising demand it is imperative to recognize the fresh water resources and also to find out remedial methods for improvement of water quality [3]. The quality of water may depend on geology of particular area and also vary with depth of water table and seasonal changes and is governed by the extent and composition of the dissolved salts depending upon source of the salt and soil, subsurface environment. Good drinking water quality is essential for the well-being of all people which has affected the health and economic status of the populations. Groundwater is the major source of water for drinking, agricultural and industrial desires. Groundwater quality with respect to season has been studied by collecting data seasonally from groundwater department, Nellore. The present study aims to assess groundwater quality and its suitability for drinking, agricultural and its seasonal variation.
Nellore district is one of the coastal districts of Andhra Pradesh. The study area lies between 13°30’ – 15°05’of North Latitude, 79°05’- 80°15’of East Longitude. Geographical area of the district is 13,076 sq. km and situated in the south-eastern part of the state. Nellore district is one of the coastal districts of Andhra Pradesh. The district is bounded by Bay of Bengal in the east with a coastline of 169 km and is divided into 46 revenue mandals. The Normal Rainfall of the District is 1080 mm. Agriculture is the mainstay of the population with 77.3 percent of population is being rural. The soils of the district are classified as red, black and sandy. The red soils are predominant with 40% of the area whereas black cotton soil and sandy loams occupy 23% and 34% of the area respectively. The principle crops grown in the study area are Paddy, Sugarcane and Groundnut, Bajra, Fruits & Vegetables, Chillies, Cotton and Tobacco.The district is dependent on ground water for irrigation and domestic needs. 60% of the irrigated area is through ground water.
The objectives of the present study were to:
(1) To study seasonal variation of ground water quality and its suitability in relation to drinking water quality standards
(2) To assess suitability of groundwater for irrigation purposes.
The methodology include, collection of monthly rainfall data, collection of periodic groundwater levels and collection of ground water samples from 20 wells in the pre-monsoon and post-monsoon period during the year 2011. The rainfall data collected for the year 2011 is shown in the Tables 1 and 2 shows the periodic groundwater levels collected (Figure 1).
| Month | Average rainfall (mm) |
|---|---|
| January | 8.34 |
| February | 28.107 |
| March | 0 |
| April | 25.718 |
| May | 11.424 |
| June | 61.578 |
| July | 57.462 |
| August | 130.108 |
| September | 60.045 |
| October | 250.916 |
| November | 329.527 |
| December | 56.621 |
Table 1: Average monthly rainfall distribution of Nellore (2011).
| Month | Jan | Feb | Mar | Apr | May | Jun | July | Aug | Sept | Oct | Nov | Dec |
| Average groundwater level(DTW)(m) | 3.18 | 3.94 | 5.35 | 6.22 | 6.68 | 3.7 |
Table 2: Details of average groundwater levels.

Figure 1: Comparison between Pre-monsoon and post-monsoon average chemical data.
Ground water analysis
The chemical quality data collected during Pre and Post-monsoon periods for 20 wells located in Anantha Sagaram, Chakali Konda, Depuru, Duthaluru, Gandipalem, Gonupalli, Jayampu, Kasumuru, Kodanda Ramapuram, Kovvurupalli, Mannarupoluru, Nandigunta, Tamidipadu, Poolathota, Rajavolu, Rapuru, Manubolu, Marlapudi, Udayagiri and Varikuntapadu villages of Nellore district for the following parameters/ ions, viz., Hydrogen ion concentration (pH), Electrical Conductivity (EC), Total dissolved solids (TDS) were computed by multiplying the EC by a factor (0.55 to 0.75), depending on relative concentrations of ions. Total hardness (TH) as CaCO3, Calcium (Ca2+), Magnesium (Mg2+), Sodium (Na+), Potassium (K+), Total Alkalinity (TA) as CaCO3, Carbonate (CO3 2-), Bicarbonate (HCO3), Chlorides (Cl-) and Sulphate (SO4). Table 3 shows the chemical data of 20 wells for Pre-monsoon and Post-monsoon respectively.
| Parameter | Season | |
|---|---|---|
| Pre monsoon | Post monsoon | |
| pH | 8.8 | 8.64 |
| TDS (Sp*0.64) | 1366 | 1384.3 |
| CO3 (mg/l) | 37.002 | 38.999 |
| HCO3( mg/l) | 301.003 | 280.5 |
| Chloride (mg/l) | 394.99 | 408.998 |
| Sulphates (So4) | 114.15 | 104.65 |
| Sodium (mg/l) | 263.95 | 306.3 |
| Potassium (mg/l) | 9.75 | 10.14 |
| Calcium (mg/l) | 50.001 | 44.39 |
| Magnesium (mg/l) | 93.54 | 91.3 |
| Total hardness ( CaCo3) | 519.9 | 452.6 |
Table 3: Average chemical quality data both for pre and post-monsoon
Quality criteria for drinking purpose
The following parameters are used to analyze water quality viz., pH, TDS, Total hardness, Calcium, Magnesium, Chlorides and Sulphates. The groundwater quality data on the following parameters/ions were presented and discussed below (Table 3).
Hydrogen ion concentration (pH): The pH of ground water in the study area ranges from 8 to 9.6. Maximum pH of more than 8 is encountered in localized pockets. According to the drinking water standards prescribed by ISI [4], WHO [5], ICMR [6] during pre-monsoon 14 samples are found to be safe i.e., under maximum permissible limits and remaining 6 are found to be above maximum permissible limits. In post monsoon all 20 samples are found to be safe.
Total dissolved solids (TDS): The simplest classification of water is based on the total concentration of dissolved solids [7]. Total Dissolved Solids in the study area ranges from 368 mg/l to 4417 mg/l in pre monsoon and post monsoon. The variation in TDS concentration with season is shown in the following Table 4.
| TDS (mg/l) |
No. of Samples | Type of water | |
|---|---|---|---|
| Pre monsoon | Post monsoon | ||
| <1000 | 12 | 10 | Fresh water |
| 1000 - 3000 | 7 | 9 | Brackish water |
| >3000 | 1 | 1 | Salty water |
Table 4: Water quality index scale for TDS.
Total hardness (TH): Total hardness in the study area ranges from 180 mg/l – 2205 mg/l. In pre monsoon 80% of the samples are very hard, 20% are hardy category. In post monsoon 50% of samples are hard water and 35% are very hard category. The general range in the study area is above 300 mg/l. TH values for the most samples in the study area are exceeds the maximum permissible limits (ISI and WHO standards). The variation in TH concentration with season is shown in the following Table 5.
| Total Hardness (mg/l) |
No. of samples | Water class | |
|---|---|---|---|
| Pre monsoon | Post monsoon | ||
| <75 | 0 | 0 | Soft |
| 75-150 | 0 | 0 | Moderate |
| 150-300 | 4 | 10 | hard water |
| >300 | 16 | 7 | very hard |
Table 5: Water quality index scale for TH.
Calcium (Ca): In most natural waters, Ca is a common and wide spread element. Ca is the most abundant cation in the ground water of the study area and its values range from 5-365 mg/l. Most of the area contains Ca in the range of 20-50 mg/l. Low concentration of less than 25 mg/l is observed mostly along the upland areas of Nellore and as isolated in the other parts. Maximum range of more than 100 mg/l occurs as localized patches confining to ‘kankar’ zones in the soil profile and some clay zones.
Magnesium (Mg): In the study area, Mg content is less than Ca it varies from 25- 390 mg/l. Most of the area shows less than 25 mg/l. Next range of 25-50 mg/l is located on the north western and central parts of the area covering all the formations. Maximum content of above 100 mg/l is recorded in clay and in some low lying areas. Magnesium values for the most of samples are within the maximum permissible limits (ISI and WHO Standards). High concentration of Mg may cause laxative effect particularly on new users. Mg deficiency is associated with structural and functional changes. It is essential as an activator of many enzyme systems (Figure 2).
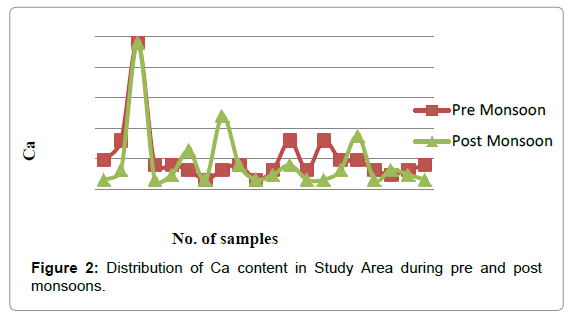
Figure 2: Distribution of Ca content in Study Area during pre and post monsoons.
Chlorides (Cl): Chlorides in study area range from 130 to 1700 mg/l. It is found that most of the samples are within the range of 150 to 400 mg/l. When compared to pre monsoon in post monsoon the Chloride content increases. The samples of Depuru, Kasumuru, Kovvurupalli, Manubolu, Nandigunta, Poolathota and Udayagiri villages are exceeding the maximum permissible limits during the both the monsoon periods (ISI and WHO standards); the maximum concentration of Chlorides with more than 500 mg/l is in isolated patches located in clay zones.
Sulphates (SO4): Sulphur is widely distributed in reduced form in both metamorphic and sedimentary rocks as metallic sulphides though it is not a major constituent of the earth’s outer crust. During weathering in contact with aerated water, the sulphides are oxidized to yield sulphate (SO4) ions which are carried off in the water [8]. Sulphate is generally less abundant than chloride in most of the natural waters. The same is observed in the ground water of the study area also. Generally, ground water contains SO4 at less than 100 mg/l in metamorphic or sedimentary aquifers [7]. Sulphate in the study area ranges from 25 to 420 mg/l. Most of the area shows less than 150 mg/l concentration in pre and post monsoon periods. Sulphate content in Depuru and Kasumuru villages exceeds the maximum permissible limits.
Sodium (Na) : The Na concentration in the ground water of the study area varies between 4.5 and 250 mg/l. Distribution of Na is similar to that of TDS (Figure 3). Most of the study area has the range of less than 50 mg/l. This range coincide with the low range of TDS, maximum range of more than 150 mg/l is located as small patches in the low lying areas and in the clay zones.
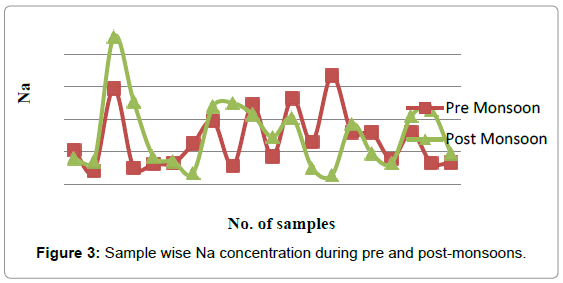
Figure 3: Sample wise Na concentration during pre and post-monsoons.
Potassium (K): The concentration of potassium in the groundwater of the study area varies from traces to 240 mg/l. In general, k content in the study area is much less than Na. Natural water in general, has much lower concentrations of k as compared with Na. During weathering, k ions tend to be either adsorbed or fixed in the soils or weathered products especially in the clay minerals. As a result, the concentration of k ions in natural waters is relatively less. As in the case of Na distribution, k also does not show any differential concentration.
Quality criteria for irrigation purpose
The suitability of groundwater for irrigation purposes depends upon the effect of mineral constituents of water on both plants and soils. The general criteria for assessing the irrigation water quality are: total salt concentration as measured by EC, relative proportions of Na+ as expressed by %Na, SAR, RSC. Water quality criteria can be used as guidelines by farmers for selecting appropriate management practice to overcome potential salinity hazard, if the quality of available water would pose any problem for irrigation. The following parameters were used to assess the groundwater suitability for agricultural purpose.
Percent Sodium (% Na): The Percent sodium (%Na+) is also widely utilized for evaluating the suitability of water quality for irrigation [9]. The %Na+ is computed with respect to relative proportions of cat ions present in water. Various ratios of Na to (Ca+ Mg) have been used to depict the suitability of water for irrigation. Na content is usually expressed in terms of % Na defined as
%Na = (Na++K+)*100/ (Ca2++Mg2++ Na++K+)
Where, all ionic concentrations are expressed in meq/l.
Most of the ground waters in the study area fall under good to permissible category. Very few wells come under the permissible to doubtful category. No sample fall under unsuitable ground water category according to this parameter.
Alkalinity: Alkali hazard or sodium content expressed as Sodium Adsorption Ratio (SAR) is another important chemical parameter for judging suitability of water for irrigation.
SAR is defined as
SAR=Na/√ (Ca+ Mg)/2
Where the concentration of the constitutions are expressed in meq/l
The entire area comes under excellent class. According to salinity diagram, most of the samples of groundwater in study area are good with moderate salinity and low Na.
Residual sodium carbonate (RSC): Eaton [10] evolved a criterion on the basis of residual sodium carbonate for agricultural purpose based on alkalinity and alkaline earths.
RSC = (CO32- + HCO3-) - (Ca2+ + Mg2+)
Concentrations of ions are expressed in meq/l.
According to Eaton [10], as soil alkalinity increases, plant growth diminishes. The water exceeding 2.5 meq/l of RSC, is not suitable for irrigation as it deteriorates the soil structure and air movement through soil is restricted [11]. RSC values in between 1.25 and 2.5 meq/l, are considered as marginal, RSC values less than 1.25 meq/l are said to be probably safe. Negative values of RSC are usually safe for irrigation. Ground water samples in the study area mostly possess negative values indicating predominance of alkaline earths over alkalinity. It is found that RSC values are < 1.25 meq/l in the major portion of study area and therefore it is safe.
The dominant cation and anion in the ground water of this area are Na+ and Cl-, sodium chloride is thus distributed in most parts of the aquifer. TDS levels in all the ground water samples collected during pre and post monsoon periods are exceeding drinking water standards of ISI
TDS levels in all groundwater samples in both seasons are above drinking water standards. The groundwater are exceed the maximum permissible as per ISI standards during pre- and post-monsoon seasons for the following parameters /ion, viz. TDS, TH, Na+, HCO3 -, Cl-, SO4 2-.
Ground water in the study area is alkaline in pre- and post-monsoon seasons non- carbonate alkali controlled by evaporation (Figure 4). The dominant cation and anion in the ground water of this area are Na+ and Cl-, sodium chloride is thus distributed in most parts of the aquifer.
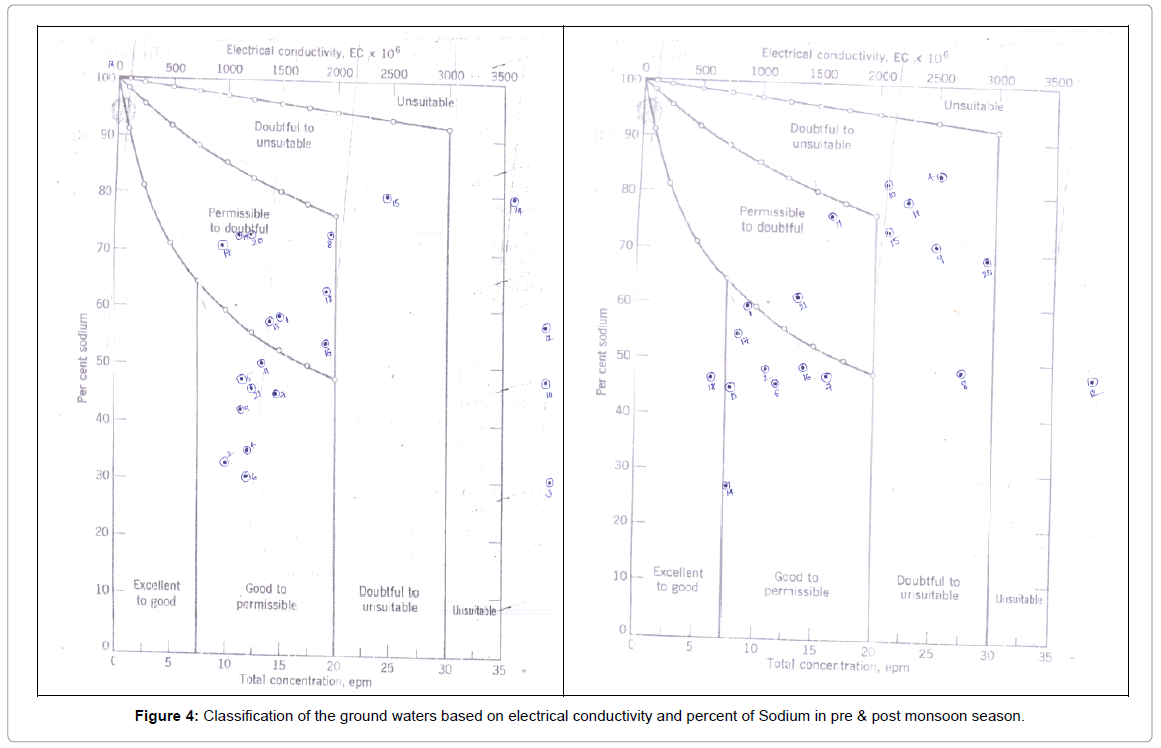
Figure 4: Classification of the ground waters based on electrical conductivity and percent of Sodium in pre & post monsoon season.