Journal of Geology & Geophysics
Open Access
ISSN: 2381-8719
ISSN: 2381-8719
Research Article - (2013) Volume 2, Issue 3
Fast growing population of Alakuta-Awotan area of Ibadan has warranted the need to develop the water availability in the area. The area lies within the basement complex terrain of southwestern Nigeria typified by banded gneiss and minor intrusion of pegmatite and quartz vein. This study was carried out to characterize the aquifer units and anisotropic properties of fractures for evaluation of groundwater development in the area. Hydro-geologic investigation was carried out on forty-five wells to study the groundwater system and dynamics in shallow aquifers. This study was integrated with twenty-two Schlumberger vertical electrical soundings to further investigate the different subsurface geo-materials with the aim of delineating the thickness and continuity of the aquiferous zone. Six radial soundings were conducted to study the directional properties of the anisotropic rock and thus indicate the orientation of fractures and extent of the fracturing. Measured static water level and well head varied from 0.8 to 9.9 m and 182 m to 209 m respectively indicating that groundwater generally flow towards the eastern and southwestern parts from two main discharge sites in the northwestern part of the study area. Interpretation of the twenty-two Schlumberger vertical electrical soundings generally shows three layered earth structure notably top soil, saturated/sandy/lateritic clay and weathered/fractured/fresh basement which are mostly of the “H” curve type. Overburden isopach map revealed that the depth to the bedrock varies from 3 to 23 m. The main aquifer (weathered basement) is relatively shallow and most wells in the study area terminate in the second layer. The main water - bearing unit in the area of study is the weathered basement and the fractured basement which are within the second and third geoelectrical layers respectively. The weathered/fractured basement resistivity values vary from 62 Ohm-m and 9807 Ohm-m with thickness values ranging from 2.2 m to 36 m. Polygons produced from six radial sounding showed the predominant structural trends of fractures on the banded gneiss. The radial resistivity survey results show that there is significant anisotropy between 0 - 50 m depth generally striking NE-SW, NW-SE and N-S showing the major structural trend of basement fractures. Coefficient of Resistivity Anisotropy ranges between 1.03 and 1.38. Variation of apparent resistivity is strongest at the eastern and southern parts of the study area with coefficients of 1.33, 1.38, and 1.30. This relatively high coefficient of anisotropy implies higher- permeability anisotropy. The directionality of the trends could be responsible for the depressions in the weathered/ fractured basement. The regions with thick weathered/fractured basement/depressed zones are likely to be most promising sites for borehole drilling.
Keywords: Alakuta-Awotan, Groundwater exploration, Geo-electric properties, Coefficient of anisotropy, Prospect areas
Groundwater exploration in crystalline basement complex terrain requires detailed geophysical investigation to effectively characterize the hydro-geologic zones to enhance successful identification of well locations. These zones are largely due to the development of secondary porosity and permeability by fracturing and/or weathering of these rocks. Thus, the search for groundwater in such rocks is aimed at mapping such secondary structures which constitute the basement aquifers.
Alakuta-Awotan area of Ibadan is undoubtedly undergoing rapid development due to increased population and expansion of residential sites. This has demanded for improved basic amenities especially potable water supply for domestic use. Existing hand dug wells in the area are only productive in the raining season but are at least low yielding during the dry season. Recent growth in student and staff population of the Ibadan Polytechnic has imposed significant stress on the existing inadequate water supply scheme, based solely on groundwater abstraction from boreholes around the campus. Consequently, it became very expedient to expand the existing water scheme. The focus was to delineate the area into hydrogeologic zones in order to increase the number of effective boreholes in the area.
Several researchers have worked on the groundwater development of southwestern Nigeria. Olorunfemi [1], Olayinka and Olorunfemi [2], and Olorunfemi et al. [3] concluded that occurrence of groundwater in southwestern Nigeria is primarily related to geology and its availability underscored by deep weathering and fracturing. From their studies, it was commonly observed that the unit with low resistivity value representing clayey sand and weathered bedrock, which may be fractured, constituted the main aquifer materials in the area. Also, regolith and fractured bedrock generally occurred in a typical basement terrain [4]. Azimuthal Resistivity Sounding (ARS) has been adopted as a fast and effective surface method for determining the principal directions of the electrical anisotropy that are directly related to structural or lateral lithological changes in the subsurface [5-12]. Odoh and Onwuemesi [13] estimated the anisotropy properties of fractures in Presco Campus of Ebonyi State University Abakaliki Nigeria using Azimuth resistivity survey method. This research was carried out to improve groundwater availability so as to balance the increased population and thus with the objective of evaluating the groundwater potential of the area by mapping the subsurface aquifers, delineating region that are likely to be high yielding and best region for borehole drilling. Integrated Vertical Electrical and Radial Soundings with well data analysis were adopted to achieve the said objective.
Site description and geological setting
The study area, Alakuta-Awotan, is located between latitudes 7° 26’ 10’ and 7° 26’ 30’’N and longitudes 3° 51’ 20’’ and 3° 51’50”E in Idolocal government area of Ibadan (Figure 1) covering an area extent of about 835m by 1025m. It can be accessed through a major road from Sango to Apete residential areas and drained by Eleyele river and its tributaries. The river occupies the southwestern and southeastern parts of the study area. Geology of Ibadan and environs, including Alakuta area, falls within the Pre-Cambrian rocks of Southwestern Nigeria. The major rock types are schist-quartzites, granite-gneiss, banded gneiss, augen-gneiss, and migmatites [14], while minor rock types such as pegmatite, aplites, quartz veins, and dolerite dykes intruded the main rocks in places (Figure 2). Gneisses are migmatized in places and are characterized by predominantly medium-sized grains while schistquartzites occur as elongated ridges striking NW-SE [3]. The study area is typified by banded and migmatite gneisses which generally strike NW-SE and dip to the east (Figure 2). The joints on the outcrops in the area are mostly oriented perpendicular to the strike (NW-SE) of the rock foliation. Notable N-S and NW-SE plunging minor folds were mapped on the gneiss complex.
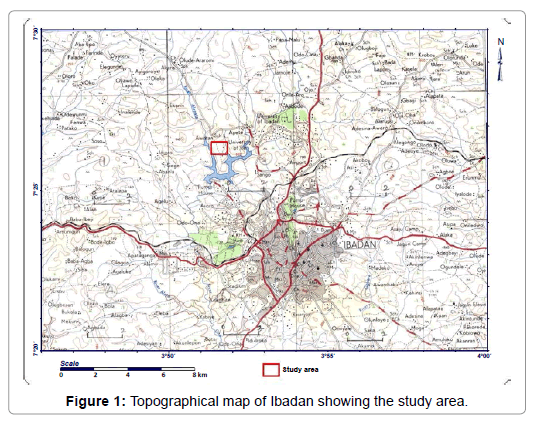
Figure 1: Topographical map of Ibadan showing the study area.
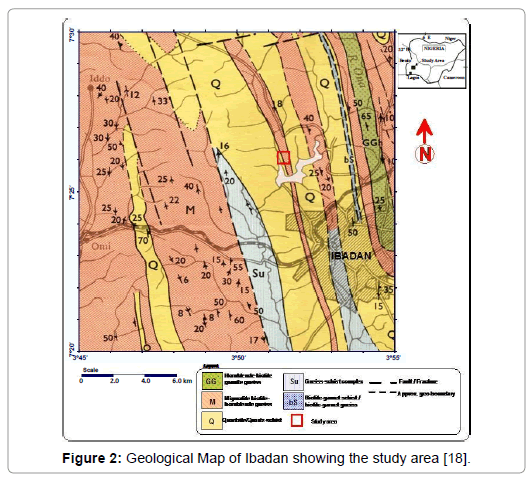
Figure 2: Geological Map of Ibadan showing the study area [18].
Depths to water level, total depth and in some cases depth to visible basement (weathered or fresh) were measured in forty-five wells to give information on the groundwater flow dynamics of the study area. Well positions and their respective elevation relative to the main sea level were determined using Garmin Global Positioning System (GPS) (Ref). These helped in determining the hydraulic water head in wells and thus groundwater head elevation contour which gave information on the groundwater flow direction. Figure 3 shows the location of the wells in the study area. Electrical resistivity of the subsurface involved determination of the distribution of ground resistivity based on its response to the flow of electric current injected during surface measurement. Apparent resistivity of subsurface layer are calculated by measuring the potential difference generated to Schlumberger electrode configuration from the true resistivity ρa which is given by ρa = ΔV/I. K, where K is the geometric factor. Geopulse Tigre Resistivity meter (Model number 006) was used for the resistivity data acquisition.
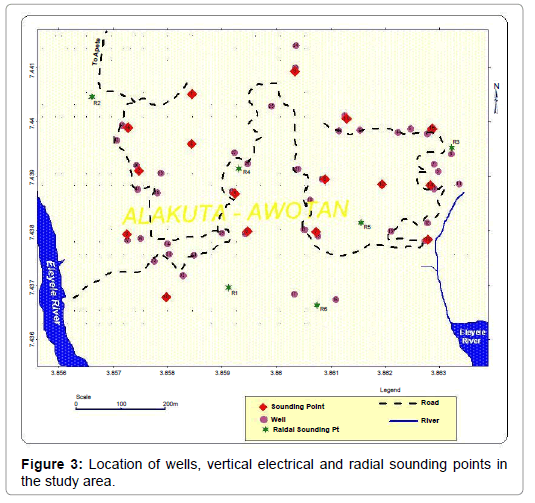
Figure 3: Location of wells, vertical electrical and radial sounding points in the study area.
Rocks have varying physical properties giving various anisotropies (electrical, magnetic, gravity etc) depending on the rock type, structure, mineral assemblages, fluid content, porosity etc. Electrical resistivity of rock varies in space giving the rock its characteristic electrical anisotropy. A rock is said to be electrically anisotropic if the value of a vector measurement of its resistivity varies with direction [6,15]. This anisotropy may result from rock fracturing, joints and fault systems, rock boundary and aligned mineral grain orientations which are common features of the rocks in the study area. Thus the rocks in the area are expected to exhibit some degrees of electrical anisotropy.
Twenty-two Vertical Electrical Soundings (VES) were carried out to generate geoelectrical parameters of the different subsurface layers which helped to delineate the aquiferous zones in the subsurface. Selection of the sounding locations was guided by well locations and this also serves as controls for the interpretation of the geophysical data and to proffer reasons for some seasonal wells (Figure 3). These soundings were conducted using Schlumberger configuration with current electrode spread ranging from 1m to 100m. The field data were plotted on bi-log paper and partial curve matched using standard two layered master curve to obtain some geoelectrical parameters such as layer thickness and layer resistivity and this was latter iterated using RESIST software inversion model [16].
Six Radial Vertical Electrical Sounding were conducted using maximum current electrode spacing (AB/2) of 42m to locate, characterize, and identify the directional properties of anisotropic rock mass in the study area. Their respective locations are shown in Figure 3 The electrode positions were rotated in increments of 45 degree about a central fixed point. The apparent resistivity (measured in Ohm-m) was recorded for all electrodes spacing and plotted along the azimuth on a polar diagram so as to observe the correlation between the measured structural direction and the plotted anisotropy polygon direction. In this resistivity survey, any observed change in apparent resistivity ρa was interpreted as an indication of fracture anisotropy and thus the orientations of the subsurface fractures. Fracture strikes were identified as the direction of maximum apparent resistivity’s on the polar plots.
In any formation whose anisotropy is due to the presence of fractures, the apparent resistivity (ρt) measured normal to its strike direction is greater than apparent resistivity (ρs) measured along the strike direction, when Schlumberger or Werner array is used but contrary when crossed square array method is employed [10]. Coefficient of anisotropy is calculated by γ=√(ρt/ρs).
Homogeneity of the subsurface has been related to the shape of the polygon, an isotropic homogeneous formation assumes a circular polygon shape indicative of isotropic nature of the formation. The direction of the polygon corresponds to the strike direction of the fracture and the ratio of the long to short axis is an indication of the presence of fractures in the area if high, and otherwise if low [7].
Hydro-geological investigation results
Depth to the static water level within the area varies from 0.8 m to 9.9 m, whereas the water head ranges from 184 m (in the northwestern) to 208 m (in the southeastern) above sea level (Table 1). Figure 4 is the water head contour map of the study area which shows various directions of groundwater flow. Higher elevation at the northwestern part of the study area indicates that groundwater generally flows toward the eastern and southwestern parts. However, two discharge sites (D1and D2) and one recharge site (R1) were established in the flow map existing at the western and eastern parts respectively.
| WELL NUMBER | LATITUDE | LONGITUDE | ELEVATION (m) | WATER TABLE(m) | TOTAL DEPTH OF WELL(m) |
| 1 | 70 26I22.8II | 3051I 40.6II | 206 | 5.71 | 6.77 |
| 2 | 7026I 21.8II | 30 51I 40.1II | 201 | 6.1 | . |
| 3 | 7026I 21.9II | 30 51I 41.4II | 199 | 5.55 | 11.7 |
| 4 | 7026I 21.7II | 30 51I 43.9II | 195 | 4.8 | 9 |
| 5 | 7026 22.0II | 30 51I 44.8II | 193 | 4.17 | 5.8 |
| 6 | 7026I 22.5II | 30 51I 45.9II | 192 | 2.8 | 5.53 |
| 7 | 7026I 21.9II | 30 51I 46.4II | 191 | 3.25 | 4.17 |
| 8 | 7026I 19.9II | 30 51I 47.4II | 190 | 3.25 | 5.42 |
| 9 | 7026I 18.4II | 30 51I 46.6II | 191 | 3.2 | 5.02 |
| 10 | 7026I 16.9II | 30 51I 46.7II | 189 | 4.11 | 5.01 |
| 11 | 7026I 17.3II | 30 51I 48.0II | 186 | 2.32 | 3.12 |
| 12 | 7026I 14.1II | 30 51I 45.9II | 188 | 3.07 | 4.4 |
| 13 | 7026I 13.5II | 30 51I 43.5II | 189 | DRY WELL | 9 |
| 14 | 7026I 12.6II | 30 51I 45.8II | 188 | 4.2 | 5.22 |
| 15 | 7026I 12.1II | 30 51I 44.7II | 190 | DRY WELL | 3.44 |
| 16 | 7026I 07.8II | 30 51I 39.8II | 197 | 4.53 | 5.96 |
| 17 | 7026I 08.1II | 30 51I 37.1II | 198 | 1.6 | 5.2 |
| 18 | 7026I 13.3II | 30 51I 38.5II | 201 | 5.3 | 6.2 |
Table 1: Some of the well data of the study area.
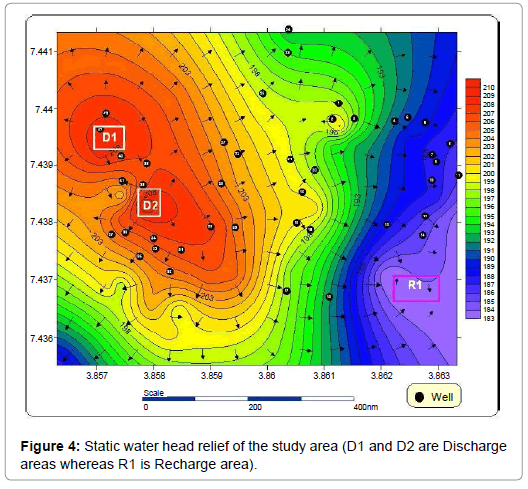
Figure 4: Static water head relief of the study area (D1 and D2 are Discharge areas whereas R1 is Recharge area).
Vertical electrical sounding result
Interpretation of the VES data generally indicates three to four layered earth structure as summarized in Table 2. Figure 5 shows representative resistivity curves type for H, K and HA for VES 11, 12 and 10. In accordance with available geological information and the layer models obtained from inversion of VES data, geoelectrical sections were constructed across four profiles (Figures 6a-6d). The cross-section revealed a general three to four layered subsurface medium.
| VES NO | RESISTIVITY (Ωm) | THICKNESS (m) | DEPTH (m) | PROBABLE LITHOLOGY | CURVE TYPE |
| 1 | 173 | 1.1 | 1.1 | Top soil | H |
| 55 | 6.5 | 7.6 | Weathered Basement (Clayey) | ||
| 570 | - | Z | Fractured Basement | ||
| 2 | 296 | 0.9 | 0.9 | Top soil | H |
| 74 | 3.7 | 4.6 | Weathered Basement (Clayey) | ||
| 1308 | - | - | Fresh Basement | ||
| 3 | 166 | 1.2 | 1.2 | Top soil | H |
| 26 | 1 | 2.2 | Weathered Basement (saturated Clay) | ||
| 863 | - | Fresh Basement | |||
| 4 | 115 | 0.5 | 0.5 | Top soil | A |
| 219 | 10.8 | 11.3 | Lateritic clay | ||
| 312 | - | - | Weathered Basement | ||
| 5 | 1160 | 0.2 | 0.2 | Top soil | H |
| 78 | 3.3 | 3.5 | Weathered Basement (Clayey) | ||
| 491 | - | - | Fractured Basement | ||
| 6 | 143 | 0.8 | 0.8 | Top soil | |
| 425 | 1.6 | 2.4 | Compacted lateritic clay | ||
| 160 | 3.8 | 6.2 | Weathered basement (clayey sand) | ||
| 393 | - | - | Fractured Basement | ||
| 7 | 207 | 0.7 | 0.7 | Top soil | KH |
| 399 | 4.7 | 5.4 | Compacted lateritic clay | ||
| 45 | 17.2 | 22.6 | Weathered Basement (Saturated Clay) | ||
| 446 | Fractured Basement | ||||
| 8 | 78 | 1.2 | 1.2 | Top soil | K |
| 154 | 6.6 | 7.9 | Clayey sand | ||
| 62 | - | - | Highly weathered basement | ||
| 9 | 304 | 0.9 | 0.9 | Top soil | H |
| 114 | 22.6 | 23.5 | Weathered Basement (clayey sand) | ||
| 272 | - | - | Fractured Basement | ||
| 10 | 252 | 0.6 | 0.6 | Top soil | |
| 95 | 3.1 | 3.7 | Clayey soil | ||
| 175 | 13.7 | 17.4 | Weathered Basement (clayey sand) | ||
| 9807 | - | Fresh Basement | |||
| 11 | 59 | 2.1 | 2.1 | Top soil | K |
| 224 | 6.6 | 8.7 | Lateritic clay | ||
| 140 | - | - | Weathered Basement (clayey sand) | ||
| 12 | 132 | 0.5 | 0.5 | Top soil | H |
| 81 | 23.6 | 24.1 | Sandy clay | ||
| 18 | - | - | Highly Weathered Basement | ||
| 13 | 107 | 0.7 | Top soil | H | |
| 79 | 13.8 | 14.5 | Weathered basement (clayey) | ||
| 365 | - | - | Fractured Basement | ||
| 14 | 211 | 0.9 | 0.9 | Top soil | H |
| 45 | 3.9 | 4.7 | Weathered Basement(Saturated Clay) | ||
| 137 | - | - | Fractured Basement | ||
| 15 | 98 | 2.3 | 2.3 | Top soil | H |
| 18 | 2.5 | 4.8 | Weathered Basement (Saturated Clay) | ||
| 175 | - | - | Fractured Basement | ||
| 16 | 337 | 0.4 | 0.4 | Top soil | H |
| 65 | 1.8 | 2.2 | Weathered Basement (Clayey) | ||
| 2590 | - | Fresh basement | |||
| 17 | 272 | 2.9 | 2.9 | Top soil | H |
| 13 | 4.9 | 7.9 | Weathered Basement (Saturated clay) | ||
| 121 | - | - | Fractured Basement | ||
| 18 | 439 | 0.9 | 0.9 | Top soil | H |
| 53 | 3.2 | 4.1 | Weathered Basement (Clayey) | ||
| 2576 | - | - | Fresh Basement | ||
| 19 | 141 | 2.3 | 2.3 | Top soil | H |
| 53 | 5.7 | 8 | Weathered Basement (Clayey) | ||
| 127 | - | - | Fractured Basement | ||
| 20 | 319 | 0.5 | 0.5 | Top soil | H |
| 127 | 1.5 | 2 | Weathered basement (clayey sand) | ||
| 303 | Fractured Basement | ||||
| 21 | 497 | 0.8 | 0.8 | Top soil | H |
| 126 | 11.7 | 12.4 | Sandy Clay | ||
| 377 | - | - | Weathered Basement | ||
| 22 | 182 | 1 | 1 | Top soil | K |
| 248 | 8 | 9 | Lateritic clay | ||
| 161 | - | - | Weathered basement (clayey sand) |
Table 2: Summary of VES interpretation in Alakuta - Awotan area.
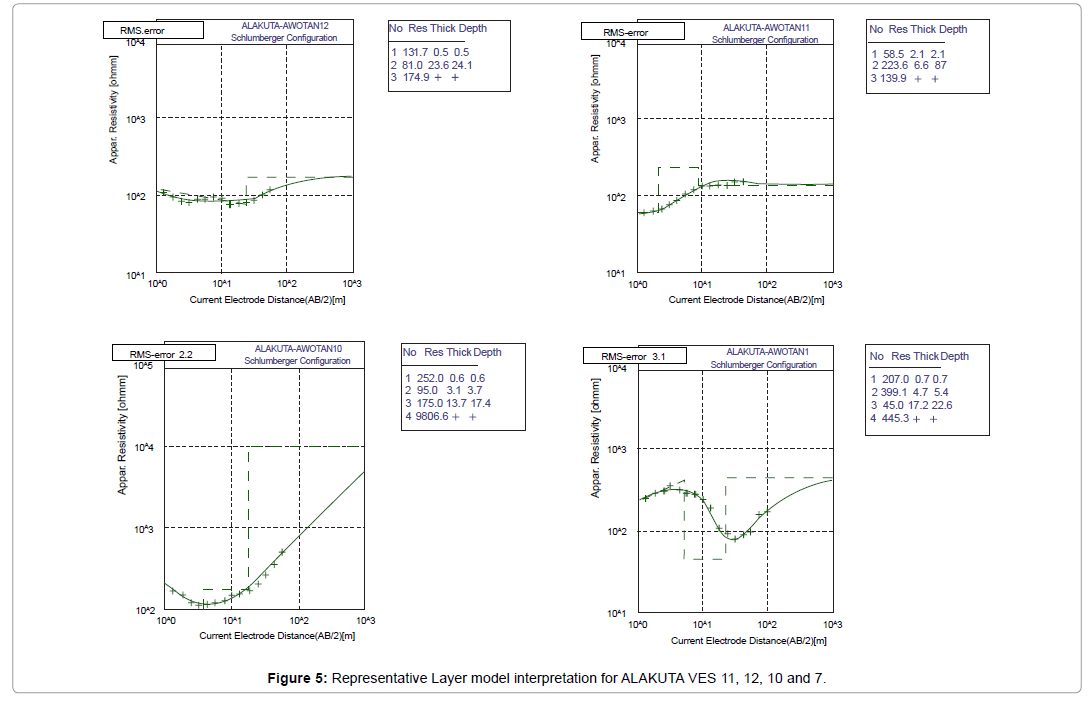
Figure 5: Representative Layer model interpretation for ALAKUTA VES 11, 12, 10 and 7.
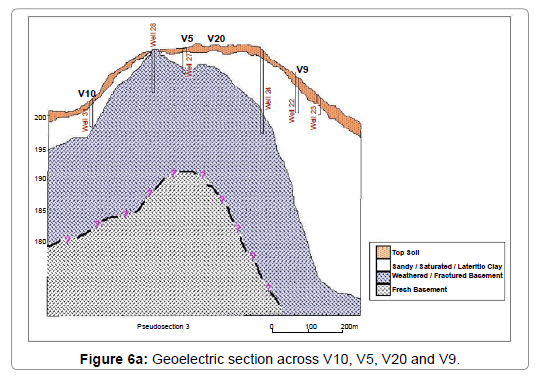
Figure 6a: Geoelectric section across V10, V5, V20 and V9.
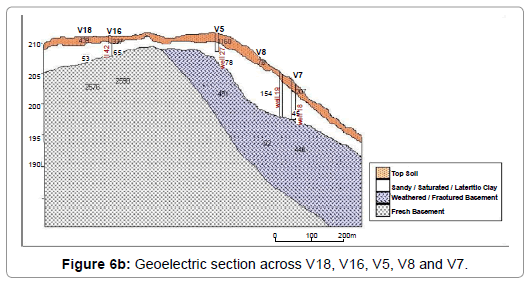
Figure 6b: Geoelectric section across V18, V16, V5, V8 and V7.
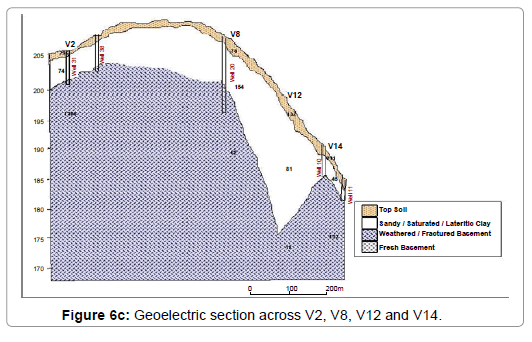
Figure 6c: Geoelectric section across V2, V8, V12 and V14.
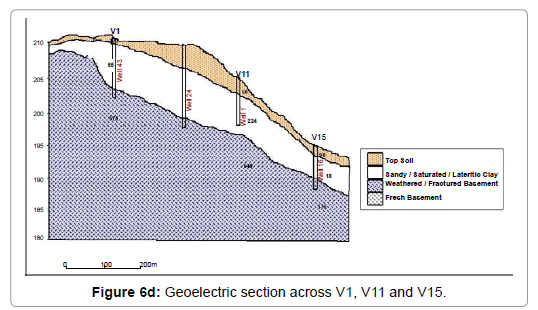
Figure 6d: Geoelectric section across V1, V11 and V15.
The first, uppermost, geoelectrical layer is relatively thin (0.5-2.9 m) and exhibits a wide range of resistivity values (59-1160 Ohm-m) reflecting the effect of surface conditions. The second layer was recognized as being continuous beneath all stations along most profiles. It exhibits moderate low resistivity values ranging from 13 to 425 Ohm-m with thickness values ranging from 1.0 to 26.3 m. This layer is composed mainly of weathered layer. However; low resistivity in this layer may be due to the presence of clay. Most wells in the study area terminates in this layer thus are capable of producing water for domestic usage. The third layer represents the main hydro-geologic target for borehole siting with resistivity values (172-9807 Ohm-m). This layer was inferred to be fractured and/or fresh basement.
From the geoelectrical sections and wells position along the profiles, it can be concluded that most wells terminate in the second layer or on top of the third layer. However, well 28 in Figure 6a was cited on migmatite gneiss outcrop which was severally blasted until adequate potable groundwater was intersected. This thus indicates that the rock is sufficiently fractured.
Isopach map of the overburden
Figure 7 shows overburden thickness contoured map of the study area. The overburden thickness ranges from 0.4m to 24.1m with region of relatively thick overburden at the northern and southeastern part around V12, V7, V9, V13 whereas it is shallow towards the west around V2, V3, V5, V10, and V16.
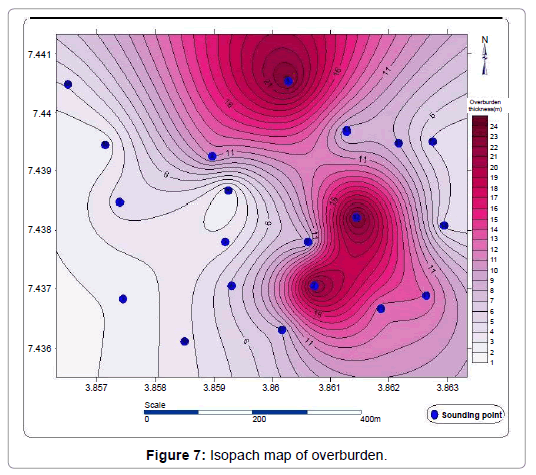
Figure 7: Isopach map of overburden.
Radial vertical electrical sounding
A consistent increase in the apparent anisotropy coefficient was observed for AB/2 spacing greater than 10 m and this behavior of increase in resistivity with depth may be due to the presence of the fracture effect at the corresponding true depths. Figure 8 a,b shows the polar plots for the variation of ρa data at four azimuths (0°, 45°, 90°, 135°) at various depths corresponding to the fractured basement at the six radial sounding locations. The observed changes in the apparent resistivity were interpreted as an indicator of fracture anisotropy. The fracture strikes at different depths are indicated as the polar plot trends. The survey identified three main fracture systems in the underlying basement rocks generally trending NE-SW, NW- SE and N-S of which NE-SW is the most prominent trend in Awotan area. NE-SW trends are dominant at locations 1, 3 and 5 whereas NW- SE is prominent at locations 4 and 6 and N-S at location 2 (Figure 9). These trends are consistent with dominant orientation of structures on rock exposures within the study area and with the major fracture trend in Ibadan area as seen in the geological map (Figure 2). The plot of coefficient of apparent anisotropy against electrode spacing (Figures 8a, 8b) shows the change in anisotropy coefficient with depth indicating relatively high values at spacing of 25 to 32m.
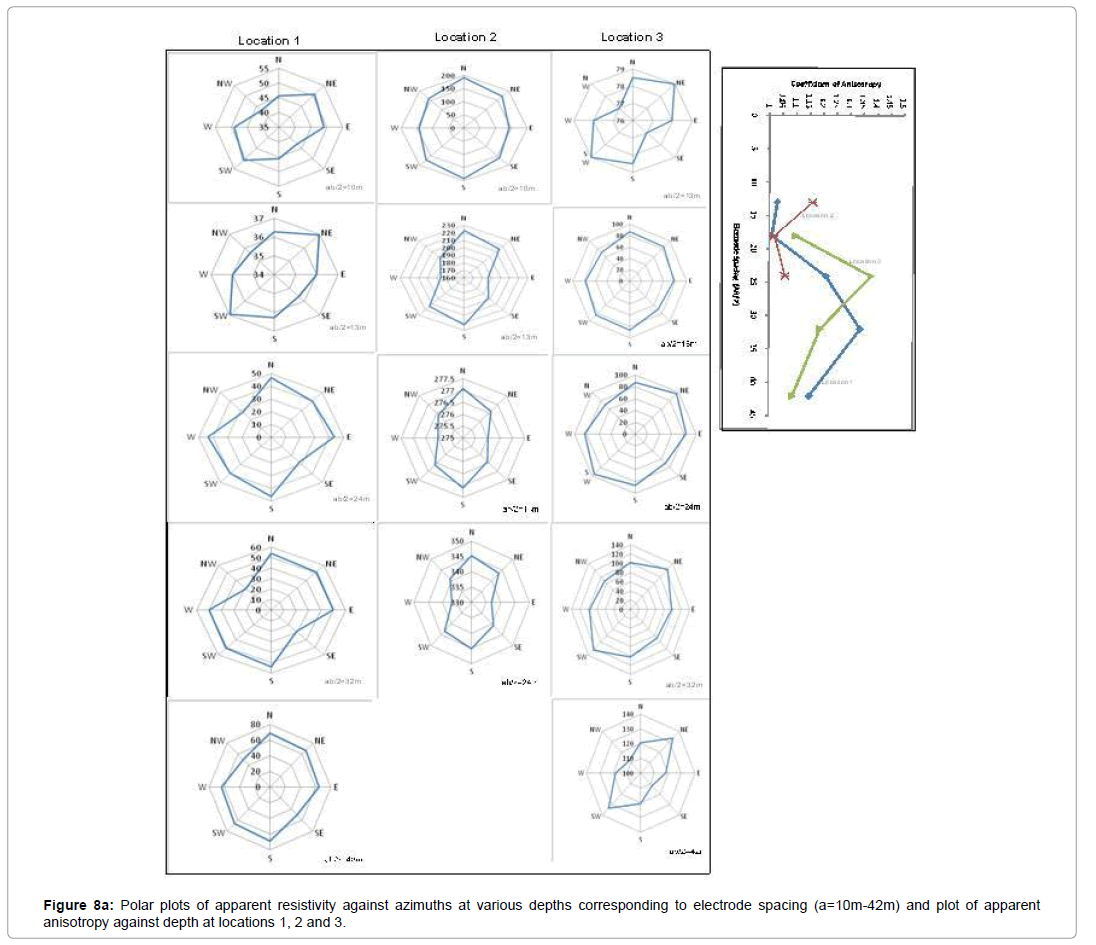
Figure 8a: Polar plots of apparent resistivity against azimuths at various depths corresponding to electrode spacing (a=10m-42m) and plot of apparent anisotropy against depth at locations 1, 2 and 3.
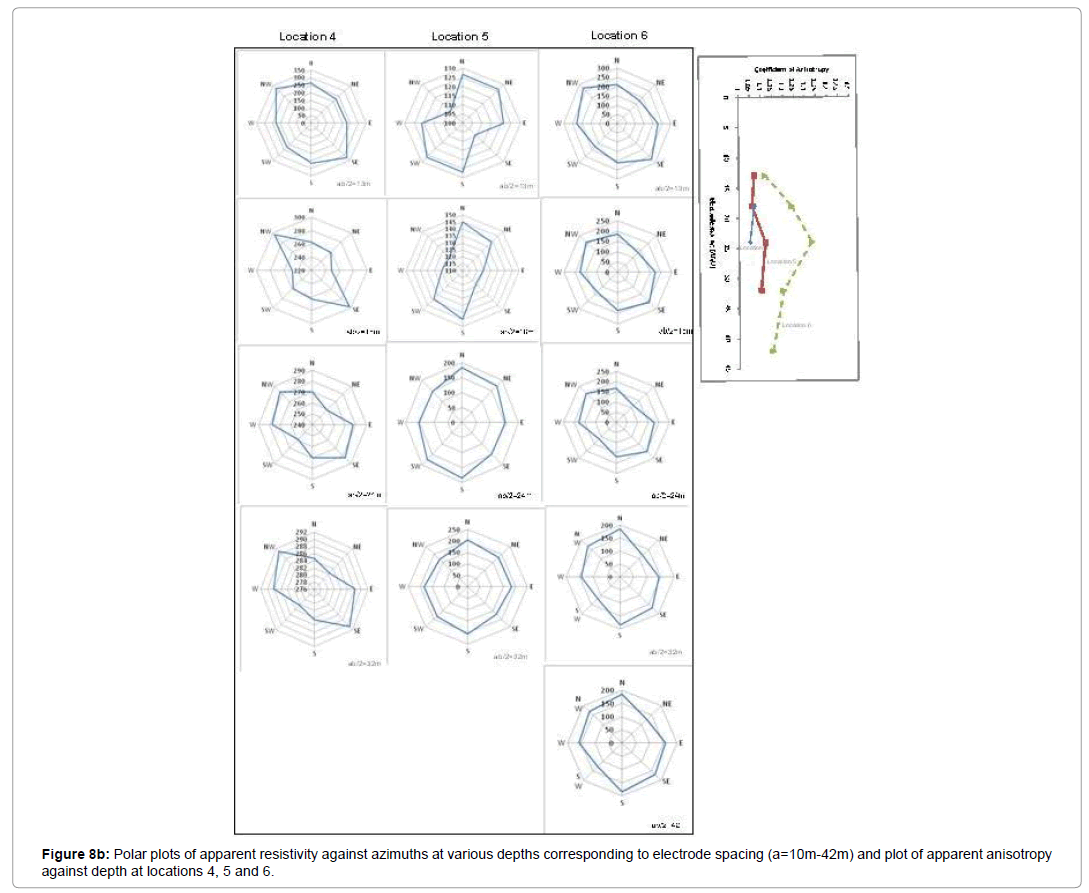
Figure 8b: Polar plots of apparent resistivity against azimuths at various depths corresponding to electrode spacing (a=10m-42m) and plot of apparent anisotropy against depth at locations 4, 5 and 6.
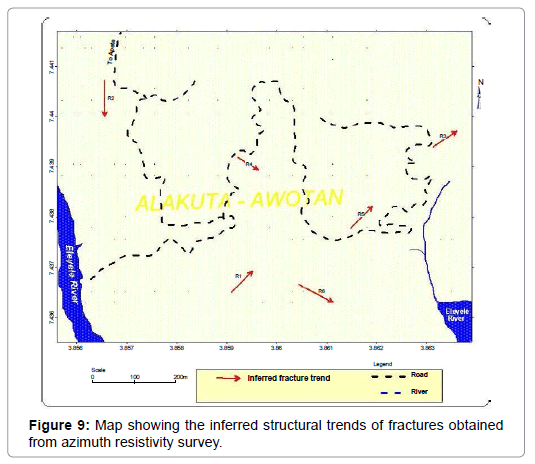
Figure 9: Map showing the inferred structural trends of fractures obtained from azimuth resistivity survey.
At each measurement site, the resistivity data were used to estimate the characteristic fracture parameters, the fracture strike, the coefficient of anisotropy and the mean resistivity. These parameters are reported in Table 3.
| Location | Electrode spacing (m) | Inferred fracture strike direction | Coefficient of Anisotropy, λ |
| 1 | 13 | NE-SW | 1.03 |
| 18 | NE-SW | 1.01 | |
| 24 | NE-SW | 1.21 | |
| 32 | NE-SW | 1.34 | |
| 42 | NE-SW | 1.15 | |
| 2 | 13 | N-S | 1.16 |
| 18 | N-S | 1.02 | |
| 24 | N-S | 1.06 | |
| 3 | 18 | NE-SW | 1.1 |
| 24 | NE-SW | 1.38 | |
| 32 | NE-SW | 1.19 | |
| 42 | NE-SW | 1.09 | |
| 4 | 18 | NW-SE | 1.07 |
| 24 | NW-SE | 1.05 | |
| 5 | 13 | NE-SW | 1.07 |
| 18 | NE-SW | 1.06 | |
| 24 | NE-SW | 1.12 | |
| 32 | NE-SW | 1.1 | |
| 6 | 13 | NE-SW | 1.12 |
| 18 | NE-SW | 1.24 | |
| 24 | NE-SW | 1.33 | |
| 32 | NE-SW | 1.2 | |
| 42 | NE-SW | 1.15 |
Table 3: Characteristic fracture parameters at each subarea obtained from analysis of azimuthal resistivity data obtained from the study area.
The coefficient of anisotropy (λ) has been shown to have the same functional form as permeability anisotropy to a first order [17]. Thus, a higher coefficient of anisotropy (λ) implies higher-permeability anisotropy. The values of λ ranges from a minimum of 1.01 at Location 1 to a maximum of 1.38 at Location 3 (Table 2). The relatively higher values of λ at L1, L3 and L6 (1.34, 1.38 and 1.33) indicates that the underlying rocks at these region are likely to be more intensely fractured and permeable. Whereas lower values of (1.02, 1.06) and (1.07, 1.05) obtained at L2 and L4 respectively suggest that underlying rocks may be less intensely fractured and permeable. These suggestions have obvious important implications in assessing groundwater transport and storage potential.
Groundwater head (relief) map prepared from static water level shows that groundwater generally flow to the east and southwestern part of the study area. The water head ranges from 184m in the NW to 208m in the southeast above sea level. Two discharge sites (D1 & D2) and one recharge site R1were established in the flow map existing at the western and eastern part respectively. Also, the groundwater flow patterns show that river Eleyele and its tributaries probably recharged via the subsurface; therefore, this area is the discharge area.
Vertical Electrical Sounding revealed three geologic units. These are: the top soil, the weathered layer and the partly weathered/ fractured/fresh basement unit. The isopach map of the overburden show that the depth to the bedrock varies from 3m to 23m. This shows that the main aquifer (weathered basement) is relatively close to the surface. The main water - bearing unit in the area of study is the weathered basement and the fractured basement which are within the second and third geoelectrical layers. The low resistivity (ranging from 62 to 863 Ohm - m) indicates presence of groundwater and the degree of weathering is very high. The weathered basement relief map delineates a series of ridges and depressions within the surveyed area. The depressions and the fractures zones (whose direction are delineated from the radial soundings) are the likely groundwater collecting centers and are priority areas for groundwater development.
The weathered/fractured basement is the main groundwater potential layer where the water is sourced in the study area and they have resistivity values that vary from 62 Ohm-m and 9807 Ohm-m with thickness values ranging from 2.2m to 36m (Table 1).
The hydro-geophysical investigation of ALAKUTA area has contributed to a better understanding of groundwater development in this part of the basement complex of southwestern Nigeria. Two aquiferous zones were delineated in the area. They are the weathered basement and fractured basement which occurred in almost all the locations. Basement depressions and/or fractured/sheared bedrock may likely contain more groundwater compared with areas where such structural features are absent, since water often accumulates in the fractured/jointed column of the bedrock.
Radial Vertical Electrical Sounding (RVES) and surface geological studies show that significant joints and fractures occur along NE - SW, NW - SE and N-S directions. These studies further indicate relatively high coefficient of anisotropy of 1.33, 1.30 and 1.38 at the eastern and southern part of the study area, which shows relatively high permeability anisotropy. These regions are good prospect for ground water exploration and therefore borehole are recommended to be drilled at selected locations to target the inferred fractured basement.
The technique has increased the rate of success for location of site for borehole drilling and consequently the cost effectiveness of groundwater exploration.