Journal of Geology & Geophysics
Open Access
ISSN: 2381-8719
ISSN: 2381-8719
Research - (2022)Volume 11, Issue 4
Rahat volcanic field is the longest and oldest Cenozoic volcanic field in the Kingdom of Saudi Arabia, located along the Red Sea coast. Three historical eruptions have occurred at the northern part of this volcanic field: The fissure eruption (641 AD), historical eruption (1256 AD), and unknown location eruption (AD 1293). Addition, the area is characterized by swarm area since 1999. Recently, the elevation of temperature in water wells around Rahat volcanic field indicates that there is a source of heat at a certain depth. Gravity and magnetic data were collected for various purposes, volcanic hazards, mineral exploration, and geothermal exploration. Also, few boreholes were drilled for exploration by the Ministry of Environment, Water, and Agriculture. These datasets are analyzed for the purpose of understanding the subsurface thermal structure where the main objective of this research is to locate the most probable geothermal resources causing the elevated water temperatures in the water wells. Results indicate that underneath the historical eruption and fissure eruption, toward west, there is a geothermal anomaly at depths of 3-4 km with an area of about 35 km2. This anomaly was mapped from density and susceptibility variations in rock samples, analysis of gravity and magnetic data, and the 3D inversion of gravity data. We recommend carrying out MT surveys to model the geothermal reservoir. In addition, the area is characterized by basin like structural system trending in northwest direction, parallel to the Red Sea trend.
Gravity; Magnetic; Rahat; Geothermal; 3D inversion
One of the renewable energy sources stored within the earth’s subsurface is geothermal energy [1]. This energy type is restored by the upwards flow of heat from the Earth’s interior. Heat reserves of the earth are enormous, with the earth’s geothermal energy estimated to 43 x 106 EJ at 3 km depths within continental crust, by the Electric Power Research Institute, USA. This surpasses the world’s total energy consumption, 560 EJ in 2012 [2].
Geothermal energy resources are abundant in the Kingdom Saudi Arabia, particularly, at the western region of the kingdom, along the Red Sea coast where the volcanic fields and hot springs are located. However, only few studies were conducted to evaluate these resources [3-6]. The Rahat and Khaybar volcanic fields have been recommended for geothermal potential (Figure 1). Furthermore, Aboud et al. [7], built the geothermal resources database for the kingdom of Saudi Arabia showing that the highest potential geothermal sites are located on the western regions along the direction of the Red Sea. In addition, Rehman et al. [8], and Rehman et al. [9], summarized the literature review of the geothermal resources and stated that the current geothermal features (e.g., hot springs or volcanic fields) were not used for any geothermal activity. Hussein et al. [10], and Lashin et al. [11,12], and Chandrasekharan et al. [13], studied the geothermal features within Saudi Arabia and concluded that the high enthalpy eruption sizes of these volcanoes’ present credible potentials for the development of geothermal power plants. Identified geological formations could host geothermal systems of up to 150˚C and 300˚C. However, there are some uncertainties in the potentials due to the absence of deep drilling. Accordingly, the geothermal resources in Saudi Arabia are adequate for usage on an economic scale.

Figure 1: a) Cenozoic volcanic fields in Saudi Arabia, b) Geologic map of Rahat volcanic field, and c) the northern part of RVF; Black polygon shows
the border of RVF, yellow filled triangles show the distribution of the volcanic cones, black filled circles are boreholes, SA=swarm area, HE=Historical
eruption, 5F=five fingers eruption, BA=building area, background is Shuttle Radar Topography Mission (SRTM). Note:  Cenozoic volcanic fields (Harrats);
  Study area in ‘a’ Makkah Madinah volcanic line;
  Outline of the Alfo-Arabian Swell Najd fault system;
  Cenozoic deposits;
  Madinah basalt;
  Hammah basalt;
  Shawahit basalt;
  Precambrian rocks;
  Axis of linear vent;
  Red sea fracture
Iceland has one of the highest based-geothermal energy resources where 65% of the energy supply is from geothermal resources and more than 90% of houses are heated with geothermal energy. It reflects the importance of geothermal energy as clean energy. For that reason, Saudi Geological Survey (SGS) invited some experts from Iceland to evaluate the geothermal resources in the kingdom (internal report, 2009). Icelandic team visited the surface geothermal manifestations (hot springs and volcanic fields). They concluded that the extent and volume of the volcanic system was very impressive and was very similar in settings as in “Reykjanes Peninsula”, Iceland. It should be mentioned that large Icelandic high temperature resources (e.g., in Svartsengi) had a weak fumarole on the surface. This phenomenon also existed in Saudi volcanic field [14]. From Icelandic experience, such a feature is best explained by steam leak from depth, coming out of a high- temperature resource (higher than 200˚C). Moreover, tens of volcanic vents are existed on the central part of the volcanic fields. In our view, such a setting indicates a volcanic center host very large high-temperature reservoir. We cannot resist thinking about the enormous water storage potential that may accompany such thick series of basaltic lavas. Such systems are common in Iceland and can produce water. Their water table is however often very deep and special drilling techniques are required to be commercialized.
Recently, during 2014-2017, King Abdulaziz University cooperated with the University of Auckland in a joint project called Volcanic Risks in Saudi Arabia, VORiSA. The VORiSA project comprises geological, geophysical, hazard and risk studies [15-18]. Moreover, Saudi Geological Survey (SGS) cooperated with United States Geological Survey (USGS) (2017-2020) by studying the northern part of Rahat volcanic field by geophysical, geological, and geohazards methods [19]. The current study considers and evaluates the above-mentioned geophysical data for geothermal exploration, attempting to understand the subsurface thermal structure of northern Rahat volcanic field.
Geophysical methods are generally used to image the subsurface, identify and evaluate the geothermal reservoirs. For example, gravity and magnetic methods are used to map permeable fractures and delineate subsurface valleys and volcanic during the early stages of geothermal development. These can reduce the number of proposed wells to be drilled for characterization and produced reliable interpretations.
In Rahat Volcanic Field (RVF), during SGS-USGS project, 300 gravity stations were collected [20], in an area of about 60 × 60 km, using CG5 gravimeter incorporated with Differential GPS (DGPS). In addition, during VORiSA project, around 295 gravity stations were collected in an area of about 20 × 20 km [16]. The capability of SGS, having aircraft enable record gravity stations in rough topography, over lava flows, on top of volcanic cones, and on basement rocks (eastern and western side of the RVF). Gravity data was reduced and corrected for interpretation. In addition, aeromagnetic surveys were collected more than 40 years ago (1962- 1983) by Arabian Geophysical and Surveying (ARGAS) company and supervised by BRGM (Bureau de Recherche Géologiques et Minières) and USGS. The data was available for the whole area of RVF and beyond [16,21].
During SGS-USGS joint project, more than 500 rock samples were collected for physical properties of rock (e.g., density and magnetic susceptibility). These data were used to estimate the surficial density and susceptibility maps. It should be stated that variation in density or susceptibility rock is associated with heat or thermal change. For example, magnetic materials lose its magnetization due to temperature at 570˚C, which is called Curie Depth point [16].
The aim of the present study is to evaluate the geothermal resources in RVF where the aeromagnetic, ground gravity, borehole, and rock sample data are available. Furthermore, the capabilities of these methods (gravity and magnetic) and their contribution in geothermal exploration are discussed.
Geologic setting
One of the Cenozoic lava fields in Saudi Arabia is the Rahat volcanic field which extends across the Arabian Peninsula (western regions), from Yemen (south) to Levant (North). These lava fields represent a manifestation of the magmatic activity of the Red Sea rifting during the last 30 million years [22-25]. Figure (2) show the general geological map of RVF. It constitutes a 50 km-wide plateau, which extends for almost 300 km from north to south between Al Madinah and Taif city. It also lies amid the coastal chain of Hijaz (west) and the high plains of Najd (east) [26,27]. It descends steadily northward from 1,200 meters near Taif to about 600 m at Al Madinah [26].

Figure 2: Geologic map of the northern part of Rahat volcanic field. Vent centers have black filled triangles. Note:  Volcanic cones;
  PE-precambrian basement rocks;
  Qal-Wadi alluvium (sand and gravel);
  Qm1-Olivine basalt, hawaiite and minor mugearite 1.7-1.2 Ma;
  Qm2-
Olivine basalt, hawaiite and minor mugearite 1.2-0.9 Ma;
Qm2-
Olivine basalt, hawaiite and minor mugearite 1.2-0.9 Ma;  Qm3- Olivine basalt, hawaiite and minor mugearite 0.9-0.6 Ma;
  Qm4- Olivine basalt,
hawaiite, mugearite, benmoreite and trachyte 0.6-03. Ma Qm5- Olivine basalt, hawaiite, mugearite, benmoreite and trachyte 0.3 Ma-4.5 Ka;
Qm4- Olivine basalt,
hawaiite, mugearite, benmoreite and trachyte 0.6-03. Ma Qm5- Olivine basalt, hawaiite, mugearite, benmoreite and trachyte 0.3 Ma-4.5 Ka;  Qm6-
Olivine basalt with minor hawaiite 4.5-1.5 Ka;
Qm6-
Olivine basalt with minor hawaiite 4.5-1.5 Ka;  Qm7- Olivine basalt with minor hawaiite 1.5 Ka;
  Qsb-Sabkhah deposits;
  Qu-Older wadi
deposits (fans, terraces and talus);
Qu-Older wadi
deposits (fans, terraces and talus);  Th-Olivine basalt and hawaiite flows, minor mugearite;
  Tu-Undifferentiated tertiary basalt;
  Tw2-deeply
reoded olivine basalt.
Tw2-deeply
reoded olivine basalt.
In terms of structural geology, the RVF trending in NW direction parallel to the Red Sea. The subsurface structure like graben system trending in NW [16]. It implies that during the rifting of the Red Sea, volcanoes were formed [28].
RVF attains an area of 20,000 km2 and a lava volume of 2,000 km3. It was evolved during the past 10 million years from basaltic eruptions that migrated to the north along northerly trending linear vent systems, in which the youngest flows are those of 11 “post-Neolithic” eruptions (<4,500 B.P.) and two historic eruptions in 641 and 1256 AD [23,24,29]. Thickness estimates of the RVF lava section south of latitude 24˚N, as determined from spectral analysis of magnetic profiles at 300 sites, range from 26 to 380 meters, averaging 150 m [30].
The closed proximity of the northern fringes of RVF (area of the 1256 AD eruption) to the holy city of Al Madinah Al Munawara makes RVF very significant [31]. The 52 days long eruption extruded 0.5 km3 of alkali-olivine basalt to form a 2.25 km long fissure, producing 7 scoria cones along with lava flow of about 23 km away from the eruption source and 8 km close to Al Madinah [24,28].
Scoria cones, lava flows, shield volcanoes, and lava domes are spread out on the landscape of the RVF [24,28,29]. In addition, basalttrachyte suite constitutes most of the volcanic rocks [24,28,29,32]. These basalts are mildly alkaline to transitional, whereas the trachytes are weakly to mildly peralkaline [32].
Stelten et al. [33], used the 40Ar/39Ar and 36Cl age dating techniques to estimate the historical eruption time. Four eruptive sequences reflect an organized and reiterated temporal progression for the youngest eruptive rocks (approximately 150 to 17 ka). The formation of these sequences has been ascribed to subsequent differentiation and eruption of gradually developed magmas, following the injection of basalt into the crust. Furthermore, the time required to produce trachyte from alkaline basalt, intermediate compositions (hawaiite, mugearite, benmoreite) is averagely estimated at ≤ 2 ka, whereas it took an utmost of 6.6 ± 3.5 to 22.5 ± 1.6 ka for transformation from intermediate compositions to trachyte [33]. Therefore, the total period of transformation was ~9 to ~25 ka. Stelten et al. [34], concluded that prior to 180 ka, eruptions vented from the northern RVF controlled the eastern vent axis (i.e., the main vent axis) and form a secondary, diffuse, western vent axis, but after 180 ka, volcanism concentrated in the direction of the eastern vent axis. From the basalt dominated north to the trachyte south, the composition of volcanism varied methodically together with its length. They postulated that the compositional diversity from basalt to trachyte that took place <180 ka reflected the growth of a mafic intrusive complex beneath the southern region of the principal vent axis, leading to the evolution of evolved magmas (Figure 2).
Data source
As described above, RVF was covered by ground gravity survey [16,20] for the purpose of geohazard/volcanic study. It was also covered by aeromagnetic surveys from 1962 to 1982 for the purpose of mineral exploration. In addition, Langenheim et al. [20], collected various rock sample types for density and susceptibility measurements. Moreover, the Ministry of Environment, Water and Agriculture drilled boreholes in the study area and measured the geophysical logs. In this study, these data set are used to evaluate the geothermal resources in RFV. Details of the above-mentioned data/surveys are discussed below.
Gravity data: Gravity data were collected in RVF on two stages, the first one by Aboud et al. [16], collected 295 ground gravity station in an area of about 20 × 20 km using CG5 gravimeter. The second stage by Langenheim et al. [20], recorded 300 gravity station as a cooperated project between USGS and SGS. The advantage of the later survey is that they used aircraft to cover inaccessible areas and covered about an area of 60 × 60 km including Aboud et al. [16], area. The main advantage of this survey is that they covered the RVF from east to west and recorded gravity stations on both sides of Precambrian basement outcrop which surrounded the RVF. Station intervals ranged from 1 to 1.5 km. Now, 595 gravity stations are available to be used in the current study. Regarding data reduction for each survey such as drift, latitude, free air, Bouguer and terrain correction, they were described in Langenheim et al. [20], and Aboud et al. [16], respectively.
Volcanic centers, in geothermal areas, are considered as indicators of cooling magma or hot rock at a depth (e.g., volcanic flows, ashes, volcanic domes). Gravity studies in volcanic areas provide excellent proof of shallow subsurface density variability connected with the structural and magmatic history of a volcano. A correlation exists between gravity highs/lows and volcanic centers. Figure 3 shows the gravity map for the northern part of Rahat Volcanic Filed (RVF). It shows that low gravity anomalies (e.g., blue color) are located underneath the historical (1256 AD) and five finger/ fissure eruptions (641 AD) sites [24,28,29]. The negative gravity sign suggests that the outcrop formation was by explosive activity, where superficial materials possess a lower density [35]. In addition, the low gravity anomalies are surrounded by high gravity anomalies implying basin like structure system and thermal alteration.

Figure 3: Gravity map for the northern part of Rahat volcanic filed, Al Madinah city. Gravity stations are black and gray dots, other items are explained in Figure 1. HE is the historical eruption (Q7) and 5F is the five-finger eruption (Q6).
Gravity data trend removal: Gravity data contained the regional surficial trend of the study area. Removing this trend enhance signatures of the effect of the local gravity anomalies. In that regard, we used least square method to remove the regional trend of the gravity data. Result after removing the trends is displayed in Figure 4.

Figure 4: Bouguer anomaly map after removing the regional trend. A, B, and C are low density anomalies. Dashed black line represents the detected basin.
Three low density anomalies were well mapped after removing the trend. Those anomalies are A, B, and C, have a surface area as 350 km2, 145 km2, 55 km2, respectively. The three anomalies are in a shape like basin (black dashed line in Figure 4). Anomalies A and C are due to volcanic activities underneath the historical eruption (Q7) and five fingers eruption (Q6). On the other hand, the lowdensity anomaly at B is due to low basement surface.
Density map from rock samples: Rock density as well as magnetic susceptibility play an important role in the physical properties of rock composition [36,37]. Changes in density/magnetic susceptibility are associated with rock alteration, which can be due the thermal change. In volcanic areas such as RVF, subsurface fractures, faults as well as cracks, presents ready channels for thermal fluids to arrive at the Earth surface. During this upward movement, the interaction of these fluids with subsurface rocks causes a change in the physical properties (e.g., density and magnetic susceptibilities). These changes are mainly controlled by the temperature and chemical composition of the fluids [38]. Therefore, hydrothermal zones are capable of rendering insights regarding the nature of the fluid-rock processes, the size of a geothermal system, and thermal conditions prevailing at depths (reservoir).
Physical properties of rocks play an important role in geophysical modeling. During SGS-USGS project, 581 rock samples were collected for physical properties (e.g., petrography, geochemistry, rock density, and magnetic susceptibility). Additional information about the measurements is presented by Langenheim et al. [20].
The density rock samples values were gridded and displayed in Figure 5. Low density zone was mapped trending north south and located near historical and fissure eruption as well as swarm.

Figure 5: Density map distribution from 581 rock samples (black filled triangles). Dimmed polygon indicate low density zone which can be recommended for further study.
Magnetic data: Blank et al. [39,40], Arabian Geophysical and Surveying (ARGAS) Ltd. carried out various aeromagnetic surveys over volcanic fields in Saudi Arabia. This took place within the period of 1962 and 1982 under the supervision of the Ministry of Petroleum and Mineral Resources. With ground configurations of 150, 300, or 500 m, these surveys were carried over individual blocks by BRGM and USGS at a line spacing approximately 800 m. Fluxgate magnetometers with analog recording configurations were generally used whereas the CSF cesium vapor and Geometrics G813 proton-precision magnetometers were utilized over economic interest areas [16,21]. Figure 6 shows the generalized aeromagnetic map of RVF.

Figure 6: Total Magnetic Intensity (TMI) map for Rahat volcanic field, Al Madinah city. Anomalies A, B, and C are characterized by low susceptibility. Black triangles are the volcanic cones.
Trends in magnetic anomalies are not occurred randomly, they reflect a certain structural geology system. Majority of the volcanic centers appears to locate on areas with magnetic highs (positives). Superimposed magnetic lows (negatives) do exist sometimes but are generally weak or zero. In a geothermal environment, the susceptibility decreases due to the high temperatures. Positive magnetic anomalies are mostly interpreted to take place in demagnetized zones analogous to heat sources bearing temperatures above the Curie point depth of magnetite (575˚C).
It can be realized that (Figure 6), underneath the historic and five fingers’ eruptions, high magnetic anomaly trending in EW and NW, respectively. On the west of swarm area, large circular positive anomalies occur, indicating shallow basement depth. Blank et al. [30], estimated the depths leading to the basement from aeromagnetic data, southern part of our study area. Their conclusions estimated maximum thickness of the lava flow section at 380 m and minimum at about 150 m respectively. Worthy of note is the fact that, surface lava flows possess magnetic contents less/or like basement rocks thereby posing a challenge in imaging the subsurface from magnetic data. Therefore, various filters are required to extract more information from the magnetic data.
Tilt Derivative filter: The Tilt Derivative (TDR) method is edge detection technique applied for potential field data (e.g., magnetic and gravity). It enhances and sharpens the potential field anomalies [41,42]. The advantage of the TDR is that its zero-contour line is located on or close to the contacts/faults. Miller et al. [43], defined the TDR as below:
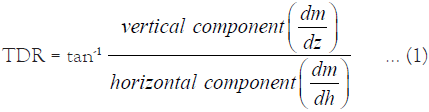
Where dm/dz and dm/dh are the vertical and horizontal components of the magnetic field (m), respectively.
The TDR filter was applied to the magnetic data and the resulted map is displayed in Figure 7. By looking to the TDR interpreted map, faults/contacts were mapped (TDR zero contour line). It is worth to observed that the low magnetic zones (A, B, and C) from Figure 6 were surrounded by contacts which imply that those areas are recommended for further study.

Figure 7: Tilt derivative map (dimmed color) deduced from magnetic data. A, B, and C are zones of low susceptibility (see Figure 6). Black lines show the interpreted faults from TDR filter.
Susceptibility map from rock samples: As described in density map from rock samples section, the susceptibility map was produced from the 581 rock samples and the result is displayed in Figure 8. It can be recognized that there is an area with low magnetic susceptibility (dimmed polygon in Figure 7) near the historical and fissure eruption as well as the swarm area. This zone is considered for further study.

Figure 8: Susceptibility map distribution from 581 rock samples (black filled triangles). Dimmed polygon indicate low susceptibility zone which can be recommended for further study.
3D inversion of gravity data
When less information about the subsurface is required, subsurface horizons can be mapped directly from the data. However, when more information is required, inversion technique is required. This technique is used to invert observed gravity data into density distribution directly reflecting the subsurface conditions. In the current study, a GRAV3D inversion technique is used to obtain density voxel [44]. This technique depends on a linear equation, representing the subsurface by a homogeneous grid with a specific size and position with unknown density contrast. Then, a subsurface distribution is calculated and the resulting anomaly (e.g., calculated grid) is compared to the observed grid. The minimum the difference between the observed and calculated grids, the more validity of the inversion result [45-48].
In our study, we created a mesh as 146 x 138 x 112 with total cells of 2256576. Mesh dimensions was as 73 x 69 x 72 km. Prior carry out the inversion, the general trend in gravity data was removed. The density distribution is defined by solving the inversion as an optimization problem, considering of minimizing a model objective function and generating synthetic data that fall within the statistical misfit of the observations [43]. Inversion results are displayed in Figure 9.
It can be realized that the area underneath the historical and five finger eruptions is characterized by low density zone (green color in Figure 9) which attract attention to its geothermal potentiality. We also observed that the high-density zone is surrounded by lowdensity zone (red color in Figure 9). Vertical sections and horizontal slides were extracted from the voxel inversion body in order to more understanding the density variation (10).

Figure 9: 3D inversion results of gravity data using GRAV3D. Green and red are low and high density, respectively.
Results from the 3D inversion indicate that the historical eruption and fissure/five finger eruptions are located at low density materials. The central part of RVF subsurface resembles a basin-like structure trending in NW direction, which parallel to the Red Sea trend. It reflects that there are high density materials on the eastern and western regions of the field (e.g., basement rocks). With the basinlike structure, we assume that there is a graben system in the study area which was filled by lava flows in the past. Zooming-in on the depth, the extracted vertical and horizontal slices, Figure 10 shows the variation in the density from north to south (A1 to A3) and from top to bottom (B1 to B3). Vertical section A1 crossing the historical eruption, vertical section A2 crossing the fissure eruption, and vertical section A3 crossing the swarm area. On the other hand, slice B1 is at 3 km depth, slice B2 is at 6 km depth, and slice B3 at 10 km depth. Clearly, the low-density zone associated with the recent eruption is mapped.

Figure 10: Vertical sections (left) and horizontal slices (right) extracted from the 3D inversion results (Figure 9).
Borehole data
A lot of boreholes are drilled in the RVF by the ministry of Environment, Water, and Agriculture (MEWA) for a purpose of water exploration and subsurface evaluation. The available boreholes in our study area are RAH-22, RAH-38, HIRMA-01, and HIRMA-02. The available boreholes data are listed in Table 1 while their locations are shown in Figure 1. The purpose of displaying the boreholes is just to show the temperature elevation. Borehole log data were plotted on Figure 11 indicating that temperature increases with depth. Although the horizontal distances between the boreholes (e.g., 33 km, 21 km, and 9 km) as shown in Figure 11, is relatively large, high temperature with depth are observed. It indicates that the expected geothermal reservoir is extended to large horizontal distance. In addition, the density log shows low readings below 360 m which correlates with a slight increase in Natural gamma ray, representing the non-weathered basement. This result agrees with Blank et al. [30].
| Well | RAH-22 | RAH-38 | HIRMA-01 | HIRMA-02 |
|---|---|---|---|---|
| Date | 10 Dec. 2014 | 30 Dec. 2016 | N/A | N/A |
| Total depth | 272 m | 460 | 358 | 206 |
| Location | N 24.21487 E 39.94442 | N24.10447 E 39.76931 | N 24.45739 E 39.97351 | N24.51616 E 39.90607 |
| Elevation | 891 m asl | 883 | 780 | 824 |
| Temperature | 34.5 to 37.5 | 33.8 to 36.8 | 30.92 to 36.22 | 35.44 to 36.44 |
Table 1: Borehole data in Rahat volcanic field.

Figure 11: Geophysical log data (e.g., Gamm ray, density, Temp) for four well, Hirma-01, Hirma-02, RAH-22, and RAH-38.
Gravity and magnetic data were used successfully to understand the subsurface structural system and its relation to geothermal resources. The area is characterized by a basin like structural system trending in NW direction, parallel to the Red Sea trend. It implies that, this structural system is associated with Red Sea rifting. In addition, the detected faults from magnetic data show that the main trend is in the NW direction as shown from the rose diagram in Figure 12. Integrated results obtained from magnetic and gravity data analysis is displayed in Figure 12.

Figure 12: The final interpreted results deduced form gravity and magnetic data. Note:  volcanic cones;
  Historical eruption; (
 Fissure eruption;
  Gravity anomaly;
  Northern Rahat volcanic field boundary;
  Detected basin from gravity.
It can be observed that, the low density and susceptibility zones (green and blue polygons in Figure 12) are located within the basin system (blue polygon in Figure 12). In addition, the volcanic cones are located inside the basin. It can be implied that the low density and susceptibility zones are structurally controlled.
When looking at the variations in density and susceptibility maps, gradient change can be observed in the transition zones (highs density/susceptibility zones and lows density/susceptibility zones) indicating geothermal anomalies. These anomalies are located underneath the historical eruption, fissure eruption/or five fingers eruption, and north of the swarm area. These zones are recommended for high potential geothermal resources.
The 3D inversion of gravity data indicates that i) study area is characterized by graben-like structure system trending in NW, ii) the hanging wall of the graben is characterized by high density materials while the footwall has low density materials (e.g., lava flows). In addition, the low-density zones are coinciding with the transition zones of density variation. It can be a geothermal reservoir. However, more detailed gravity and electromagnetic (e.g., Magnetotelluric) surveys are required in order to image this reservoir. It should be stated that, we did not invert the magnetic data because the surface lava flows are rich in magnetic content which affects the airborne magnetic data inversion. In general, gravity and magnetic data were used to map the geothermal anomalies in Rahat volcanic field. Recommendations for future study are i) drilling few boreholes (e.g., 2-3 borehole), ii) high resolution gravity and magnetotelluric surveys in the area underneath the historical eruption (~15 × 15 km), iii) building a primary conceptual modeling for the geothermal reservoir.
In general, most of the volcanic areas have high potential geothermal energy, it can be stated that at Rahat volcanic field, and due to elevated temperature in water wells as well as results of gravity and magnetic data analysis, near the historical eruption and fissure eruption there is a geothermal reservoir at depth about 3-4 km. To model this reservoir, more high-resolution gravity and magnetotelluric data are recommended. Drilling borehole is also highly recommended to measure the temperature gradient.
The data underlying this article will be shared on reasonable request to the corresponding author.
This research work was funded by Institutional Fund Projects under grant no IFPNC-001-145-2020. Therefore, authors gratefully acknowledge technical and financial support from the Ministry of Education and King Abdulaziz University, Jeddah, Saudi Arabia.
[Crossref] [Google Scholar].
Citation: Aboud E, Alqahtani F, Elmasry N, Abdulfarraj M, Osman H (2022) Geothermal Anomaly Detection Using Potential Field Geophysical Data in Rahat Volcanic Field, Madinah, Saudi Arabia. J Geol Geophys. 11: 1026.
Received: 16-May-2022, Manuscript No. JGG-22-17528; Editor assigned: 19-May-2022, Pre QC No. JGG-22-17528 (PQ); Reviewed: 02-Jun-2022, QC No. JGG-22-17528; Revised: 07-Jun-2022, Manuscript No. JGG-22-17528 (R); Published: 17-Jun-2022 , DOI: 10.35248/2381-8719.22.11.1026
Copyright: © 2022 Aboud E, et al. This is an open-access article distributed under the terms of the Creative Commons Attribution License, which permits unrestricted use, distribution, and reproduction in any medium, provided the original author and source are credited.