Journal of Geology & Geophysics
Open Access
ISSN: 2381-8719
ISSN: 2381-8719
Research Article - (2023)Volume 12, Issue 3
Road failure is widely known in developing countries that cause the loss of many resources due to lack of scientific studies before the construction starts. Thick clay soils, fractures and shallow groundwater are the inducing factors for the failed road segment. Two-dimensional electrical resistivity imaging and magnetic methods were used to map the subsurface lithology and subsurface geological structures that cause Gedo-Ijaji asphalt road failure in Chelia Zone, Oromia, western Ethiopia, in order to solve such serious problems. The lithological units of each geoelectric layer within the study area was studied and interpreted using six profile electrical resistivity imaging and six magnetic profiles with a total data points of 123 collected along the two sides of the asphalt roads and perpendicular to the asphalt road. The electrical resistivity tomography data were processed and inverted using RES2DINV computer software, while the magnetic data were processed using OASIS MONTAJ software. The result of electrical resistivity imaging displayed that the study area is composed of subsurface geo-electric layers with a resistivity between 1 Ωm to 37 Ωm. The depth of investigations by electrical resistivity imaging is averagely 39 m. The result of the study indicated expansive clay formation of 4 to 12 meter thick overlying the weathered basalt. The thickness of these expansive soil was constrained to nearby borehole data and tomography showed nearly horizontal layer. While magnetic results indicates weak zones/altered zones and high anomaly trending from NW-SE. The study area is highly characterized by clay materials on the top layers and affected by shallow geological structures. Analytic Signal solution techniques on the analytical signal data were applied to identify a magnetic anomalous body. Therefore very shallow investigation might not be advisable for highway engineering structures.
Expansive clay; Resistivity imaging; Magnetic; Geoelectric; Susceptibility; Analytic signal; Anomalous
Road failure can be defined as the instability of a road to give the primary purpose for which it was constructed, as a result of discontinuity in the road pavement [1]. Some of the factors responsible for these road failures are poor construction materials, bad design of the road, poor drainage, geological factors, water flooding, and fallen tree trunks that were left and buried. However, geological factors may be the cause of such failures even though these roads are built on the soil. This shows that road construction requires adequate knowledge of the conditions of the subsurface [2].
For any engineering structures, shallow groundwater and geologic structures have a negative effect. The integrity of roads can be undermined by the existence of geological features as well as the engineering characteristics of the underlying geologic sequences Mesida, E.A (1987).
The overuse of these roads, as well as the movement of heavy vehicles, is a major factor to the road's destruction and eventual collapse. Geophysical methods should be used to analyze the subsurface soil and all other earth materials characteristics in order to obtain accurate and suitable earth materials characteristics.
Generally, any newly constructed roads seem good when they start to give service to the community. After a short period it starts to show some cracks or failures with changing the weather, especially after heavy rainfall or during rainfall, the road quality becomes destructed. The destructed road always shows irregular cracks and displacement of blocks. This failure is very common in every road, hence the quality and level of services of the road dropped down drastically as the road users increase and maintenance overlooked.
Many geophysical investigations were conducted in Africa. In Ethiopia, road failure caused by landslide in North Ethiopia, Tigray Region (Dedebit- Adi-Remets) was conducted to identify discontinuities that cause this road failure using electrical resistivity method [3]. Electrical resistivity methods (Vertical Electrical Sounding (VES) and Dipole-dipole electrical resistivity), Magnetic and Very Low-Frequency Electromagnetic (VLF-EM) methods were used along Ilesha Owena highway to detail the subsurface Geo-electric sequence, mapping of the subsurface structural features within the subgrade soil and delineating the bedrock relief as a means of establishing the causes of highway pavement failures [4]. In the study area near surface discontinuities and shallow groundwater that cause the asphalt road failure were identified by electrical resistivity tomography and magnetic methods.
Two dimensional (2D) electrical resistivity imaging, in which the subsurface is assumed to vary vertically down and laterally along the profile but constant in the perpendicular direction, has been used to investigate areas with moderately complex geology [5-8]. Electrical Resistivity Imaging (ERI) has become an important engineering and environmental site investigation tool reasons being that, there is a broad range of resistivity values [9], which allows for potential discrimination between various geological materials. The magnetic anomaly plots, can map the weak zones resulting from subsurface structures [10]. Soils with lower electrical resistivity have higher liquid limit or plasticity index, a greater percentage of fines or clay, or a smaller coarse fraction [11].
The study area is located along the Ambo-Nekemte main road in the Chelia woreda,west shoa zone of Oromia regional state, with the local name of Gedo-Ijaji. It serves as a link between the country's capital city and Asosa. It is approximately about 1000 m in length and astronomically bounded between UTM coordinates 325950 to 326600 Easting and 999600 to 998600 Northing (Figure 1).
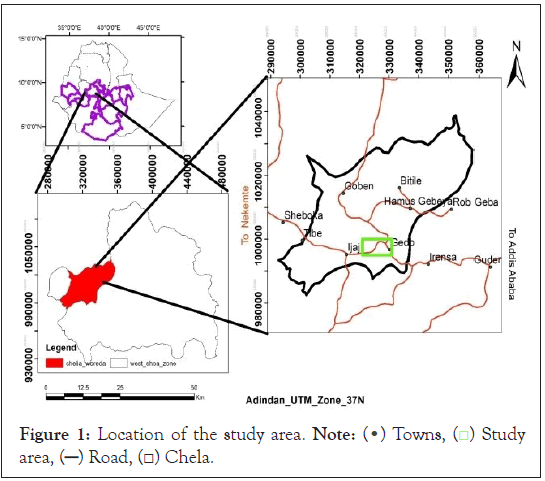
Figure 1: Location of the study area. Note: ( ) Towns, (
 ) Study
area, (
 ) Road, (
 ) Chela.
The study area is affected by geological structures like lineaments and fractures exposed along the road cut. The existence of this lineament on the surface indicates the existence of fault beneath the earth surface. Along this W-E trending faults there are outcrops of volcanic rocks and quaternary sediments. These exposures are exposed along the road cuts, river cuts, quarry sites and stream cuts.
Any linear feature on the Earth’s surface that is too precise to have arisen by chance is a lineament. Many lineaments are straight lines but some are curves. Faults are more or less straight lineaments, while island arcs are curved lineaments. Most lineaments are tectonic in origin [12].
North of latitude 110N, NNW-trending lineaments are common on the Ethiopian plateau. However, important lineaments of this trend occur farther south, most notably the faulting along the Guder valley, which has been associated with late-Tertiary warping and small extrusions of Quaternary basalts. Some of the ERTS lineaments may also mark the Guder dike swarm [13].The known dike swarms in Ethiopia are restricted to widely spaced tectonic lines and to major shield volcanoes. The Guder dyke trend 030° along the Guder valley (the composition of the dike is olivine augite-alkali dolerite). The Guder dike deep steeply east in the western half of the swarm and west in the western half and the modal thickness is only 50 cm [13].
The presence of ESE-trending normal faults within the Neoproterozoic basement rocks can be directly related to NNE–SSW-directed extension related to the E-trending Ambo Lineament which extends westward from the Main Ethiopian Rift and runs just south of the exposures of the Neoproterozoic basement rocks within the Gorge of the Nile [14], attributed the outcrops of the Neoproterozoic basement rocks in the southwest and the deepening of ‘the top to basement’ towards the Main Ethiopian Rift in the NE as a result of northeastward stepping down of hanging-walls along these ESE-trending faults (Figures 2 and 3).
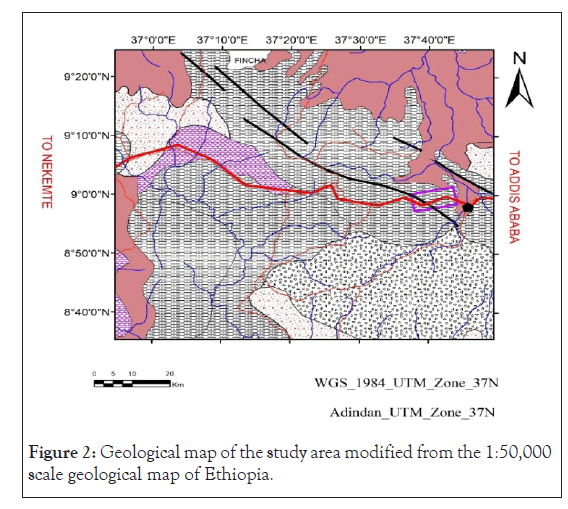
Figure 2: Geological map of the study area modified from the 1:50,000 scale geological map of Ethiopia.
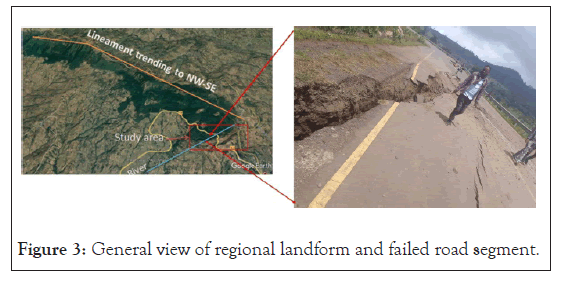
Figure 3: General view of regional landform and failed road segment.
Electrical resistivity tomography data acquisition
Both Electrical Resistivity Tomography (ERT) and magnetic survey techniques were conducted over the study area to attain the objective the study. To map subsurface features both laterally and vertically at the same time 2D resistivity imaging survey is a preferable and effective survey tool.
The ERT profile lines applied on the area of analysis are designed. In this case, the survey design was conducted parallel to the road and across the asphalt road. Changing the array's spacing and repeating the profile along a traverse many times. To delineate the Geo-electric properties of the portion in the study area, a transverse parallel to the road pavement comprising both the stable and unstable portion of the road pavement of about 1000 m in length was evaluated. Total area coverage of the study area is 650000 square meter.
Six geophysical traverses, ranging in length from 235 to 355 meters, were formed on both sides of the failed route, based on geology of the area. As part of the geophysical field survey, magnetic surveys were performed on six profiles with an exposed face, and six geoelectrical profiles were installed along the two sides of the asphalt path.
The measurements were performed with IRIS SYSCAL JUNIOR-72 which operates automatically once the acquisition and geometrical parameters have been set. In this case a Wenner array was chosen. For five profiles, a total of 48 electrodes were connected to a 235 m long multi-core cable that is divided in 4 sections of 60 m each and has 48 channels. An electrode spacing of 5 m was chosen, reaching a depth of investigation of approximate 41 m and for the first profile the length of profile is 355m, reaching a depth of investigation of approximate greater than 39 m. The depth of investigation by Electrical Resistivity Imaging (ERI) is one-fifth (20%) of the length of the profile.
Electrical resistivity data processing: After the measurements were performed, the resistivity data were converted from BINARY (bin.) to DAT data format by PROSYS II software. The converted data were converted into resistivity models for interpretation of subsurface conditions using the RES2DINV software/Geotomo Software [15]. ERT data was processed using the following steps;
Review of the resistivity data sets for presence of unreasonably high and low (negative) resistivity values called “ bad data points” [15]. Compilation of a resistivity model/ERT resistivity profile that to dimensional resistivity distribution. “Bad data points” mean resistivity of unrealistically high or low (negative) values. “Bad data points” can be caused by several factors, such as failure during survey of equipment used, as electrode malfunction. Also, very poor electrode ground contact can result to “bad data points.” The “bad data points” appear as stand out points. All “bad data points” are marked as red plus signs. The RES2DINV software offers an option that allows for removal of such points manually by simply clicking on them. After the resistivity data sets acquired in the field were inspected and all unrealistic values removed, the RES2DINV software used an inversion algorithm to convert the measured resistivity model/ERT resistivity profiles to a geologic model which reflect lateral and vertical resistivity distribution.
Magnetic data acquisition
Total magnetic field data were collected with a proton magnetometer. The proton magnetometer has a sensor which consists of a bottle containing a proton rich liquid, usually water or kerosene, around which a coil is wrapped, connected to the measuring apparatus. Base stations were constructed for diurnal corrections. The line spacing is 100 m and point distance is 50 m.
Magnetic data processing: After collecting all of these field data using traverses/profiles and at random, data correction (diurnal correction) and numerous data enhancements were performed.
Diurnal correction and filtering: The Earth’s magnetic field varies with time, i.e. it is not constant. As the Earth rotates, the outer layers of the ionosphere interact with the solar wind to cause minor fluctuations in the magnetic field. Depending upon the frequency, duration and intensity of these fluctuations, they are given different names. This was carried out to remove the temporal variations which occur in the earth’s magnetic field over the course of a day, arising from interactions of electric currents in the ionosphere with the solar wind. Repeated measurements of the total magnetic field intensity made at a base station provided data for diurnal correction of magnetic field intensity acquired along a particular traverse. The correction was carried out by using the relation:
Data enhancement: The data enhancement technique used is in this study is analytical signal method. The analytical signal magnetic map is produced from values of total magnetic field intensity map. Analytical signal computation was performed in order to match the magnetic highs and the causative magnetic bodies. This helps to minimize interpretation difficulties due to effects of low magnetic latitude and remnant field.
Generally, the interpretation of magnetic data is difficult at low magnetic latitudes due to the complex nature of magnetic field at the equator/low latitude. However, the magnitude of analytical signal map reveals maximum value over magnetic contacts regardless of the direction of magnetization and is always positive.
Survey design
Geophysical techniques are used to find boundaries where there is a significant difference in physical properties. Some local geological structures and geophysical profiles are depicted in the survey design below. Each profile line is 100 meter apart, and profiles one and four are more than 50 meters away from the asphalt road.
The geophysical instruments and other materials used for the research are IRIS SYSCAL JUNIOR-72, Measuring tapes, Hammers and electric cable, Steel electrode, Global Positioning Satellite (GPS) and Proton magnetometer-600 (Figure 4).
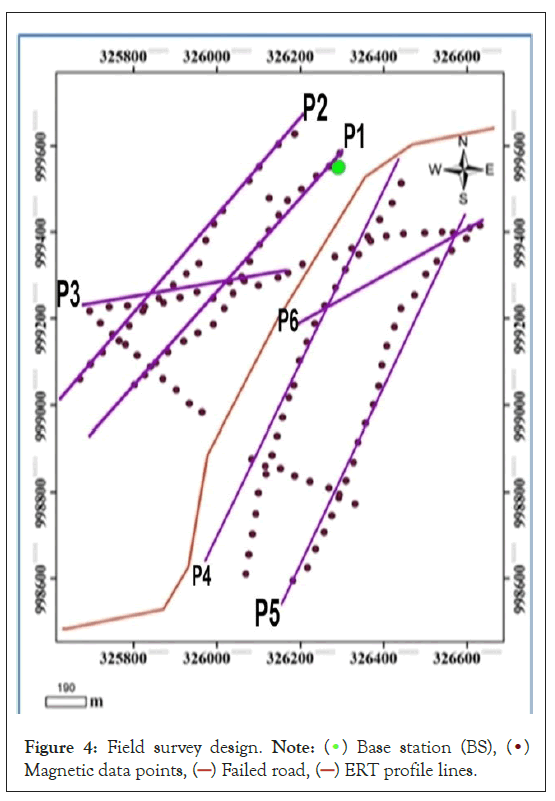
Figure 4: Field survey design. Note: ( ) Base station (BS), (
 )
Magnetic data points, (
 ) Failed road, (
 ) ERT profile lines.
Electrical resistivity tomography results and discussions
The ERT data were inverted using the RES2DINV software to obtain a more detailed image of the subsurface.
Profile one: Profile one has a low resistivity value, ranging from 1.8 to 23.6 ohm-m. The response of overlying clay materials and highly weathered basalt containing moisture is represented by these resistivity ranges.
Materials in weak zones are quickly weathered and disintegrated into rock fragments as a result of the existence of weak zones. In the areas where poor zones are located, the morphology of the layer is flat and displaced to a depth. The response of the bedrock horizon is a layer with a resistivity greater than 25 ohm-m. Along the profile, there are very low resistivity values, particularly in the area where the weak zones are visible. This low resistivity in some of the profile line's areas may be due to high weathering and water percolation from the surface along the fractures (Figure 5).
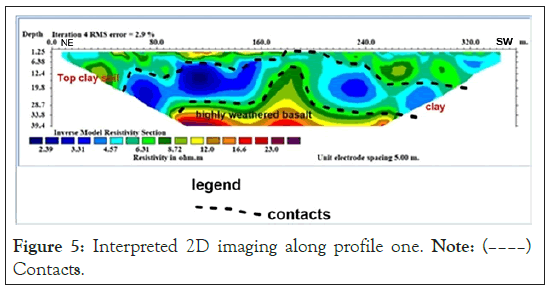
Figure 5: Interpreted 2D imaging along profile one. Note: ( )
Contacts.
Profile two: This profile has a low resistivity value, ranging from 1 to 20 Ωm. These resistivity ranges reflect the response of overlying clay (red clay topsoil) materials and highly weathered basalt containing moisture. This low resistivity in some of the areas within the profile line is also due to high degree of weathering and water percolation from the surface along the fractures. The layer with resistivity greater than 20 Ωm is the response of the slightly weathered basalt.
A clay soil and fractured and weathered basalt rocks lie beneath the dry red clay soil. Low resistivity values, fractures, and discontinuities characterize these rocks. Clay rocks have resistivity values ranging from 1 to 10 Ωm, whereas basalt rocks have resistivity values ranging from 10 to 107 Ωm (Figure 6).
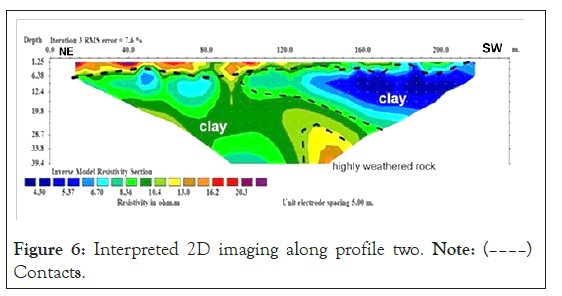
Figure 6: Interpreted 2D imaging along profile two. Note: ( )
Contacts.
Profile three: The resistivity value of profile three low and varies from 1 to 17 Ωm. These resistivity ranges are the response of overlying clay materials and highly weathered basalt in the study area.
Due to the presence of weak zones, the materials in those zones are easily weathered and disintegrated into fragments of rocks. The layer with resistivity greater than 17.1 Ωm is the response of the bedrock horizon. This 2D model shows three layers along the profile. There are very low resistivity values along the profile, particularly in the area where the weak zones are shown (Figure 7).
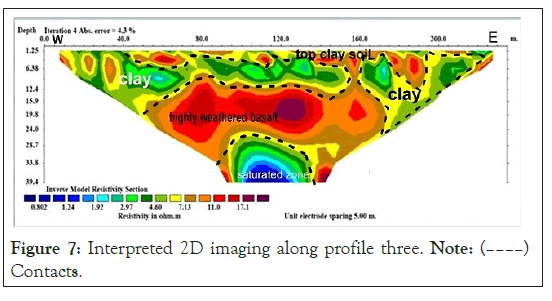
Figure 7: Interpreted 2D imaging along profile three. Note: ( )
Contacts.
Profile four: The resistivity value of this profile is low and varies from 2.27 to 34.7 Ωm. These resistivity ranges are the response of overlying clay materials and highly weathered basalt containing moisture.
Due to the presence of weak zones, the materials in those zones are easily weathered and disintegrated into fragments of rocks. The morphology of the layer is flat and displaced to a depth in the areas where weak zones are found. The layer with resistivity greater than 34.8 Ωm is the response of the bedrock horizon. There are very low resistivity values along the profile, particularly in the area where the weak zones are shown. This low resistivity in some of the areas within the profile line is possibly due to high degree of weathering and water percolation from the surface along the fractures (Figure 8).
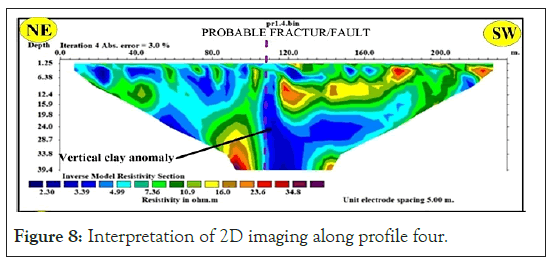
Figure 8: Interpretation of 2D imaging along profile four.
Profile five: The resistivity value of this profile is low and varies from 3.13 to 24.2 Ωm. These resistivity ranges are the response of overlying clay materials and highly weathered basalt containing moisture. Due to the presence of weak zones, the materials in those zones are easily weathered and disintegrated into fragments of rocks.
The morphology of the layer is flat and displaced to a depth in the areas where weak zones are found. The layer with resistivity greater than 24.1 Ωm is the response of the bedrock horizon. There are very low resistivity values along the profile, particularly in the area where the weak zones are shown. This low resistivity in some of the areas within the profile line is possibly due to intensive degree of weathering and water percolation from the surface along the fractures (Figure 9).
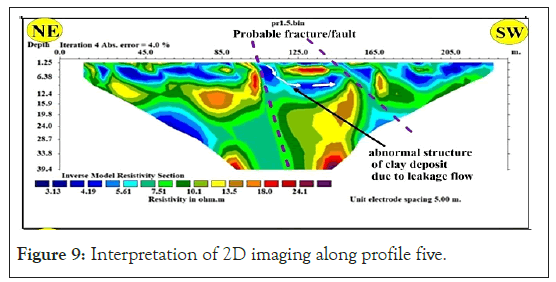
Figure 9: Interpretation of 2D imaging along profile five.
Profile six: The resistivity value of this profile is low and varies from 1.58 to 20.8 Ωm. These resistivity ranges are the response of overlying clay materials and highly weathered basalt containing moisture.
There are clear weak zones along the profile as shown in the figure below. This discontinuities/weak zones shows the displaced block as from the 2D model. Due to the presence of weak zones, the materials in those zones are easily weathered and disintegrated into fragments of rocks. The morphology of the layer is flat and displaced to a depth in the areas where weak zones are found. The formation with resistivity greater than 21 Ωm is the response of slightly weathered basalt. There are very low resistivity values along the profile, particularly in the area where the weak zones are shown. This low resistivity in some of the areas within the profile line is possibly due to intensive degree of weathering and water percolation from the surface along the fractures (Figure 10).
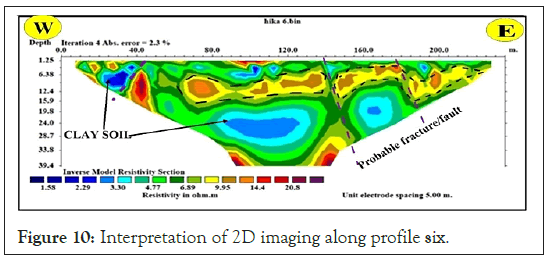
Figure 10: Interpretation of 2D imaging along profile six.
The interpretations of the results obtained after analyzing the data collected from each profile line are as follows:
Profile 1, profile 2, profile 4 and profile 5 were aligned in a nearly NE-SW direction covering a horizontal distance of 355 m, 235 m, 255 m and 235 m respectively. The other profiles (profile three and profile six) were oriented in a nearly W-E direction across the other profiles. The corresponding electrical resistivity imaging data collected was 744 for profile one and 360 for the other profiles. The horizontal distances covered by profile three and six is the same and data points are the same for these two profiles. The overall depth covered by the ERT survey is 39 m.
The basis of the resistivity geo-electrical surveys is delineating of the resistivity distribution within the subsurface. This can be the results of the presence of various materials with different electrical properties.
Additionally, the resistivity is strongly influenced by the degree of fracturing or weathering, the position of the geological formation and therefore the concentration of dissolved salts in their pore waters [15,16]. The electric resistivity of rocks is closely associated with the porosity and also to the mineralogy. Increased fracture frequency and clay alteration significantly decreases the electrical resistivity of rocks.
As stated by Abu-hassanein, 1996, Soils with lower electrical resistivity have higher liquid limit or plasticity index, a greater percentage of fines or clay, or a smaller coarse fraction.
In inverse model resistivity sections, brittle structures like joints and faults are likely to be displayed as resistivity drops abruptly, since these highly fractured zones enhance the weathering and water percolation along them, changing the electrical properties in comparison with the rest of the unaltered rock units. There are also topographical evidences that shows fault. These evidences are various surface features like; offset ridges, parallel deflection of valley and reversal of drainage.
The subsurface/sub-grade soil which is the weathered layer beneath the subsurface is generally clay. These weathered layers are red top clay soil and clay soil with greater than 10m thickness. These top red clay soil/sub-grade soils accumulate water, causing them to swell and collapse under applied wheel load stress, resulting in road failure. The presence of near-surface linear features such as faults, broken areas, joints, and buried stream channels also causes this road to fail. Because the soil type described in this study is expansive soil, roadways on expansive soil usually require the excavation of residual soil and the substitution of selected materials (gravels).
Failed segment is located southwestern of an approximately ENE- WSW trending ridge whose huge run-off at the peak of rainy season floods the failed segment portion of the road. Run-off also creates a pond at the toe of the road pavement. Linear features so- called to be faults or fractured zones and assumed buried stream channel were delineated beneath failed segments. This geologic feature supported the failure of the road segments.
Magnetic survey results and discussion
Magnetic data collected near the earth’s equator is more difficult to interpret because the magnetic field intensity at the equator is very small because of the ambient inducing field direction is horizontal Low field strength produces correspondingly smaller anomalies, and the smaller field inclination produces several complications. Anomalies over magnetically susceptible bodies tend to be negative instead of positive, and anomaly pattern may vary considerably with structural azimuth. Horizontal inducing field at the equator causes the pattern of an induced magnetic anomaly to be highly dependent on its orientation [17]. To reduce these all difficulties in interpretation of magnetic data collected near the equator, many data enhancing techniques were conducted.
Total magnetic field map: Total magnetic field intensity contour map is produced by inputting magnetic data into the program Surfer and anomaly map (Figures 11 and 12), were generated after the field raw data have been corrected for the effects of daily field variations in the earth’s magnetic field strength during the course of data acquisition. Over the survey area, total field intensity values range from 35713 gammas to 36536 gammas. The overall magnetic field intensity map can be divided into three anomalous localities with varying intensities.
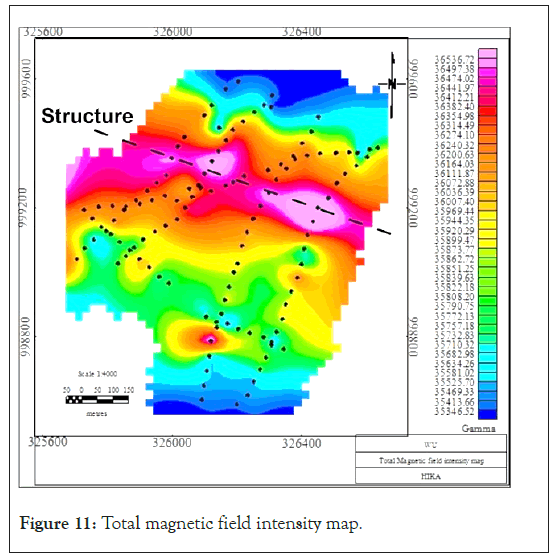
Figure 11: Total magnetic field intensity map.
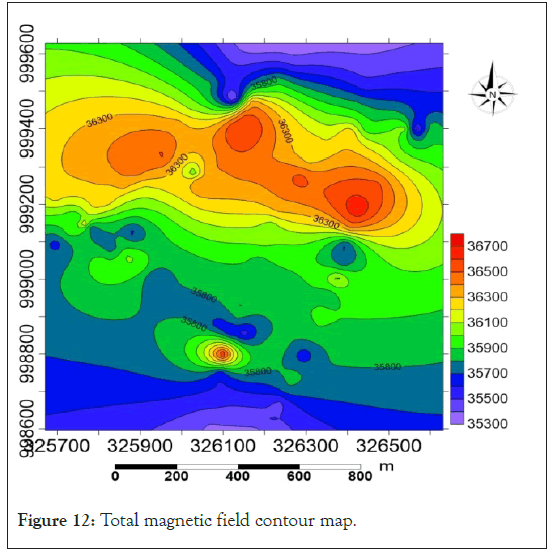
Figure 12: Total magnetic field contour map.
The first anomalous localities are correlated with volcanic rocks (basaltic) materials and have high total magnetic intensity values ranging from 35968 gammas to 36536 gammas. The second anomalous localities are associated with the weak zone's boundary and have intermediate magnetic intensity values ranging from 35713 gammas to 35940 gammas. The third anomalous localities are characterized by magnetic intensity values of less than 35713 gammas and associated with quaternary sediments. The black dots indicate magnetic data point distribution in the study area.
The region of low magnetic intensity on the magnetic profiles suggest possible discontinuity or faults or fracture zones whereas the region with high magnetic intensity indicates that the area is underlain with magnetic materials. Through this weak plane there occurs the flow of water (as spring) which has a negative influence on road structure.
Total magnetic field anomaly map: The difference between the diurnally corrected total magnetic field and the predicted value of the IGRF at a point for this local area produces the magnetic anomaly map. This IGRF value is averagely 35627 gammas. The map is intended to provide insight into the Earth's crust's overall subsurface structure and, to some degree composition. The distribution of geologic materials and structural features appears to be a factor in the total magnetic field anomaly map, according to field observations. Positive magnetic anomalies associated with mafic rocks such as basaltic and scoriaceous rocks, which could be caused by strong remnant magnetizations. The study area's lowlands are completely covered in dense Quaternary sediments (Figure 2). Low magnetic anomalies characterize these quaternary sediments.
The magnetic field measured by the proton precession magnetometer was caused by the interaction of the Earth's main magnetic field and an anomalous magnetic field. Due to the small magnetic field intensity and horizontal ambient field direction, magnetic data collected at low latitude is difficult to interpret. At low magnetic latitudes, anomalies over magnetically susceptible bodies show negative values instead of positive ones, and the anomalies are strongly dependent on azimuthal position [17]. Mafic volcanic rocks, on the other hand, such as basalt and scoria, which are supposed to have higher remnant magnetization than felsic volcanic rocks, display a large total magnetic anomaly. This is because remnant magnetization makes interpreting magnetic anomalies at low latitudes more difficult, as well as increases the detectability of a body's total magnetic anomaly.
Analytical signal map: The analytical signal map of the study area is generated after performing analytical enhancement filtering on the total magnetic anomaly map already produced. Analytic signal has been utilized widely for mapping of structures and for determining the depth of sources. The Analytic Signal grid improves shallow sources, widens anomalies, and almost fully eliminates the effects of magnetizations direction, geological strike, and geological dip. It is also used to locate the boundaries of magnetic sources and to estimate the depth and dimension of magnetic sources. But Analytic Signal maps highlight shallow sources [18].
Analytic signal and Source Parameter imaging techniques were used to estimate depth. The results of these depth techniques are comparable. Profile depth to basement (Pdepth) techniques (Analytic Signal techniques) on magnetic data was applied to identify a magnetic causative body location and depth relationship. From this technique the maximum depth attained by using OASIS MONTAJ GEOSOFT software is approximately 250 m. Because the amplitude of the basic analytical signal reaches maximum (peaks) across magnetic contacts, the map definitely identifies shallow anomaly sources very well and is good at detecting the margins of shallow bodies (Figure 13). The map clearly identifies and shows distinct locations associated with geological contacts that require specific design thinking for large constructions. Peaks of magnetic analytical signals are directly correlated to the magnetic causative body (Figure 14).
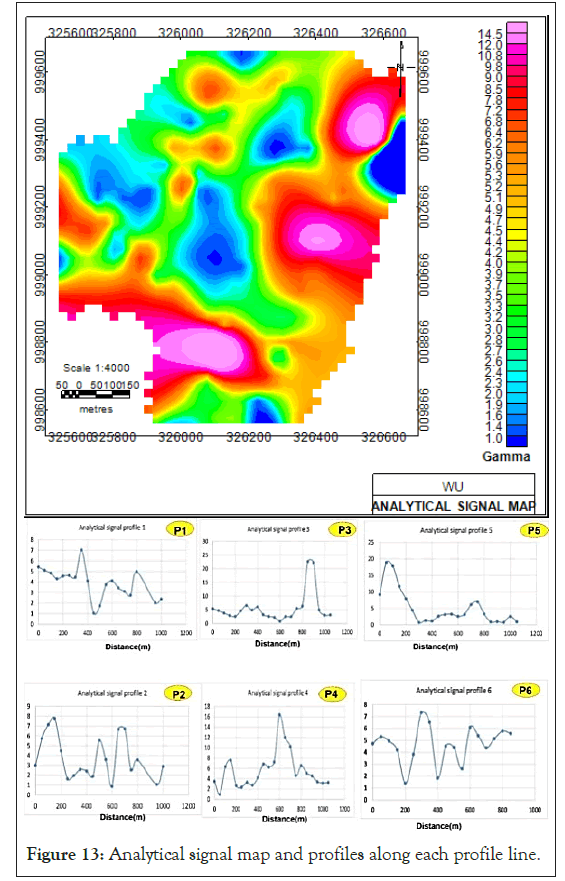
Figure 13: Analytical signal map and profiles along each profile line.
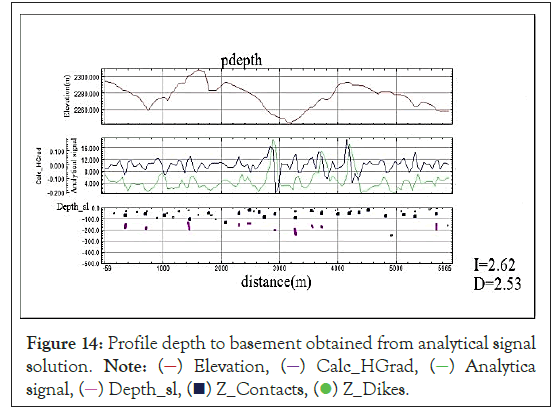
Figure 14: Profile depth to basement obtained from analytical signal
solution. Note: ( ) Elevation, (
 ) Calc_HGrad, (
 ) Analytica
signal, (
 ) Depth_sl, (
 ) Z_Contacts, (
 ) Z_Dikes.
A 2D contour map of the study area shows widely spaced contour lines indicating the depth to the magnetic source body in this region is relatively high (Figure 11). At some part of the map, the contour lines are closely spaced indicating that the depth to magnetic basement is shallow at this region of the study area. At the southern part of the generalized contour map widely spread out show that the depth of basement is high in these areas. The results have demonstrated that certain analysis of magnetic data can give essential information about the weakness zones in the study area.
The closely spaced, linear sub-parallel orientations of contours from the northwestern southeastern part of the map indicate the possibility of faults or local fractured zones [19]. Both brittle and ductile features such as joints, faults, and folds are often attributed to a sudden discontinuity of the magnetic unit, offsets of apparently similar magnetic units, an abrupt change in depth to magnetic sources, magnetic anomalies pattern and geometry of magnetic sources [20]. Linear features, or lineaments, can provide important information on the extension of deformation zones in the bedrock.
The magnetic susceptibility of rocks is often low in strongly deformed, fractured, altered or porous bedrock due to destruction of ferromagnetic minerals, which forms a basis for magnetic lineament interpretation. Linear topographic lows can indicate depressions in the bedrock related to brittle deformation zones along which the bedrock is more easily eroded [21].
On the basis of the variation in magnetic intensity across the study area, there appears a general decrease in the intensity from the center to northeastern and to the southwestern part of the study area. In the study are, the larger magnetic intensity is aligned from northwest to southeast direction. The interpretation of the magnetic data acquired on the study area showed the varying amplitudes of the anomaly signature, which implies that the magnetic body source is not evenly distributed along the respective profile across the study area. The presence of weak zones in the study area is demonstrated by this unevenly distributed magnetic reading.
Correlation of electrical resistivity tomography, magnetic anomaly profiles and geology
Finally, the results obtained from ERT section along the profiles that shows horizontal stratification was integrated with the subsurface geologic information of boreholes to constrain four distinct stratigraphic units. These units are, top red clay, clay soil, highly fractured and weathered basalt and highly weathered basalt. These materials have resistivity values between 53.6 and 1 ohm-m.
The lithostratigraphic details from the borehole data were integrated into these ERT profiles and total magnetic anomaly profiles as shown in the Figure 15.
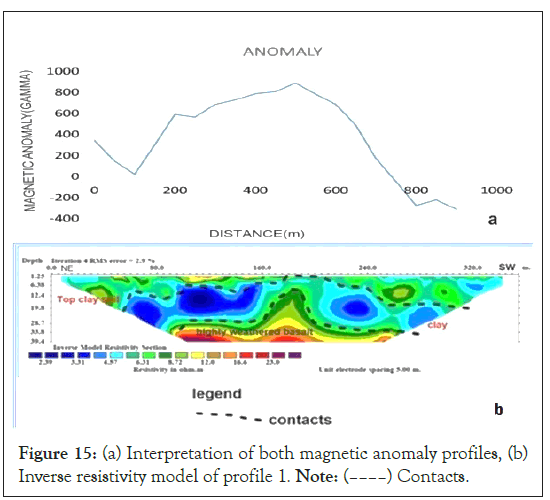
Figure 15: (a) Interpretation of both magnetic anomaly profiles, (b)
Inverse resistivity model of profile 1. Note: ( ) Contacts.
Linear features, also known as lineaments, can help to determine the extent of deformation zones in the bedrock. Related to the destruction of ferromagnetic minerals, the magnetic susceptibility of rocks is always poor in strongly deformed, broken, altered, or porous bedrock, which forms the basis for magnetic lineament interpretation.
Linear topographic drops often indicate bedrock depressions. The individual profile analysis of the magnetic field plots (Figures 15a-20a), indicates variable anomalies, indicating a contrast in susceptibility between rock types throughout the study area. These all magnetic profiles are correlated with electrical resistivity imaging along each profile.
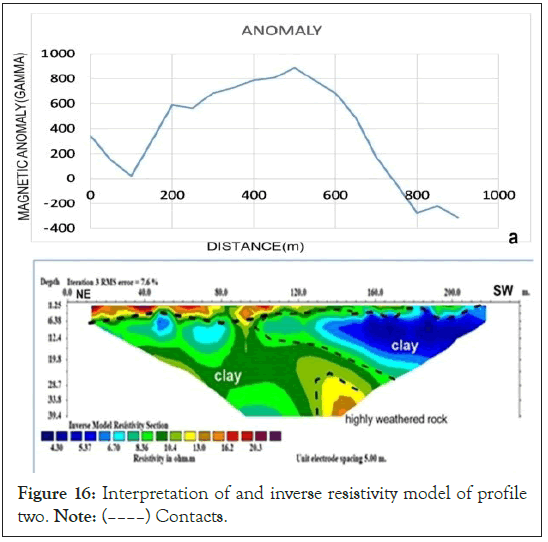
Figure 16: Interpretation of and inverse resistivity model of profile
two. Note: ( ) Contacts.
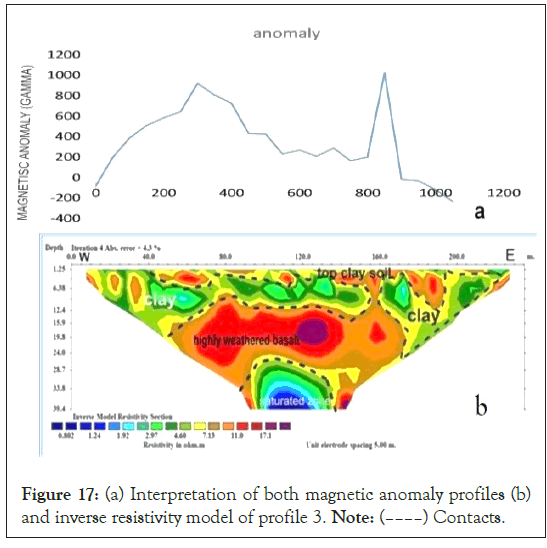
Figure 17: (a) Interpretation of both magnetic anomaly profiles (b)
and inverse resistivity model of profile 3. Note: ( ) Contacts.
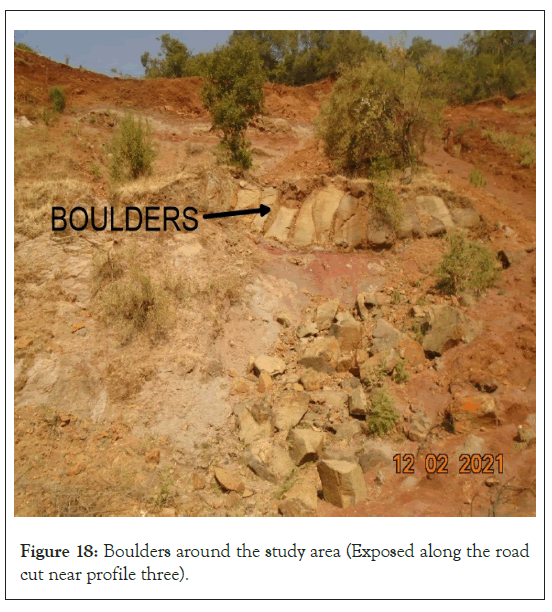
Figure 18: Boulders around the study area (Exposed along the road cut near profile three).
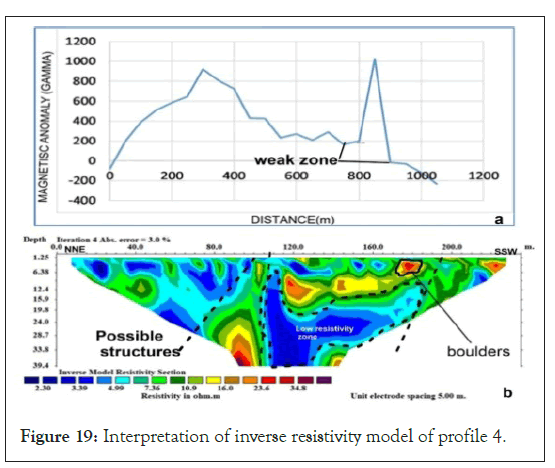
Figure 19: Interpretation of inverse resistivity model of profile 4.
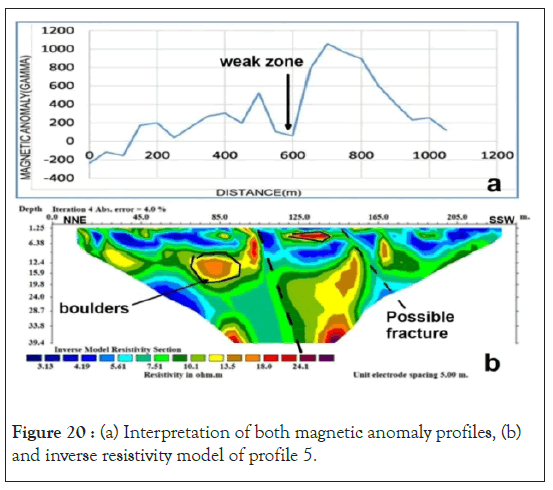
Figure 20: (a) Interpretation of both magnetic anomaly profiles, (b) and inverse resistivity model of profile 5.
Profile one shows considerable amplitude variation in the magnetic anomaly signatures. At the start of the profile, the minimum negative peak value is -200 nT, and the maximum positive peak value is 850 nT at a distance of around 375 m from the start. There is definitely a positive correlation between the magnetic anomaly plot and the 2D electrical profile in detecting the weak zones.
Profile one shows considerable amplitude variation in the magnetic anomaly signatures. The minimum negative peak value is -200 nT at a distance of 500 m and the maximum positive peak value is 800 nT at a distance of about 500 m from the beginning of the profile. The magnetic profile along the 2D electrical imaging of Profile-two was plotted as shown in the Figure 16a.
The magnetic profile along the 2D electrical imaging of Profile- two was plotted as shown in the Figure 16a. This profile shows significant amplitude variation in the magnetic anomaly signatures. The minimum negative peak value is -220 nT at a distance of 1000 m and the maximum positive peak value is 1000 nT at a distance of about 840 m from the beginning of the profile.
The magnetic profile along the 2D electrical imaging of Profile- three was plotted as shown in the Figure 17a. This profile shows considerable amplitude variation in the magnetic anomaly signatures. The minimum negative peak value is -200 nT at a distance of 40m and the maximum positive peak value is 800 nT at a distance of about 500 m from the beginning of the profile. There is indeed a positive correlation between the magnetic anomaly plot and the 2D electrical profile in detecting the weak zones.
The magnetic profile along the 2D electrical imaging of Profile- four was plotted as shown in the Figure 19a. This profile shows considerable amplitude variation in the magnetic anomaly signatures. The minimum negative peak value is -200 nT at the beginning of the profile and the maximum positive peak value is 1000 nT at a distance of about 700 m from the beginning of the profile. There is indeed a positive correlation between the magnetic anomaly plot and the 2D electrical profile in detecting the weak zones.
The 2D electrical imaging and magnetic profile along Profile- five was plotted as shown in the Figure 20a. This profile shows considerable amplitude variation in the magnetic anomaly signatures. The minimum negative peak value is -200 nT at a distance of 40 m and the maximum positive peak value is 800 nT at a distance of about 500 m from the beginning of the profile. In detecting weak areas, there is a strong correlation between the magnetic anomaly plot and the 2D electrical profile.
The magnetic profile along the 2D electrical imaging of Profile- six was plotted as shown in the Figure 21a. This profile shows considerable amplitude variation in the magnetic anomaly signatures. The minimum negative peak value is -200 nT at the beginning of the profile and the maximum positive peak value is 1000 nT at a distance of about 600 m from the beginning of the profile. There is a strong correlation between the magnetic anomaly plot and the 2D electrical profiles in detecting weak zones (Figure 22).
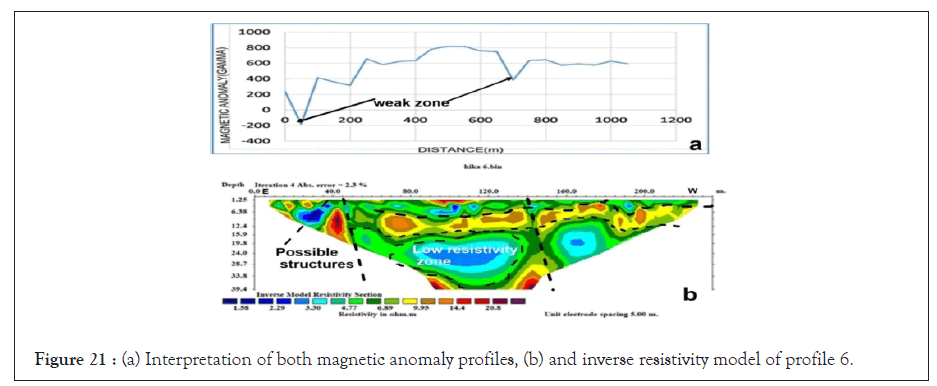
Figure 21: (a) Interpretation of both magnetic anomaly profiles, (b) and inverse resistivity model of profile 6.
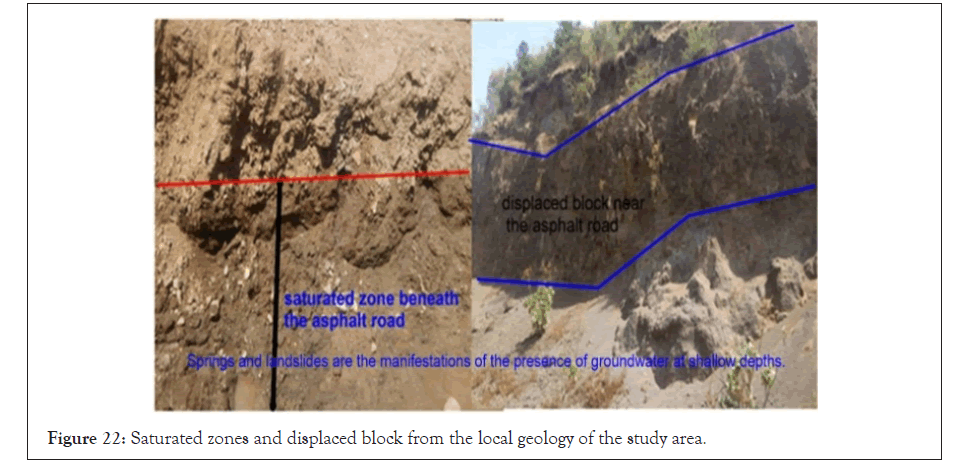
Figure 22: Saturated zones and displaced block from the local geology of the study area.
Based on the investigations conducted in this study the following conclusions are forwarded. From the interpreted geoelectrical sections and magnetic data the studied of subsurface was characterized. Inverse resistivity models and magnetic results were integrated to delineate geologic structures or weak plane features.
The geologic materials found in the study area are generally low resistivity materials. The apparent resistivity values for all the profiles ranged from from1 Ωm to 53.6 Ω. Factors such as porosity, conductivity, saturation, clay content, lithology, and temperature can affect the ability of different materials to conduct electrical current.
Geologic materials with this range of resistivity characterize the study area. A displaced lithological unit, along a road cut is exposed in the study area's NE corner, indicating that the area is heavily influenced by structures or poor planes.
In this study, integrated geophysical investigation of failed segments of Gedo-Ijaji asphalt road has been carried out to identify the geological factors that may have influenced the continuous failure of the road. The results obtained from geophysical survey to investigate causes of road failures, identifies the possible causes of the road failure in volcanic area and the weathered product of this volcanic rocks. These weathered products include clay/clayey nature of the topsoil/sub-grade soil on which the road pavement is founded. These top red clay soil/sub-grade soils have tendency of absorbing water which makes it swell and collapse under imposed wheel load stress which successively lead to road failure, existence of near surface linear features like faults, fractured zones, joints and buried stream channels. These all discontinuities and layered soil types and weathered rock units were clearly mapped on profile two, profile three and profile six. The anomaly signature varies in amplitude depending on the magnetic data acquired on the study area, implying that the magnetic body source is not evenly distributed along the respective profile across the study area. This unevenly distributed magnetic reading indicates the presence of weak zones in the study area.
General thickness of clay soil layer varies from 4 to 12 m in all profiles. Water seepage and accumulation are facilitated by structurally poor areas in the subsoil under the road pavement. As a result, as seen at failed segments, excessive cutting into the near-surface low resistivity water-absorbing clay enriched rock layer causes pavement failure (weathered layer). The findings of the investigation generally showed that the collapsed road was caused by thick clay soil, shallow groundwater and weak zones underneath the subsurface. The investigated discontinuities (fractures and cracks) cause the road failure.
Citation: Feyisa HN, Gebissa FT (2023) Geophysical Investigation of Road Failure: A Case Study of Gedo-Ijaji Asphalt Road, Oromia Regional State, Ethiopia. J Geol Geophys. 12:1081.
Received: 27-Feb-2023, Manuscript No. JGG-23-21967; Editor assigned: 01-Mar-2023, Pre QC No. JGG-23-21967 (PQ); Reviewed: 15-Mar-2023, QC No. JGG-23-21967; Revised: 22-Mar-2023, Manuscript No. JGG-23-21967 (R); Published: 29-Mar-2023 , DOI: 10.35248/2381-8719.23.12.1081
Copyright: © 2023 Feyisa HN, et al. This is an open-access article distributed under the terms of the Creative Commons Attribution License, which permits unrestricted use, distribution, and reproduction in any medium, provided the original author and source are credited.