International Journal of Advancements in Technology
Open Access
ISSN: 0976-4860
ISSN: 0976-4860
Research Article - (2023)Volume 14, Issue 1
The Geoid surface is an equipotential surface that approximately coincides with the mean sea level. Therefore, modelling of such surface will speed up and assist the rising necessities in modern surveying and mapping practices which will further help in planning and management. This research work is based on the development of a regional Geoid undulation model using Global Navigation Satellite System (GNSS) and levelling observations. The study area is taken as the Kanpur Nagar district and parts of Unnao district and Kanpur Dehat district, which covers up an area of around 25 km (East-West) × 28 km (north-south), i.e. approximately 700 km2. A network of 40 Ground Control Points (GCPs) is established in the region on which Geoid undulation is computed. A 5-fold cross-validation test is performed for selecting the best-suited interpolation method in the region. Thus, Geoid model is developed by interpolating the Geoid undulation values at 35 GCPs over the entire considered area. An accuracy of 4.4 cm was achieved after interpolation. A Geoid undulation model of 5 cm contour interval drawn shows the Geoid undulation in the region. A comparison of Geoid undulation values computed on earth gravity model 2008 with the regional Geoid undulation values by GNSS/Levelling method is also made to check the difference between the two.
Geoid; Vertical datum; Orthometric height; Ellipsoidal height; Geometric method
A datum is the reference surface using which positional measurements are made to compute the location of a point. It acts as a base for all engineering works. Most of these datums are ellipsoidal, for example World Geodetic System 1984 (WGS 84), Parametry Zemli 1990 (PZ 90), which are mathematically idealised and a close approximation of the size of the Geoid. The Geoid is a surface that is defined as an equipotential surface of the earth’s gravity field on which the direction of gravity is always perpendicular at every point on this equipotential surface. In simpler words, the Geoid is the primary reference surface for the measurement of heights [1].
There are two components of a geodetic datum, horizontal and vertical datum. The horizontal datum is used to measure the latitude and longitude (φ, λ) of a point on the surface of the earth. A vertical datum is the reference surface from which vertical positioning of a point that is height is obtained. Figure 1(a) shows the ellipsoid where the X-axis originates from the centre of the ellipsoid and passes through the intersection point of Greenwich meridian (0° longitude) and the equator. Longitude of a point P is represented as λ and latitude is represented by φ on the ellipsoid and elevation of the point P is shown, which is along the ellipsoidal normal. Ellipsoidal height is the height of a point above the ellipsoid along the ellipsoidal normal, as shown in Figure 1(a) and Figure 1(b). It can be obtained from the Global Navigational Satellite System (GNSS) observations. This height is denoted by h, whereas orthometric height is the term given to the height above the Geoid along the curved plumb line. It can be obtained by levelling observations. This height is denoted by H. This is the height of any place that corresponds to the water flow criterion. The Geoid can be estimated roughly as Mean Sea Level (MSL) surface that extends through the landmasses. Due to certain effects such as temperature (Figure 1) [2].
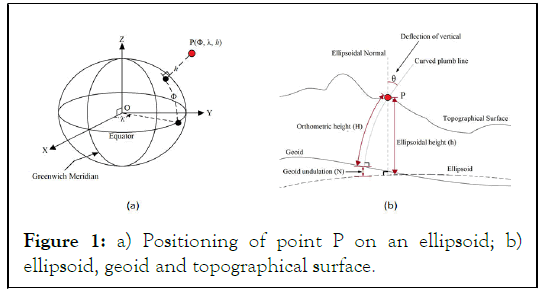
Figure 1: a) Positioning of point P on an ellipsoid; b) ellipsoid, geoid and topographical surface.
Atmospheric pressure, salinity, ocean circulation, particle content, etc., MSL can deviate from the geoid surface by a few meters. In this work, height above MSL as adopted by survey of India is assumed as orthometric height [3].
As obtaining ellipsoidal height by GNSS observation is much easier, faster and less laborious than obtaining the orthometric height by levelling. However, as the reference datum of both systems is different, geoid model can act as a solution to transform the vertical datum of the two height system as shown in the Figure 1(b).

Here, N represents geoid undulation value between geoid (approximately MSL) and WGS 84 ellipsoid. Thus by obtaining orthometric height from equation. Engineering projects incorporating MSL height determination can be optimised and an increase the efficiency and economy can also be witnessed. The objectives accomplished in this work are as follows:
• Establishment of Ground Control Points (GCPs).
• Collect co-ordinate data by GNSS observations and MSL data by levelling observation of all GCPs.
• Analyse the data and modelling of geoid in the region considered.
Area of study
Square shape area of 700 km2 (25 km (east-west) × 28 km (northsouth)) was selected with the IIT Kanpur campus approximately in the centre. Figure 2 shows the area of study. The reddish region is the Kanpur city area, and the river Ganges flows through the region shown in blue [4].
The latitudinal extent (north to south) of the area is 26°38’6” N to 26°22’48” N, and longitudinal extent (east to west) of the area is 80°07’30” E to 80°21’54” E (Figures 2 and 3).
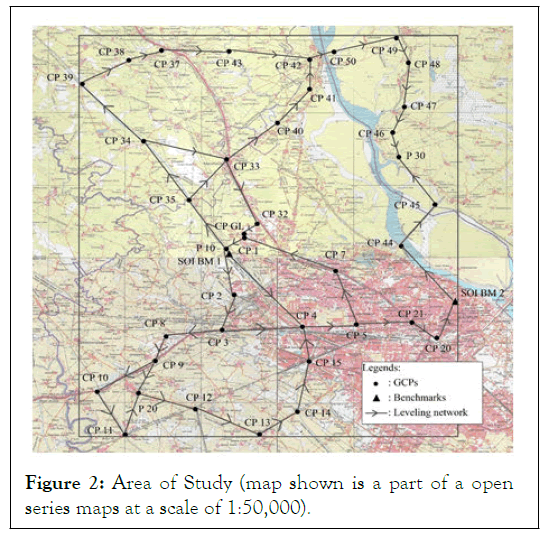
Figure 2: Area of Study (map shown is a part of a open series maps at a scale of 1:50,000).
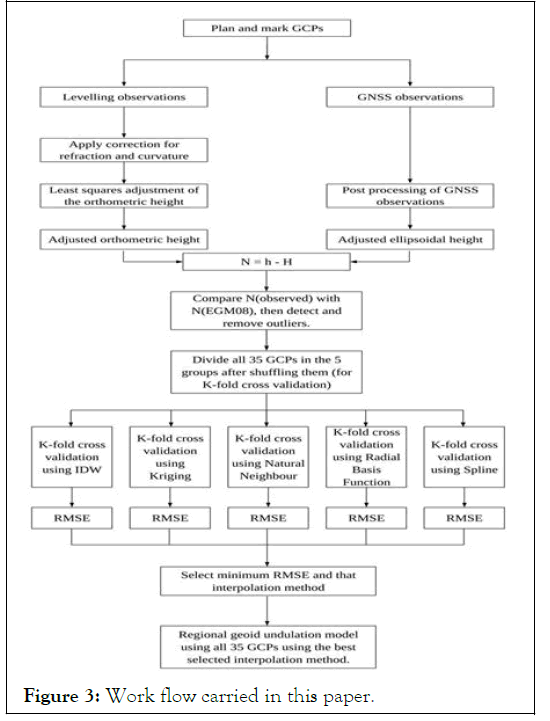
Figure 3: Work flow carried in this paper.
Planning and GCP marking
The city of Kanpur lies in Indo-Gangetic plain region, so not much topographical variations of high magnitude are seen such as mountains or hills. Moreover, the area taken for the study purpose is also small. Thus an assumption is made that not large ups and downs in geoid will be seen in this area of study. As mentioned above, in section 2, an approximate square area of 25 km (E-W) by 28 km (N- S) was selected with IIT Kanpur campus in the middle of the selected area using Google earth software. Some 30 points were marked in a systematic way of 6 × 5, as shown in Figure 4. How-ever, since this point marking was done without any ground knowledge that’s why many points pointed in lakes, rivers, roofs etc. In order to ac-quire GNSS observations and levelling observa tions, these points were needed to be marked at a place that can have better accessibility. To correct this problem and to get a preliminary idea about the area of study, reconnaissance survey was done [5]. In the reconnaissance survey, by using paint and brush, temporary points were made at suitable places in the area of study. A short description narrating well the location and position of the paint marking was also documented (Figure 4).
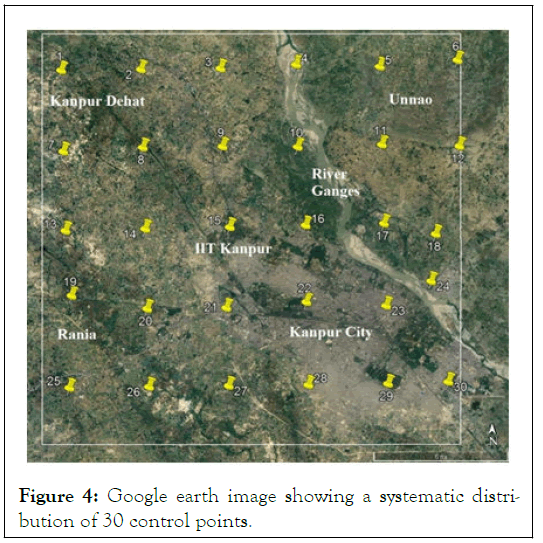
Figure 4: Google earth image showing a systematic distribution of 30 control points.
Figure 5 shows paint markings made during the reconnaissance survey. During this stage, many new points were introduced, and many earlier points (made on Google earth) were dropped off. In total, 40 GCPs marked throughout the region (Figure 5) [6].
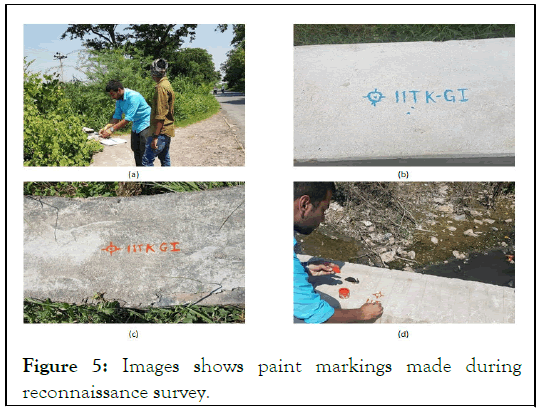
Figure 5: Images shows paint markings made during reconnaissance survey.
During paint markings, following things were taken care:
• Signals coming from satellites should have minimum possible hindrances and a broad clear view to the sky should be made possible in order to incorporate more number of satellites.
• All marked points should have easy accessibility so that levelling observation can be carried out smoothly.
• Stability of GCPs and its long life is vital as it will be used in posterity, so it is desired that these points remain intact at their positions. Thus, structures that were unlikely to be destroyed in this course of time were chosen. These structures included culverts, religious monuments, or government buildings/institutions. Temporary points were made permanent points after the reconnaissance work by using a hammer-drill and anchor-bolt (at some place marking was done using chisel and hammer due to technical problems).
All 40 GCPs marked in the area with levelling loops connecting them can be seen in Figure 2. Figure 6 shows the GCPs after permanent marking (Figure 6).
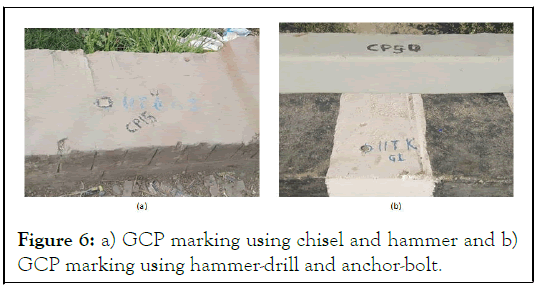
Figure 6: a) GCP marking using chisel and hammer and b) GCP marking using hammer-drill and anchor-bolt.
GNSS observations and baseline processing
After permanent marking of all GCPs, GNSS observations were taken on all 40 of them. For this purpose, base station was taken as the Trimble’s net R 5 installed at GPS observatory near IIT Kanpur’s airstrip. The Easting, Northing, up coordinates of the base receiver retrieved from geo-informatics laboratory of IIT Kanpur. Three rover receivers (Trimble’s R 10; a dual frequency geodetic receiver) were set up at three different GCPs which simultaneously observed satellites and gathered data for 45 minutes (as the shared interval between them) with 10 seconds as logging interval [7]. Three receivers gathering data simultaneously will form more baselines, thus more redundancies during baseline processing. In Figure 7, different baselines formed can be seen, which increased the redundancies in observations. After the post-processing of all the baselines using Trimble’s business centre, geodetic latitude, geodetic longitude and ellipsoidal height at all the GCPs were obtained.
Leveling observations and associated misclosures
In levelling operation, heights from a known benchmark (Survey of India Great Trigonometrical Survey (GTS) benchmark) was used to transfer reduced level to all the GCPs. Trimble’s digital level is used for this purpose. Levelling loops along with the associated misclosures are shown in Figure 8 differential levelling is opted due to certain limitations such as a large area was required to be covered, time for the data collection was constrained, and the number of people involved in levelling operation was also very less (Figures 7-13) [8].
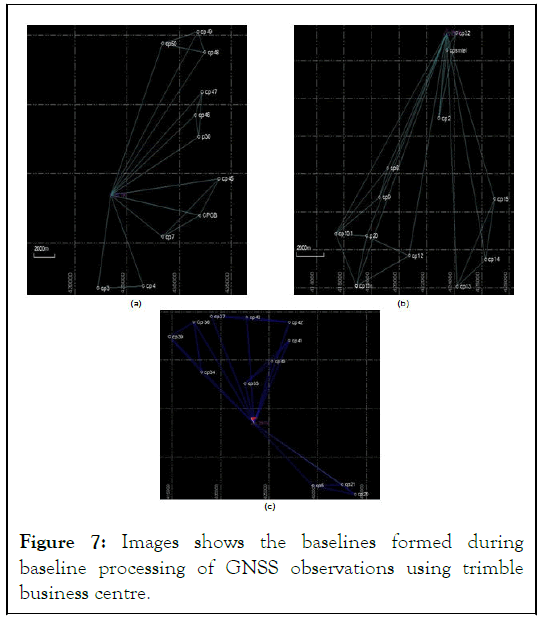
Figure 7: Images shows the baselines formed during baseline processing of GNSS observations using trimble business centre.
Levelling loop 1:
• Length=28 km
• Misclosure=6.4 cm
• Differential levelling done corresponds to double tertiary standard of spirit leveling
• Redundant level route from CP 1 to SOI BM 1 and another from SOI BM 1 to CP 4
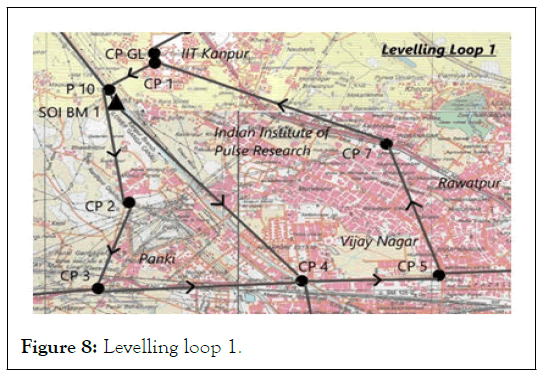
Figure 8: Levelling loop 1.
Levelling loop 2:
• Length=33 km
• Misclosure=4.1 cm
• Differential levelling done corresponds to double tertiary standard of spirit leveling
• Redundant level route from CP 9 to P 20
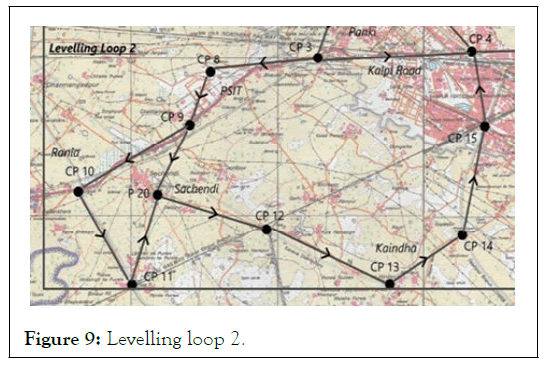
Figure 9: Levelling loop 2.
Levelling loop 3:
• Length=9.5 km
• Misclosure=0.3 cm
• Differential levelling done corresponds to secondary levelling standard of spirit leveling
• CP 21 was observed twice i.e. once in direction from CP 5 to CP 20 and then second time during returning from CP 20 to CP 5
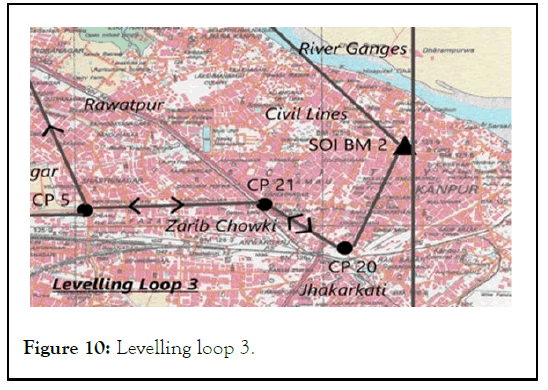
Figure 10: Levelling loop 3.
Levelling loop 4:
• Length=27 km
• Misclosure=1.8 cm
• Differential levelling done corresponds to secondary levelling standard of spirit leveling
• A redundant level route from CP 35 to CP 33
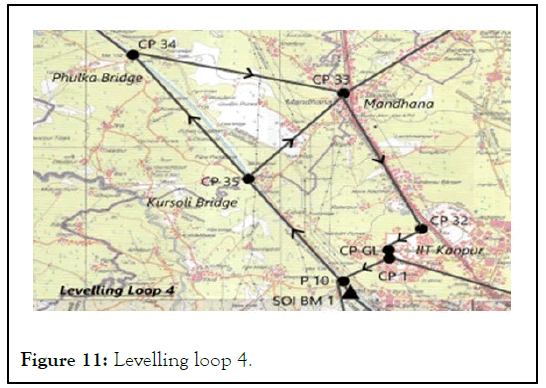
Figure 11: Levelling loop 4.
Levelling loop 5:
• Length=27.6 km
• Misclosure=2.3 cm
• Differential levelling done corresponds to secondary levelling standard of spirit leveling
• This levelling loop was started after bowditch adjustment from CP 34 and ended at CP 33
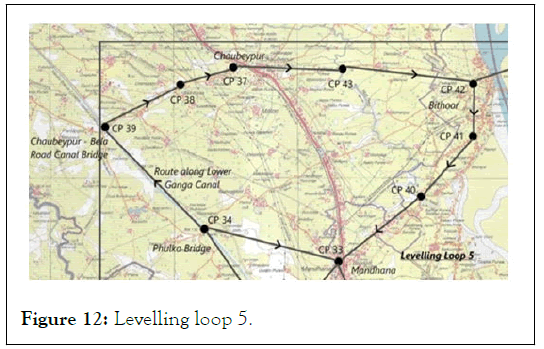
Figure 12: Levelling loop 5.
Levelling loop 6: Conducted in two parts. Part one: Connected CP 20 to SOI BM 2. Misclosure found to be 21.4 cm. Reason for this mismatch at the GTS benchmark can be its settlement due to the disturbances it must have received since this benchmark was established in 1914 (100 years old) and also many buildings have been constructed near it so, considering SOI BM 2 as another control point and renaming it as CPBM. This height was then taken to continue the second part of the levelling loop 6. Part two: This part of levelling loop was done in two directions simultaneously by two teams of two people in each team. First direction of levelling was done from CP 42 up till P 30 and second in the direction starting from CPBM (SOI BM 2) up till P 30. The closing error at the P 30 came out to be 6.5 cm. Which means that the differential levelling done corresponds to double tertiary levelling standard of spirit levelling. Due to the flow of the river Ganges which completely isolated levelling loop 6 (except at ends), no redundant levelling observation was possible (Figure 13) [9].
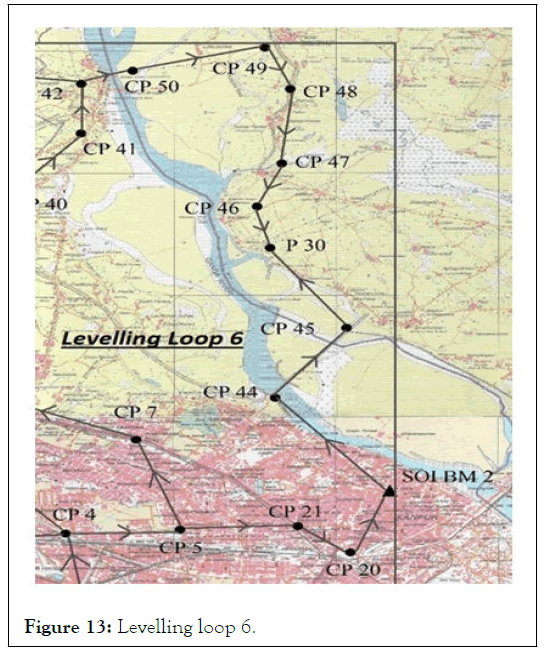
Figure 13: Levelling loop 6.
After refraction and curvature corrections, adjustment of levelling network; shown in Figure 2, was done by least squares adjustment using the observation equation model to obtain orthometric height all the GCPs.
Computation of Geoid undulation
In this work, geoid undulation from earth gravity model 2008 is used for the comparison purpose of Geoid undulation computed from GNSS/Leveling method (NObs). EGM 2008 is a spherical harmonic model of the earth’s gravitational potential which is complete to degree and order 2159 and contains additional coefficients up to degree 2190 and order 2159. Computation details for the geoid undulation from these models can be found in. The geoid undulation on EGM 2008 (NEGM 2008) can be obtained by the equation (2) given below [10].

Here,
G: Gravitational constant,
M: Mass of the earth,
r: Geometric distance between the centre of earth and the computation point,
θ, λ: Spherical co-latitude, spherical co-longitude,
Aref: Equatorial scale factor of the geo-potential model,
Pnm (cos θ): Fully normalized Legendre’s function for degree n and order m,
Cnm, Snm: Fully normalized spherical harmonic coefficients after reduction by the even zonal harmonics of the reference ellipsoid,
Nmax: Finite maximum degree of a geo-potential model.
In this work, geoid undulation from EGM 2008 was obtained from geoid eval utility version 1.5 which is freely available. The height of the geoid is computed using interpolation in a grid of values of EGM 2008 above the WGS 84 ellipsoid with the RMSE of 1 mm in the interpolated height [11].
Considering the horizontal axis (y=0) as NEGM 2008 and black and red dots as discrete values of nobserved, a bias is observed between the nobserved and NEGM 2008 which generally ranges from 66.2 cm to 82.4 cm, except on five points (Table 1). On these five points (CP 48, CP 47, CP 46, P 30, CP 45), biases observed are more than 1 m. It is already known that geoid is a medium wavelength surface and do not shows an abrupt change at any place (Figure 14). This must be due to some technical errors that must have taken place during the levelling operation. It was also found that road construction work also started in the area in the time duration between the observation of ellipsoidal height by GNSS receivers and orthometric height by digital level. Figure 14 shows the bias at each GCPs in NObserved on comparison with NEGM 2008.
| S.No. | GCPs | Latitude | Longitude | Ellipsoidal height (m) | Orthometric height (m) | NObserved | Negm 2008 | NObserved-NEGM 2008 |
|---|---|---|---|---|---|---|---|---|
| 1 | SOI BM 1 | 26°30’7.916” | 80°13’25.298” | 64.779 | 128.89 | -64.111 | -63.364 | -0.747 |
| 2 | CP BM | 26°28’9.444” | 80°20’49.032” | 59.411 | 123.686 | -64.275 | -63.496 | -0.779 |
| 3 | P 10 | 26°30’17.831” | 80°13’19.776” | 67.35 | 131.464 | -64.114 | -63.368 | -0.746 |
| 4 | CP 1 | 26°30’40.496” | 80°13’55.246” | 63.95 | 128.023 | -64.073 | -63.403 | -0.67 |
| 5 | CP 2 | 26°28’42.841” | 80°13’35.363” | 62.067 | 126.076 | -64.009 | -63.302 | -0.707 |
| 6 | CP 3 | 26°27’30.386” | 80°13’11.394” | 61.762 | 125.76 | -63.998 | -63.234 | -0.764 |
| 7 | CP 4 | 26°27’36.698” | 80°15’48.865” | 66.904 | 130.915 | -64.011 | -63.313 | -0.698 |
| 8 | CP 5 | 26°27’41.588” | 80°17’34.917” | 61.198 | 125.338 | -64.14 | -63.366 | -0.774 |
| 9 | CP 7 | 26°29’32.013” | 80°16’54.090” | 64.027 | 128.126 | -64.099 | -63.437 | -0.662 |
| 10 | CP GL | 26°30’48.802” | 80°13’54.757” | 64.031 | 128.166 | -64.135 | -63.409 | -0.726 |
| 11 | CP 21 | 26°27’45.745” | 80°19’23.869” | 63.675 | 127.802 | -64.127 | -63.42 | -0.707 |
| 12 | CP 20 | 26°27’13.639” | 80°20’12.525” | 62.733 | 126.841 | -64.108 | -63.416 | -0.692 |
| 13 | CP 8 | 26°27’16.716” | 80°11’21.589” | 61.943 | 125.824 | -63.881 | -63.167 | -0.714 |
| 14 | CP 9 | 26°26’26.300 | 80°11’00.390” | 64.636 | 128.49 | -63.854 | -63.114 | -0.74 |
| 15 | CP 10 | 26°25’22.592” | 80°09’06.363” | 66.09 | 129.873 | -63.783 | -63.001 | -0.782 |
| 16 | CP 11 | 26°23’53.975” | 80°10’01.256” | 65.29 | 129.015 | -63.725 | -62.957 | -0.768 |
| 17 | P 20 | 26° 25’19.570” | 80°10’ 27.502” | 63.877 | 127.686 | -63.809 | -63.042 | -0.767 |
| 18 | CP 12 | 26°24’46.525” | 80°12’18.876” | 62.261 | 126.075 | -63.814 | -63.071 | -0.743 |
| 19 | CP 13 | 26°23’54.334” | 80°14’25.026” | 61.275 | 125.093 | -63.818 | -63.087 | -0.731 |
| 20 | CP 14 | 26°24’41.093” | 80°15’39.263” | 61.469 | 125.356 | -63.887 | -63.16 | -0.727 |
| 21 | CP 15 | 26°26’25.143” | 80°16’02.143” | 62.325 | 126.304 | -63.979 | -63.26 | -0.719 |
| 22 | CP 35 | 26°31’58.775” | 80°12’06.646” | 67.774 | 131.934 | -64.16 | -63.407 | -0.753 |
| 23 | CP 34 | 26°34’00.542” | 80°10’37.528 | 68.529 | 132.753 | -64.224 | -63.444 | -0.78 |
| 24 | CP 33 | 26°33’22.893” | 80°13’20.067” | 62.928 | 127.164 | -64.236 | -63.503 | -0.733 |
| 25 | CP 32 | 26°31’09.601” | 80°14’20.136” | 60.937 | 125.084 | -64.147 | -63.437 | -0.71 |
| 26 | CP 39 | 26°35’58.840” | 80°08’37.251” | 69.735 | 133.918 | -64.183 | -63.455 | -0.728 |
| 27 | CP 38 | 26°36’48.195” | 80°10’08.467” | 65.574 | 129.848 | -64.274 | -63.535 | -0.739 |
| 28 | CP 37 | 26°37’08.135” | 80°11’12.686” | 64.464 | 128.841 | -64.377 | -63.583 | -0.794 |
| 29 | CP 43 | 26°37’06.394” | 80°13’25.009” | 57.226 | 121.67 | -64.444 | -63.658 | -0.786 |
| 30 | CP 42 | 26°36’49.151” | 80°16’03.460” | 57.868 | 122.382 | -64.514 | -63.738 | -0.776 |
| 31 | CP 41 | 26°35’48.237” | 80°16’03.165” | 60.382 | 124.848 | -64.466 | -63.696 | -0.77 |
| 32 | CP 40 | 26°34’38.248” | 80°15’00.087” | 58.589 | 122.978 | -64.389 | -63.611 | -0.778 |
| 33 | CP 50 | 26°37’05.174” | 80°16’51.087” | 56.235 | 120.835 | -64.6 | -63.776 | -0.824 |
| 34 | CP 49 | 26°37’33.620” | 80°18’53.511” | 54.424 | 119.087 | -64.663 | -63.858 | -0.805 |
| 35 | CP 48 | 26°36’42.932” | 80°19’16.925” | 54.194 | 119.101 | -64.907 | -63.834 | -1.073 |
| 36 | CP 47 | 26°35’11.437” | 80°19’09.080” | 51.815 | 116.696 | -64.881 | -63.765 | -1.116 |
| 37 | CP 46 | 26°34’18.610” | 80°18’46.227” | 57.638 | 122.439 | -64.801 | -63.714 | -1.087 |
| 38 | P 30 | 26°33’27.695” | 80°18’58.290” | 57.52 | 122.27 | -64.75 | -63.68 | -1.07 |
| 39 | CP 45 | 26°31’49.475” | 80°20’08.911” | 55.721 | 120.437 | -64.716 | -63.638 | -1.078 |
| 40 | CP 44 | 26°30’23.423” | 80°19’02.932” | 54.965 | 119.301 | -64.336 | -63.539 | 0.797 |
Note: Ellipsoidal height, orthometric height, geoid undulations and their differences are in metres
Table 1: Data observed at all GCPs during survey.
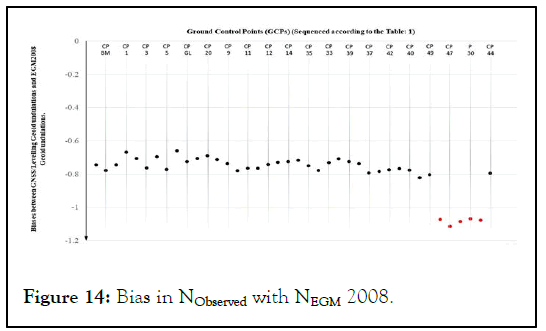
Figure 14: Bias in NObserved with NEGM 2008.
Thus, considering these five points as outliers in the observations data and ignoring them. During adjustment of the levelling network, due to these erroneous observations some errors must have been incorporated in the adjusted orthometric height of other GCPs. To deal with this, re-adjustment of the whole levelling network was performed again without considering the erroneous GCPs. Thus, the number of GCPs in the area reduced from 40 to 35. Table 2 presents the re-adjusted orthometric height along with the final data used for developing Geoid undulation modelling (NObserved-2), which came after the re-adjustment of levelling network again by least squares adjustment using observation equation method [12]. All 35 GCPs were then shuffled up and divided into five groups. Each group consisting of seven GCPs (Table 3). Fivefold crossvalidation test was done to check and select the best interpolation technique that will best suit for geoid modelling in the area. It was done by taking four groups as training data-set and remaining one group as testing data-set (this was done five times making every group as testing data-set for once). Average Root Mean Square Error (RMSE) of the five RMSEs obtained was considered as the RMSE of that interpolation technique. This check was applied on five interpolation methods which are [13].
• Inverse distance weighted
• Kriging
• Spline
• Natural neighbour
• Radial function interpolation
Results of this test on IDW are shown from Figures 15-19 and Tables 4-8.
| Group 1 | Group 2 | Group 3 | Group 4 | Group 5 |
|---|---|---|---|---|
| SOI BM 1 | CP 20 | CP 37 | CP 13 | CP 40 |
| CPBM | CP 39 | CP 11 | CP 49 | CP 50 |
| CP 10 | CP 5 | CP 9 | CP 33 | CP 12 |
| CP 35 | CP 32 | CP 14 | CP 7 | CP 2 |
| CP 1 | CPGL | CP 42 | CP 43 | CP 38 |
| CP 3 | CP 8 | P 10 | CP 15 | CP 34 |
| CP 4 | P 20 | CP 44 | CP 41 | CP 21 |
Table 2: Five groups of GCPs divided after shuffling for interpolation testing.
| S.No. | GCPs | Latitude | Longitude | Ellipsoidal height (m) | Re-adjusted orthometric height (m) | NObserved-2 | NEGM 2008 | NObserved-2-NEGM 2008 |
|---|---|---|---|---|---|---|---|---|
| 1 | SOI BM 1 | 26°30’07.916” | 80°13’25.298” | 64.779 | 128.89 | -64.111 | -63.364 | -0.747 |
| 2 | CP BM | 26°28’29.444” | 80°20’49.032” | 59.411 | 123.692 | -64.281 | -63.496 | -0.785 |
| 3 | P 10 | 26°30’17.831” | 80°13’19.776” | 67.35 | 131.464 | -64.114 | -63.368 | -0.746 |
| 4 | CP 1 | 26°30’40.496” | 80°13’55.246” | 63.95 | 128.022 | -64.072 | -63.403 | -0.669 |
| 5 | CP 2 | 26°28’42.841” | 80°13’35.363” | 62.067 | 126.073 | -64.006 | -63.302 | -0.704 |
| 6 | CP 3 | 26°27’30.386” | 80°13’11.394” | 61.762 | 125.755 | -63.993 | -63.234 | -0.759 |
| 7 | CP 4 | 26°27’36.698” | 80°15’48.865” | 66.904 | 130.907 | -64.003 | -63.313 | -0.69 |
| 8 | CP 5 | 26°27’41.588” | 80°17’34.917” | 61.198 | 125.324 | -64.126 | -63.366 | -0.76 |
| 9 | CP 7 | 26°29’32.013” | 80°16’54.090” | 64.027 | 128.118 | -64.091 | -63.437 | -0.654 |
| 10 | CP GL | 26°30’48.802” | 80°13’54.757” | 64.031 | 128.165 | -64.134 | -63.409 | -0.725 |
| 11 | CP 21 | 26°27’45.745” | 80°19’23.869” | 63.675 | 127.783 | -64.108 | -63.42 | -0.688 |
| 12 | CP 20 | 26°27’13.639” | 80°20’12.525” | 62.733 | 126.809 | -64.076 | -63.416 | -0.66 |
| 13 | CP 8 | 26°27’16.716” | 80°11’21.589” | 61.943 | 125.819 | -63.876 | -63.167 | -0.709 |
| 14 | CP 9 | 26°26’26.300 | 80°11’00.390” | 64.636 | 128.484 | -63.848 | -63.114 | -0.734 |
| 15 | CP 10 | 26°25’22.592” | 80°09’06.363” | 66.09 | 129.863 | -63.777 | -63.001 | -0.776 |
| 16 | CP 11 | 26°23’53.975” | 80°10’01.256” | 65.29 | 129.009 | -63.719 | -62.957 | -0.762 |
| 17 | P 20 | 26°25’19.570” | 80°10’27.502” | 63.877 | 127.679 | -63.802 | -63.042 | -0.76 |
| 18 | CP 12 | 26°24’46.525” | 80°12’18.876” | 62.261 | 126.069 | -63.808 | -63.071 | -0.737 |
| 19 | CP 13 | 26°23’54.334” | 80°14’25.026” | 61.275 | 125.086 | -63.811 | -63.087 | -0.724 |
| 20 | CP 14 | 26°24’41.093” | 80°15’39.263” | 61.469 | 125.349 | -63.88 | -63.16 | -0.72 |
| 21 | CP 15 | 26°26’25.143” | 80°16’02.143” | 62.325 | 126.296 | -63.971 | -63.26 | -0.711 |
| 22 | CP 35 | 26°31’58.775” | 80°12’06.646” | 67.774 | 131.943 | -64.169 | -63.407 | -0.762 |
| 23 | CP 34 | 26°34’00.542” | 80°10’37.528 | 68.529 | 132.767 | -64.238 | -63.444 | -0.794 |
| 24 | CP 33 | 26°33’22.893” | 80°13’20.067” | 62.928 | 127.178 | -64.25 | -63.503 | -0.747 |
| 25 | CP 32 | 26°31’09.601” | 80°14’20.136” | 60.937 | 125.088 | -64.151 | -63.437 | -0.714 |
| 26 | CP 39 | 26°35’58.840” | 80°08’37.251” | 69.735 | 133.937 | -64.202 | -63.455 | -0.747 |
| 27 | CP 38 | 26°36’48.195” | 80°10’08.467” | 65.574 | 129.87 | -64.296 | -63.535 | -0.761 |
| 28 | CP 37 | 26°37’08.135” | 80°11’12.686” | 64.464 | 128.865 | -64.401 | -63.583 | -0.818 |
| 29 | CP 43 | 26°37’06.394” | 80°13’25.009” | 57.226 | 121.698 | -64.472 | -63.658 | -0.814 |
| 30 | CP 42 | 26°36’49.151” | 80°16’03.460” | 57.868 | 122.415 | -64.547 | -63.738 | -0.809 |
| 31 | CP 41 | 26°35’48.237” | 80°16’03.165” | 60.382 | 124.877 | -64.495 | -63.696 | -0.799 |
| 32 | CP 40 | 26°34’38.248” | 80°15’00.087” | 58.589 | 123.04 | -64.451 | -63.611 | -0.84 |
| 33 | CP 50 | 26°37’05.174” | 80°16’51.087” | 56.235 | 120.903 | -64.668 | -63.776 | -0.892 |
| 34 | CP 49 | 26°37’33.620” | 80°18’53.511” | 54.424 | 119.168 | -64.744 | -63.858 | -0.886 |
| 35 | CP 44 | 26°30’23.423” | 80°19’02.932” | 54.965 | 119.288 | -64.323 | -63.539 | -0.784 |
Note: Thus, an average bias between NObserved-2 and NEGM 2008 is found to be 75.4 cm and standard deviation of 5.5 cm.
Table 3: Final data at remaining 35 GCPs obtained after removal of outliers and re-adjustment of levelling data.
| GCPs | NObserved-2 | NModel | Interpolation error | RMSE |
|---|---|---|---|---|
| SOI BM 1 | -64.111 | -64.114 | -0.003 | 0.073 |
| CPBM | -64.281 | -64.121 | 0.16 | |
| CP 10 | -63.777 | -63.858 | -0.081 | |
| CP 35 | -64.169 | -64.18 | -0.011 | |
| CP 1 | -64.072 | -64.134 | -0.062 | |
| CP 3 | -63.993 | -63.993 | 0 | |
| CP 4 | -64.003 | -64.043 | -0.04 |
Note: RMSE from group 1 obtained=0.073 m
Table 4: Interpolation error on group 1 set of GCPs on IDW interpolation.
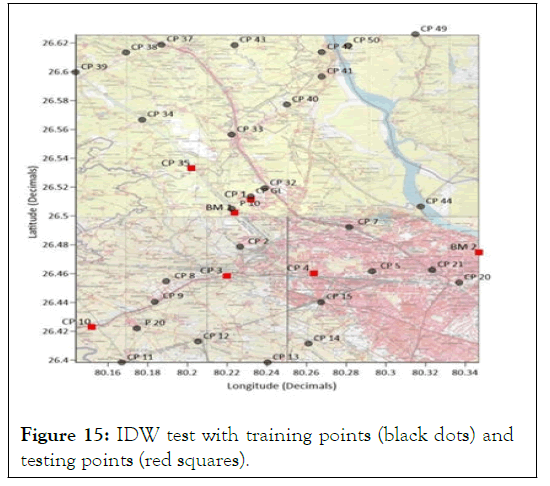
Figure 15: IDW test with training points (black dots) and testing points (red squares).
| GCPs | NObserved-2 | NModel | Interpolation error | RMSE |
|---|---|---|---|---|
| CP 20 | -64.076 | -64.151 | -0.075 | 0.059 |
| CP 39 | -64.202 | -64.277 | -0.075 | |
| CP 5 | -64.126 | -64.077 | 0.049 | |
| CP 32 | -64.151 | -64.107 | 0.044 | |
| CPGL | -64.134 | -64.076 | 0.058 | |
| CP 8 | -63.876 | -63.93 | -0.054 | |
| P 20 | -63.802 | -63.852 | -0.05 |
Note: RMSE from group 2 obtained=0.059 m
Table 5: Interpolation error on group 2 set of GCPs on IDW interpolation.
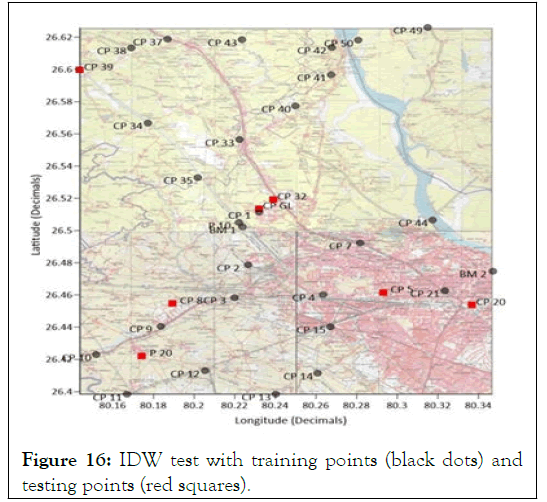
Figure 16: IDW test with training points (black dots) and testing points (red squares).
| GCPs | NObserved-2 | NModel | Interpolation error | RMSE |
|---|---|---|---|---|
| CP 37 | -64.401 | -64.294 | 0.107 | 0.104 |
| CP 11 | -63.719 | -63.873 | -0.154 | |
| CP 9 | -63.848 | -63.897 | -0.049 | |
| CP 14 | -63.88 | -64.962 | -0.082 | |
| CP 42 | -64.547 | -64.533 | 0.014 | |
| P 10 | -64.114 | -64.11 | 0.004 | |
| CP 45 | -64.323 | -64.145 | 0.178 |
Note: RMSE from group 3 obtained=0.254 m
Table 6: Interpolation error on group 3 set of GCPs on IDW interpolation.
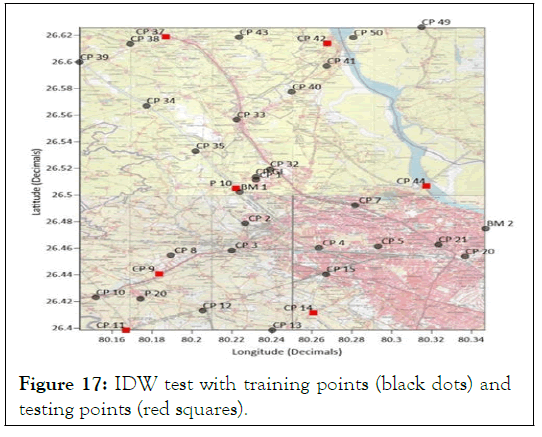
Figure 17: IDW test with training points (black dots) and testing points (red squares).
| GCPs | NObserved-2 | NModel | Interpolation error | RMSE |
|---|---|---|---|---|
| CP 13 | -63.811 | -63.935 | -0.124 | 0.146 |
| CP 49 | -64.744 | -64.417 | 0.327 | |
| CP 33 | -64.25 | -64.197 | 0.053 | |
| CP 7 | -64.091 | -64.118 | -0.027 | |
| CP 43 | -64.472 | -64.33 | 0.142 | |
| CP 15 | -63.971 | -64.021 | -0.05 | |
| CP 41 | -64.495 | -64.466 | 0.029 |
Note: RMSE from group 4 obtained=0.127 m
Table 7: Interpolation error on group 4 set of GCPs on IDW interpolation.
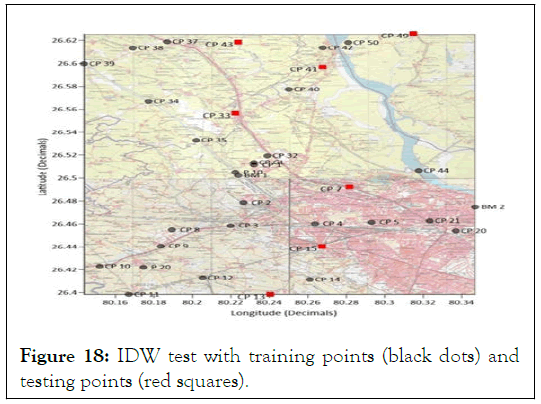
Figure 18: IDW test with training points (black dots) and testing points (red squares).
| GCPs | NObserved-2 | NModel | Interpolation error | RMSE |
|---|---|---|---|---|
| CP 40 | -64.451 | -64.317 | 0.134 | 0.093 |
| CP 50 | -64.668 | -64.497 | 0.171 | |
| CP 12 | -63.808 | -63.902 | -0.094 | |
| CP 2 | -64.006 | -64.059 | -0.053 | |
| CP 38 | -64.296 | -64.312 | -0.016 | |
| CP 34 | -64.238 | -64.197 | 0.041 | |
| CP 21 | -64.108 | -64.123 | -0.015 |
Note: RMSE from group 5 obtained=0.093 m
Table 8: Interpolation error on group 5 set of GCPs on IDW interpolation.
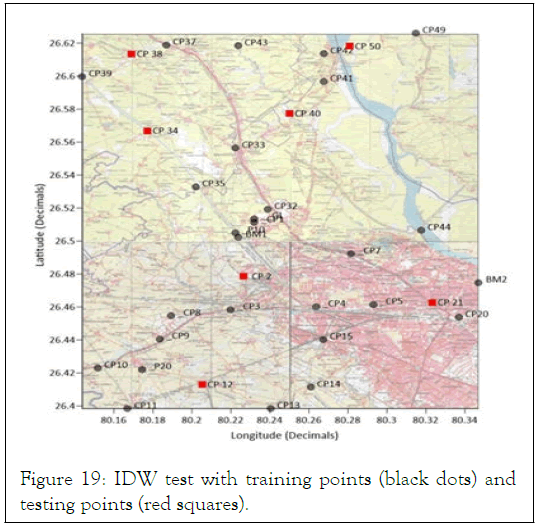
Figure 19: IDW test with training points (black dots) and testing points (red squares).
Similarly, this five fold cross validation test was applied to other interpolation techniques as mentioned above. The results thus obtained are mentioned in the Table 9.
| Interpolation method | Group 1 RMSE | Group 2 RMSE | Group 3 RMSE | Group 4 RMSE | Group 5 RMSE | Average RMSE |
|---|---|---|---|---|---|---|
| IDW | 0.073 | 0.059 | 0.104 | 0.146 | 0.093 | 0.095 |
| Kriging | 0.047 | 0.049 | 0.033 | 0.051 | 0.04 | 0.044 |
| Spline | 0.043 | 0.052 | 0.038 | 0.104 | 0.046 | 0.057 |
| Natural neighbour | 0.035 | 0.043 | 0.028 | 0.052 | 0.042 | 0.04 |
| Radial function | 0.049 | 0.055 | 0.034 | 0.036 | 0.05 | 0.045 |
Table 9: RMSE obtained after five-fold cross-validation test on each interpolation technique.
In this five-fold cross-validation test which was done on surfer 18 software (under trial version) yielded that natural neighbour interpolation gave least RMSE of 4 cm, but natural neighbour interpolation technique has a problem with extrapolation. So, many of the test points fell out of the region that was interpolated using training points almost every time. The test points that fell out of the region were generally the GCPs at the fringes of the region which might be the cause of less RMSE. Moreover, as stated above, the surface is a plain region; thus, the geoid being a medium wavelength surface does not vary abruptly in this small span. Thus, to obtain a Geoid model in the aimed area of 25 km × 28 km, a slight extrapolation will be required. Thus, kriging interpolation is selected as the best-suited interpolation technique as the average RMSE obtained was 4.4 cm. Thus kriging interpolation was used for developing geoid model shown in Figures 20 and 21 with a grid size of 10 × 10 arc-second using the data of all 35 GCPs in the area.
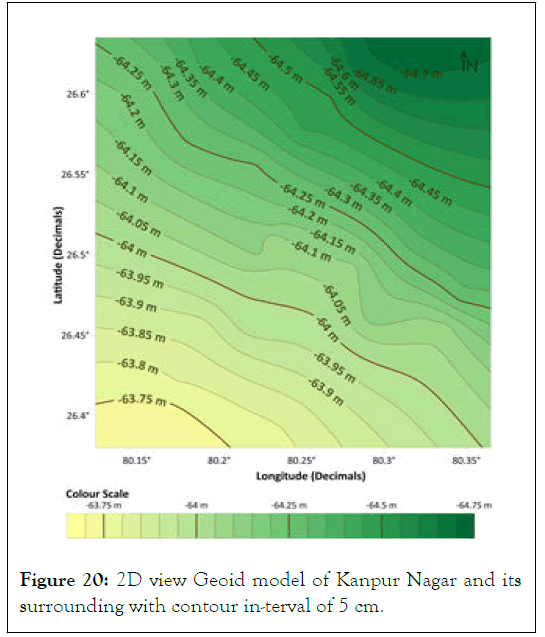
Figure 20: 2D view Geoid model of Kanpur Nagar and its surrounding with contour in-terval of 5 cm.
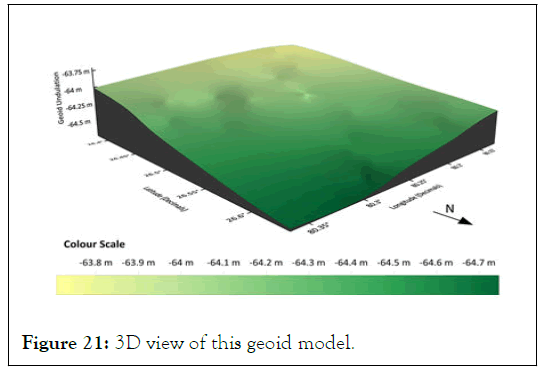
Figure 21: 3D view of this geoid model.
The regional Geoid undulation model developed using the geometric method can be used as a solution to the height datum inconsistency problem in GNSS application to obtain orthometric height directly from ellipsoidal height at any place within the area under consideration with an accuracy 4.4 cm. geoid undulation values ranged from as low as-64.744 m in the northeastern part of the region to as high as -63.719 m in the southwestern part of the region on the WGS 84 ellipsoid. 2. When this geoid undulation values computed by the GNSS/ levelling method are compared with that of on EGM 2008, an average bias of 75.4 cm is obtained with a standard deviation of 5.5 cm. Kriging interpolation method is used for developing the Geoid undulation model on a grid size of 10 × 10 arc-second using surfer 18 (under trial version). A gradual rise in the geoid model is observed in the region as one moves from the northeast part to the southwest part of the region. In the absence of a gravimetric geoid in this region, this geometric geoid undulation model can be used along ellipsoidal height to obtain the orthometric height of any point in the region without doing levelling.
I would like to express my sincere gratitude to my MTech thesis advisors Dr Onkar Dikshit and major general Dr B Nagarajan at Indian institute of technology Kanpur for their continuous guidance, advice and insight which were essential for me to resolve various bottlenecks in my work. I would like to thank the geo-informatics laboratory of IIT Kanpur for providing funds and highend equipment (such as trimble’s digital level, trimble’s R 10 GNSS receivers etc.) needed for successful completion of this work. I take this opportunity to thank golden software for proving surfer 18 (trial version) which is used for geoid modelling purpose in this work. I extend my heartfelt thanks to the anonymous reviewer (s) for their tireless and meticulous efforts in reviewing my manuscript. Last but not least; I would like to devote this work as a tribute to my Late Dadi Ji, Late Dada Ji, Nani Ji, Late Nana Ji and my entire family. Along with it, I especially thank my mother, father and my brother (Raghvendra) for their blessings and encouragement throughout my academic career.
YS Rawat, B Nagarajan, and O Dikshit designed research; YS Rawat performed research and collected data; B Nagarajan, O Dikshit and YS Rawat resolved various bottlenecks in work; YS Rawat analysed data and wrote the paper.
The datasets generated and analysed during the current study are available in the corresponding author’s MTech thesis file present in the library of Indian institute of technology Kanpur’s electronic theses and dissertations repository, but restrictions apply to the availability of these data due to the reason of repository being an intranet server, and so are not publicly available. Data are however available from the authors upon reasonable request.
Travel allowances for this work was funded by office of research and development, Indian institute of technology Kanpur.
No potential conflict of interest was reported by the authors.
[Crossref] [Google Scholar] [PubMed]
[Crossref] [Google Scholar] [PubMed]
[Crossref] [Google Scholar] [PubMed]
[Crossref] [Google Scholar] [PubMed]
[Crossref] [Google Scholar] [PubMed]
[Crossref] [Google Scholar] [PubMed]
Citation: Rawat YS, Rawat S, Dikshit O, Nagarajan B (2023) Geoid Modelling of Kanpur Nagar and Adjacent Areas Using Geometric Method. Int J Adv Technol. 14:234.
Received: 27-Dec-2022, Manuscript No. IJOAT-23-6362; Editor assigned: 29-Dec-2022, Pre QC No. IJOAT-23-6362(PQ); Reviewed: 12-Jan-2023, QC No. IJOAT-23-6362; Revised: 19-Jan-2023, Manuscript No. IJOAT-23-6362(R); Published: 27-Jan-2023 , DOI: 10.35248/ 0976-4860.23.14.234
Copyright: © 2023 Rawat YS, et al. This is an open-access article distributed under the terms of the Creative Commons Attribution License, which permits unrestricted use, distribution, and reproduction in any medium, provided the original author and source are credited.