Journal of Geology & Geophysics
Open Access
ISSN: 2381-8719
ISSN: 2381-8719
Research Article - (2017) Volume 6, Issue 1
Geochemistry features including homogenization temperature (Th), salinity (S), grains containing oil-gas inclusions (GOIs), and polarized fluorescence microscope identification of oil and gas inclusions (OGIs) of Bai 95 oil well (localized in Jilin Oil Field, Songliao Basin, Northeast China) were obtained. The oil and gas charging, maturities of palaeo oil and gas, and the features of maternal source rocks related to three strata of Bai 95 oil well were estimated. A low cost measurement system combing a common inverted fluorescence microscope (IMF) and an ultravioletvisible (UV-VIS) spectrometer together was used to measure the micro-spectra of single OGIs. A minimum focus spot with 12 μm was obtained. The fluorescence interference from background was greatly decreased by subtracting the fluorescence from background. The micro-spectra from single OGIs take more information than that of traditional fluorescence spectra. The calculated Commission Internationale de l’Éclairage (CIE) chromaticity coordinates of the single OGIs by VIS spectra are more objective than judging colors of OGIs by human eyes. The main aromatic constitutes in the single OGIs were estimated by the UV-VIS spectra. With the buried depth increasing, the fluorescence peaks have red shifts; the aromatic hydrocarbons tend to become heavy. The UV-VIS spectra showed that there may be two maternal sources charging the strata in the second episode, one is mature, the other is low mature. This result coincides with the analysis result from geochemistry. Our experimental results showed this technique is a low cost, reliable and promising technique in measuring the UV-VIS fluorescence spectra of micro samples. The main aromatic hydrocarbons, the maturity of palaeo oil gas and the features of the maternal sources can be estimated by UV-VIS micro-spectroscopy of single OGIs.
Keywords: Geochemistry features, Single oil-gas inclusions, UV-VIS micro-spectra, Chromaticity analysis, Aromatic contents, Maturities of palaeo-oils and gases
Micro-spectra are very important for OGIs because they take rich information about the palaeo-oils [1-5]. The properties of microfluorescence spectra of OGIs are largely controlled by the aromatic composites trapped in the OGIs. Generally, by analysis of the spectra, the main aromatic hydrocarbons, palaeo oil-gas maturity, and oil and gas charging history can be largely estimated [2,3,6-13]. And by the abundance of GOI [10,14], the petroleum characteristics of the corresponding stratum can be qualitatively determined.
According to the wavelength measurement range, micro fluorescence spectroscopy includes in VIS and UV-VIS spectra techniques. The VIS spectra technique includes fluorescence micro photometry (FMP), fluorescence alteration of multiple macerals (FAMM) and laser scanning confocal microscope (LSCM).
Burruss [15] described the analytical setup and method about FMP. Musgrave et al. [8] assumed separate lamp and scanning monochromator and photo multiplier tube (PMT) detector modules to obtain the luminescence and synchronously scanned luminescence spectra of single OGIs. The data collected from the technique are pertinent to evaluating systems and providing quantitative data for solving problems in oil migration and maturation determinations, oil-to-oil and oil-to-source correlations, oil degradation, and episodes and chemistry of cementation. Blanchet et al. [16] used a frequency doubler to obtain 360 nm pulse laser to excite single OGIs with size down to 1.7 μm. Alderton et al. [17] obtained the emission fluorescence spectra from individual inclusions in the range of 400-700 nm on a Zeiss UMSP 50 spectrometer with an HBO 100 Hg source, a 395 nm barrier filter and a variable aperture mask to isolate fluorescence from individual inclusions. Schubert et al. [18] acquired fluorescence spectra of the petroleum inclusions by a Leitz™MPVII spectrometer mounted on a Leitz microscope. Caja et al. [11,12] measured the fluorescence spectra of hydrocarbon inclusions by FMP. The results showed that Q580 index (580-700 nm vs. 400-580 nm areas) is very sensitive to the total composites of the petroleum. Bourdet et al. [19] measured the fluorescence spectra of petroleum inclusions over the range of 400- 900 nm with an Avantes spectrometer equipped with a thermo-electric cooled Sony charge-coupled device (CCD) detector. The spectrometer was coupled to an Olympus AX70 microscope equipped with a 100 W high pressure mercury-vapor light source. FMP was also widely used to measure the vitrinite reflectivety of coal and source rock [20,21].
Because the fluorescence colors of OGIs are related to the chemical constitutes, the colors of OGIs are seen as indicators of maturities of palaeo-oils and gases [22]. But the colors of OGIs estimated by eyes are subjective and easily influenced by the observing environments [23]. For more precise determination of the colors of OGIs, more and more authors [14,16-19] calculated the CIE chromaticity coordinates according to the FMP spectra. McLimans’s research results [6] showed that as the oils increase in maturities, the x (red) and y (green) chromaticity coordinates decrease, i.e. the fluorescence emission moves towards the blue corner of the CIE diagram. Further examples of crude oils and OGIs have been analyzed using these diagrams. Blanchet et al. [16] gave a detailed analysis of OGIs from the North Sea and calibrated oils using CIE diagrams. They observed that the fluorescence colors of inclusion oils are variable even within a single fluid inclusion assemblage and they advanced a number of explanations for this based on geological processes. Bourdet et al. [14,19] expressed the variability in fluorescence colors from OGIs by CIE diagrams. Compared to subjective observation colors of oil inclusion, the CIE method provides more consistent results [5,6,16,18].
Except for calculating CIE chromaticity coordinates by VIS spectra of OGIs, the fluorescence spectra were also correlated with the American Petroleum Institute (API) degree of chemical constitutes and other geochemistry parameters of crude oils. Stasiuk and Snowdon [24] measured the micro-fluorescence spectra of artificially synthesized hydrocarbon inclusions and natural hydrocarbon inclusions. The migration of oil and gas was revealed. Chi et al. [25], Kirkwood et al. [9], Blanchet et al. [16], and Bourdet et al. [14,19] also used the fluorescence spectral data to estimate the API gravity of the entrapped fluids.
In 1992, Wilkins et al. [26] combined laser with microscope and established FAMM technique. Wilkins et al. [26,27] assumed FAMM technique to probe the relation between vitrinite inhibiting and fluorescence intensity changing with time. The result showed that FMMA can effectively correct inhibiting effect of vitrinite reflectivity before the stage of high maturity. Lo et al. [28] and Veld et al. [29] used this technique to measure the maturity of source rock. With the help of FMMA, Xiao et al. [30] used a laser induced fluorescence microscopy (LIFM) to study the carbonate rocks with higher maturities. For the emitting wavelengths of lasers cannot match well with the absorption bands of most materials and the low safe threshold (<5 μW) of lasers to human eyes, up to date, it is not a good choice to use lasers to excite the fluorescence of single OGI. With the progress of semiconductor lasers and solid-state lasers, low cost UV and violet (375 nm and 405 nm) lasers will be stable and reliable light sources, which will be integrated with CCD based spectrometers, so it is possible to develop and implement a standard OGI measurement and analysis methodology based on fluorescence spectroscopy [5].
LSCM is a very important technique for single OGIs. By LSCM, a point light source illuminating and a point image were realized. The images have higher space resolution and good quality. By controlling the movement of the objective, LSCM can realize continues optical section by tomography similar to computed tomography (CT) [3,31,32]. After computer imaging, a 3D profile of a micro sample could be recovered [33-35]. LSCM was used to obtain precise volume ratios between liquid phase and gas phase in OGIs [36-38]. Combining homogenization temperature, gas chromatography-mass spectrometer (GC-MS) analysis and PVTsim software, the pressure of palaeo-liquid can be obtained [37,39-44]. Furthermore, the depth of the stratum existing palaeo-liquid can also be obtained by the pressure. This is meaningful to study the migration of oil, gas and reservoir formation [42]. LSCM has special superiors as resolving the fluorescent macerals with micrometer sizes (source rock and oil shale). Stasiuk [45] used LSCM to observe algae in oil shale. Although LSCM has a higher space resolution and good image quality, till now the shortest laser wavelength of semiconductor laser is 370 nm, the fluorescence of single OGI obtained by LSCM is still in the range of VIS.
By above techniques, one can only obtain VIS spectra of OGIs. But some aromatic hydrocarbons in OGIs emit UV fluorescence which cannot be measured by above methods. Pironon and Pradier [46] investigated the UV fluorescence alteration of natural and synthetic hydrocarbon fluid inclusions. The results showed that the alteration of the inclusions fluorescence depends both on the nature of the oil and on the nature of the host crystal. There is no significant alteration for inclusions trapped in quartz crystals. Bourdet et al. [14] coupled an Ocean Optics USB2000-FL spectrometer to an Olympus AX 70 microscope with a 100 W high pressure mercury-vapor light source and measured fluorescence spectra of single oil inclusions with a bandwidth between 350 nm and 1000 nm. When using the Q ratio from Stasiuk and Snowdon [24] (Q Intensity 650 nm/Intensity 500 nm), the value visually blue fluorescing inclusions was often low or equal to 0. So Bourdet et al. [14] defined a new parameter called Green/Blue (QG/B) ratio (I510/I430). With their equipment a blue fluorescing oil inclusion has a QG/B value lower than 1, whereas a yellow fluorescing oil inclusion has a value higher than 1. Kihle [47] established a UVVIS micro-spectra measurement system by combining an upright deep ultraviolet (DUV) microscope and a UV-VIS spectrometer together. The setup could be successfully used to measure the UV-VIS or VIS [48] spectra of single OGIs. But it is very expensive and users need to rebuild the microscope itself. Yang et al. [49] integrated a UV-VIS spectra measurement system by combining a common IFM, a reflective microscope objective (RMO), a UV-VIS spectrometer and a fiber cable together. For using the common IFM, the cost of the measurement system was greatly decreased. And the user needn’t to rebuild the microscope. The system has the functions of micro-area location, external (from the spectrometer) or internal (from the microscope) light sources excitation, weak fluorescence detection and real-time taking photos. The UV-VIS spectra or VIS spectra of single OGIs were measured under excited by external light source [50,51].
In this paper, the geochemistry features OGIs from Bai 95 oil well (localized in Jilin Oil Field, Songliao Basin, Northeast China) including Th, S, GOIs, and polarized fluorescence microscope identification were obtained. And the previously established UV-VIS experiment system based on the IFM was used to measure the UV-VIS and VIS spectra of single OGIs of Bai 95 oil well. The CIE chromaticity coordinates of the OGIs was calculated by the VIS spectra. The main aromatic hydrocarbons were estimated by the UV-VIS spectra of single OGIs. Combining Th, S, abundance of GOIs and polarized fluorescence microscope identification of OGIs, the episodes, maturity of palaeo-oil, and oil-gas charging were estimated.
Songliao Basin is a large and fault-depression superimposed basin with two sets of hydrocarbon combinations developed in shallowmiddle layer and deep layer. The Jilin Oil Field localizes in Songliao Basin, Northeast China (Figure 1). Many authors investigated the geological features and oil-gas reservoirs [52,53] of Songliao Basin, especially for southern area [54-58]. Few authors [59-61] studied the west slope of southern area of Songliao Basin. The under studied oil well of Bai 95 is in the west slope of southern area. Figure 1 shows the location of Bai 95 oil well and the interpolated thickness distribution of second member of Nenjiang Formation (K2n2) in Jilin Oil Field. The core of Bai 95 oil well is related to four members. K2n2 Member (382-395 m) mainly developed tender gray, grayish green mudstone and sandstone with parallel bedding. Finer facies were interpreted as pro-delta deposits. Yao Formation (412-437 m) is divided into two Members: K2y1 Member (423-437 m) and K2y2+3 Member (412-423 m). Core observation indicates that K2y1 mainly developed gray, grayish green sandstone, and a small amount of silt mudstone. K2y2+3 member mainly developed sandstone with flow ripples and low angle cross bedding structures. Oil immersion and oil spots are common in Yao Formation. The second member of Qingshankou Formation (K2qn2) mainly developed deep dark, gray mud stone and silt stone with parallel bedding and some very small scale ripple cross lamina. All sediment structures indicate braided delta plain deposits and shallow water environment. The under studied sandstone samples were taken from three depths: (1) K2y2+3, 419.3 m and 420.1 m; (2) K2y1, 435.0 m and (3) K2qn2, 494.6 m.

Figure 1: Location of sampling oil well of Bai 95 and interpolated thickness distribution of K2n2 Formation in Jilin Oil Field, Northeast China. The inset is the location of Jilin Oil Field in Songliao Basin.
By the fluorescence color of OGI one can guess the maturity of palaeo oil and gas trapped in the mineral grains. But the fluorescence colors judged by human eyes are subjective. The observation result will be easily influenced by concrete observer and experimental environment. The wavelength range is limited (400-780 nm). In fact, the observation color of the OGI is often collect result, which includes not only the fluorescence from the under studied OGI, but also fluorescence from other OGIs trapped in the same grain, the cement around the mineral grain and even the mineral grain itself. The other OGIs may not be the same generation as the under studied OGI. What’ more, the fluorescence intensity of the cement may stronger than that of the under studied OGI. So the fluorescence from the under studied OGI often add together with the fluorescence from the background. This makes the OGI looks like immersed into a colorful fluorescence cloud under microscope. And the judgment based on the fluorescence color of OGI will lead to a decreasing reliability. Thus it is necessary to establish an experimental setup to measure the fluorescence of single OGI. Because some aromatic hydrocarbons emit fluorescence in UV region, so the fluorescence spectra of the OGIs should be extended to UV-VIS range. And the excited light source should be a DUV light.
Figure 2 shows the schematic diagram of the experimental setup [49-51]. It includes seven parts: an IFM (1), a RMO (2), a fiber cable (3), a micro lens (4), a 3D adaptor (5), a UV-VIS spectrometer (6) and a computer (7). The IFM includes an internal light source (mercury arc lamp), three (violet, blue and green) band pass filters and fluorescence “cubes”. Via the three band pass filters, the central wavelengths of violet, blue and green lights are at 365, 465, and 546 nm respectively. And the corresponding full width at half maximum (FWHM) are 12, 45 and 5 nm respectively. There are five differences between this system and Kihle’s setup [47]. (1) A common and cheap IFM was used but not an expensive upright DUV microscope. The 3D adjustable adaptor can be conveniently connected to the main body of the IFM and one not needs any rebuilding to the microscope. (2) It is easy to adjust the RMO and the IMF coaxial. When the switch of the light source of IMF is on and the intensity of the light source is in minimum, one can adjust the 3D adjustable adaptor while observing the reflected light intensity from the RMO. When the intensity of the reflective beam is maximal, the two are coaxial. (3) The RMO has many advantages over a refractive objective. It is an all-reflective construction and free from chromatic aberration and astigmatism. The primary spherical aberration, primary coma and primary astigmatism have been corrected. The specific mirror coating of the RMO is the UV-enhanced aluminium film, which has as high as 89% average reflectivity in the range of 190 nm-10 μm and is highly recommended for most DUV and UV use. Compared with the refractive objective, the RMO has stronger focusing ability. (4) The RMO has a relative large numerical aperture (0.65), so it can be used as an excellent focusing element and also a good component to effectively collect fluorescence; (5) One can use the video head settled on the microscope itself to take photos for the sample and the focusing spot in time.

Figure 2: Schematic diagram of the micro-spectroscopy setup based on a common inverted fluorescence microscope. In which, 1-inverted fluorescence microscope (IMF); 2-reflective microscope objective (RMO); 3-3D adaptor; 4-micro-lens; 5-fiber cable; 6-UV-VIS spectrometer and 7-computer.
In the setup, the spectrometer is a type of Floramax-4 (Horiba Jobin Yvon) with a 150 W xeon lamp (as external light source, 190-1100 nm) and a single photon PMT. The RMO was made of Ealing (52X). The micro-lens and the fiber cable were bought from Avenges Company. The diameter of the fiber is 400 μm and has a 90% transmittance in the range of 240-800 nm. There are seven fibers in the fiber cable. The fibers were arranged like a club. The middle one was as excitation fiber to guide the monochromatic excitation light from the external light source in the spectrometer to the micro-lens. After focused by the micro-lens and the RMO, a small light spot with size about 12-20 μm could be obtained and incidents on the studied OGI. The peripheral six fibers were as emission fibers to guide the fluorescence from single OGI into the detector in the spectrometer for spectra measurement. For prevent the scattering light coming from single OGI or background arriving at the detector, a 280 nm or 380 nm barrier filters was respectively put in the front of the emission window of the spectrometer when external light source was used as excitation light (250 nm and 365 nm). The two barrier filters isolate lights with wavelengths less than 280 nm and 380 nm, respectively.
The system integrated the functions of the aimed OGI location, internal or external sources excitation, weak fluorescence collection, detection and real-time taking photos together. A program to calculate the CIE chromaticity coordinates of the single OGIs by the VIS spectra was also established to precede the color analysis.
Homogenization temperature (Th) and salinity (S)
Microthermometric measurements were conducted on doubly polished thin sections using a heating-freezing stage. The stage was calibrated by use of international standards, providing standard errors on temperature measurements of ± 0.2°C.
Figure 3 shows the homogenization temperature-salinity diagram of the saline inclusions grown in the two episodes in K2y2+3(a), K2y1 (b) and K2qn2 (c) strata of Bai 95 oil well. There are two episodes OGIs in these samples. The first episode grew in the earlier stage of quartz overgrowth. The second episode developed in the later stage of the quartz overgrowth. For the first episode saline inclusions, the average Th values of the three strata are 75.3, 74.6, and 72.3°C, respectively. And for the second episode saline inclusions, the average values of Th in the three strata increase to 113.3, 95.4, and 98.7°C, respectively. The increasing amplitudes of the Ths are 38.0, 20.8 and 23.1°C respectively. For the first episode saline inclusions, the salinities are 7-9%, 6-15% and 9-13% for the K2y2+3, K2y1 and K2qn2 strata respectively. The different S values of the saline inclusions in the three strata indicate that in the earlier stage of quartz overgrowth, the original ore-forming fluids have different salinities. In the second episode, the salinities of the saline inclusions in the three strata decrease to 2%, 1.5-5% and 4.5-6%. Compared to the first episode saline inclusions, the average salinities of the second episode saline inclusions decrease 5.9-7.0%. The changes of Th and S of the saline inclusions indicate that the deposition environment has great change in the later stage of quartz overgrowth. Compared with the earlier stage of quartz overgrowth, the Th of the strata increase and the S of the ore-forming fluids decrease, which indicate the second episode, might be in a water expanding time.

Figure 3: Homogenization temperature-salinity diagrams of the saline inclusions in K2y2+3 (a), K2y1 (b) and K2qn2 (c) strata in Bai 95 oil well. The star and the square are the first and second episodes inclusions, respectively.
Grains containing oil-gas inclusions (GOIs)
The values of GOIs are different in the two episode stages. In the first episode, the GOIs of the three strata belong to middle value (2-4 ±) [10]. In the second episode, the GOIs of K2y1, and K2qn2 strata decrease to 2 ±. But for K2y2+3 stratum, the GOIs increase to 5-6 ±, which shows lots of oil charged K2y2+3 stratum in the second episode.
Polarized fluorescence microscope identification of OGIs
Under the fluorescence microscope, the OGIs of the first episode are liquid phase and very small. They often densely distribute along a line or a stripe. Their colors are often deep brown or grayish brown. The fluorescence intensities are very weak. It is very difficult to measure the fluorescence of such kind of oil inclusions. Figure 4a and Figure 4b shows the microphotos of OGIs grown in the first episode in K2y2+3 stratum (depth: 420.1 m) of Bai 95 oil well. The OGIs formed in the second episode are liquid or liquid-gas phases (Figure 4c and 4d). In a mineral grain, they distributes in group (Figure 4c) or in scattering (Figure 4d). The liquids in the OGIs are colorless, light yellow, light brownish yellow and brown. Under UV light excitation, they generally emit blue or yellowish white fluorescence. Figure 4c and Figure 4d are the OGIs developed in the second episode at 420.1 m in K2y2+3 stratum of Bai 95 oil well. Figure 4e and Figure 4f are the fluorescence image of Figure 4c and Figure 4d when excited by UV light. The OGIs emit strong light yellowish white fluorescence.

Figure 4: Microphotos of OGIs in K2y2+3 stratum (depth: 420.1 m) of Bai 95 oil well when the OGIs were illuminated by monochromatic polarized (a, b, c, and d) and UV light (e and f). In which, e and f are the corresponding fluorescence microphotos of c and d respectively.
Figure 5 shows polarized (a, c, e, g, i and k) and corresponding fluorescence (b, d, f, h, j and l) microphotos of OGIs in the detrital of feldspar (a, c, e, and g), quartz (i) and calcite (k) of K2y1 strata in Bai 95 oil well. These OGIs show gas and liquid phase (a, c, e, i and k) and indicate colorless or grey (a), light yellowish grey (c, g and i) and light grey (e). Under excitation at UV light, the OGIs emit strong light bluish green fluorescence (b), strong light yellow fluorescence (d, j and l), strong light yellowish green fluorescence.

Figure 5: Microphotos of OGIs in the detrital of feldspar (a and b: 426.8 m, c and d: 431.0 m, e and f: 431.0 m, and g and h: 434.5m), quartz (i and j: 431.0 m) and calcite (k and l: 426.8 m) of K2y1 stratum in Bai 95 oil well as illuminated by monochromic polarized light (a, c, e, g, i and k) and corresponding fluorescence microphotos under excited at UV light (b, d, f, h, j and l).
Figure 6 shows the microphotos of OGIs in detrital quartz (a, b and c) and feldspar grains (d, e, f, g, h and i) when excited by monochromatic polarized (a, b, d, f and h) and UV light (c, e, g and i), in K2qn2 stratum (494.6 m), Bai 95 oil well. In which, c, e, g and i are the corresponding fluorescence microphotos of b, d, f, and h. Under excited at UV light, the OGIs emit light yellowish white fluorescence (c), strong light blue and bluish white fluorescence (e), strong light yellow fluorescence (g), and dark brown fluorescence (i).

Figure 6: Microphotos of OGIs in detrital quartz (a, b and c) and feldspars grains (d, e, f, g, h and i) when excited by monochromatic polarized (a, b, d, f and h) and UV lights (c, e, g and i), in K2qn2 stratum, 494.6 m, Bai 95 oil well. In which, c, e, g and i are the corresponding fluorescence microphotos of b, d, f, and h.
Combining GOIs with polarized fluorescence microscope identification of OGIs, oil and gas charging, maturities of palaeo oil and gas, and the features of maternal source rocks can be estimated. In the earlier stage of quartz overgrowth, a small amount of oil and gas charged K2qn2 and K2y2+3 strata. The maturity of the palaeo oil is low. And a certain amount of oil and gas charged K2y1 stratum. The maturity of the palaeo oil is low, but the maternal source contains rich organic contents. In the later stage of quartz overgrowth, lots of oil and gas charged K2qn2 and K2y2+3 strata. The multiplier colors of OGIs indicate the oil is heavy and medium hydrocarbons, which may come from two different maternal sources. One is mature source with rich organic matter contents and has good hydrocarbon generation potential; the other is low mature source. This estimate coincides with the analysis of Liu B. Z. et al. [61]. Their research showed that there are two sets of source rocks in Qingshankou and Nengjiang Formations. Liang et al. [59] analyzed the features of heavy oil and its source rocks in the west slope region of Jilin oil field. Their results showed all heavy oils are mature and were mainly generated from source rocks in deep Qingshankou formation in changling depression and were not relative to the source rocks in Nenjiang formation. Compared with K2qn2 and K2y2+3 strata, only a certain amount of oil and gas charged K2y1 stratum in the second episode. The multiplier colors of the OGIs also indicate not only one maternal source existing or the oil and gas were heterogeneously trapped.
UV-VIS micro-spectroscopy of single OGIs and color analysis
To decreasing the influence from environment, the experiment was conducted in the dark. The main measurement steps are as same as references [49-51]. A minimum focal spot with size of 12 μm was obtained in our experiment (Figure 7). The halo light around the focal spot is the result of diffraction. It is difficult to be eliminated for the RMO. The focal spot includes most incident energy (84%).

Figure 7: Microphoto of the focal spot with minimum size after external light was guided into the microscope.
Although the focal spot of the incident light is small, when the size of OGI is less than that of the focal spot, not only the OGI emits fluorescence, but also the background. The background fluorescence is complex. It may origins as following: (1) The mineral grain may contain a few even lots of OGIs unidentified under the IMF [24,62]. (2) The surface of the mineral grain was contaminated by oils existing in the sandstone as preparing the inclusion thin slide. (3) The mineral grain may contain some thulium, which will emit fluorescence when they were excited by light. (4) The inclusion thin slide may be contaminated by organism from air or by observer’s hands. So the fluorescence spectrum from the background should be subtracted. For decreasing the influence from the background, a subtract factor should be determined. Because the focal spot includes most excitation energy and its area is small, the energy distribution was approximated to be homogeneous in the spot. The OGI and background were seen as surface light source. Assuming the areas of the OGI and the light spot are S1 and S2. The two areas were easily obtained from the microphotos of the OGI (Figure 8a) and the background (Figure 8b). Assuming the luminous intensities from unit surfaces of the OGI and the background are Ii and Ib. And the total fluorescence intensity of the OGI and partial background (S2-S1) is I1(λ), the intensity of the background is I2(λ). Then

Figure 8: Transmission microphotos of single OGI (a) and the background (b) under excited at external light source with 550 nm wavelength.
I1 = S1Ii + (S2-S1) Ib (1)
I2 = S2Ib (2)
From Eq. (1) and (2), the fluorescence intensity of the OGI is given by
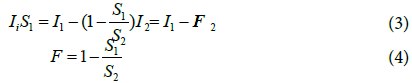
Here F is the subtract factor, which can be obtained from the microphotos of the OGI (Figure 8a) and the background (Figure 8b). According to Eq. (3) and (4), one can obtain the fluorescence spectra of the single OGI. Following results based on above analysis.
Figure 9 typically shows the transmission (a, e, f, g and h) and reflective (b, c and d) microphotos of an OGI (depth: 494.6 m) in Bai 95 oil well. In which, Figure 9a is the transmission microphoto excited by white light. The inclusion was formed in the second episode and appears liquid and gas phases. Under excited at UV, blue and green internal light sources of the microscope, it showed light yellow (b), strong yellow (c) and influenced by the background. Figure 10a shows the VIS spectra of five different OGIs localized in the three different strata in Bai 95 oil well when excited by the internal UV light source (center wavelength 365 nm). Although the OGIs are different, their spectra look like each other for the interference from the background. And the CIE color coordinates of the single OGIs are also similar (Figure 11a).

Figure 9: The transmission (a, e, f, g and h) and reflective (b, c and d) micro photos of an OGI (Bai 95, 494.6 m) when white light (a), internal light source (violet(b), blue(c) and green(d) ) and external source (250 nm (e), 365 nm (f), 440 nm (g), and 546 nm(h)) were used to excite the single OGI. The scales are all 20 μm.

Figure 10: VIS fluorescence spectra of OGIs localized in different depths in Bai 95 oil well when excited by internal UV light source (a, 365 nm) and external light source (b, 365 nm).

Figure 11: The CIE chromaticity coordinates of OGIs in the Bai 95 oil well when excited by internal UV (a) and external light sources (365 nm, b).
When above OGIs were excited by the monochromatic light from the external light source (xeon lamp in the spectrometer), the focal spot size was small, the cement around the OGI was nearly not illuminated, so the fluorescence spectra of the single OGIs were not interfered by the spectra of cements. The background spectra were also subtracted. Figure 10b shows the VIS spectra of the single OGIs as same as Figure 10a excited by the external light source with 365 nm wavelength. One can see that the peak positions of the spectra in Figure 10b are almost same as Figure 10a. The spectrum of OGI localized at 494.6 m is similar each other. The other four spectra are different in two aspects. One is the FWHMs are wider as excited by external light source than that of the internal light source. Another is there are “bulks” in the range of 425-610 nm when excited by external light source (Figure 10b), which shows these OGIs contain medium and heavy aromatic hydrocarbons. Above results show that the VIS fluorescence spectra from single OGIs take more information than that of traditional VIS fluorescence spectra without subtracting the interference from background.
According to the theory of calorimetric [63], the CIE chromaticity coordinates of OGIs were calculated. Figure 11 shows the CIE chromaticity coordinates of these OGIs excited by internal UV light source (Figure 11a) and external light source (365 nm, Figure 11b). The chromaticity coordinates are in the range of light yellowish white and light bluish white respectively. Compared with the internal UV light excitation, the chromaticity coordinates are more dispersive for single OGIs when excited by external light source. The main reason is that when excited by internal UV light source, not only the single OGI emitting fluorescence, but also other OGIs, the cements and the mineral grain itself, which will interfere the fluorescence spectrum of the single OGI, thus the chromaticity coordinates localize in light yellowish white area (Figure 11a). When the external light source was used to excite the single OGI, the light spot was small, the cements and other OGIs were not excited and did not influence the spectrum of the single OGI. The fluorescence of the mineral grain around the under studied OGI has been subtracted as the background. The final spectrum is near to the real spectrum of the under studied OGI, so the chromaticity coordinates are relative dispersive. Above results show that the colors of single OGIs are precise and objective for the spectra are not influenced by the background and observers.
Except for medium and heavy aromatic hydrocarbons, the OGIs may also trap light aromatic hydrocarbons, which emit fluorescence in the range of UV under excited by DUV light, that is to say the fluorescence of these light aromatic hydrocarbons cannot be excited by 365 nm light source. So 250 nm monochromatic light from the external light source was used to excite these OGIs. Figure 12 indicates the UVVIS spectra of single OGIs from Bai 95 Oil well. The peak positions of the OGI localized at 419.3 m are at 385, 444 and 455 nm. The main aromatic hydrocarbons trapped in the OGIs at K2y2+3 stratum are two, three or four cyclic hydrocarbons. With the buried depth increasing, the fluorescence peaks have red shifts, which indicate that the aromatic hydrocarbons tend to become heavy. The main aromatic hydrocarbons in the OGIs are three, and four cyclic hydrocarbons in the OGIs at K2y1 and K1qn2 strata. The peaks near to 545 nm and 610 nm show that there are some heavy aromatic hydrocarbons in these OGIs. The UVVIS spectra show that there may be two maternal sources charging the strata in the second episode, one is mature, the other is low mature. This result coincides with the analysis of Th and S. So the main aromatic hydrocarbons and the maturity of palaeo oil gas and the features of the maternal sources can be estimated by UV-VIS micro-spectroscopy of single OGIs.

Figure 12: UV-VIS micro-fluorescence spectra of single OGIs formed in the second episode of Bai 95 oil well under excited by external light source with 250 nm wavelength.
Combining Th, S, GOIs and polarized fluorescence microscope identification of OGIs together, oil and gas charging, maturities of palaeo oil and gas, and the features of maternal source rocks related to the three strata of Bai 95 oil well were estimated. In the earlier stage of quartz overgrowth, a small oil and gas charged K2qn2 and K2y2+3 strata, and certain amount of oil and gas charged K2y1 stratum. The maturity of the palaeo oil is low. In the later stage of quartz overgrowth, lots of oil and gas charged K2qn2, and K2y2+3 strata, and a certain amount of oil and gas charged K2y1 stratum. The multiplier colors of OGIs show the oil are heavy and medium hydrocarbons, which might come from two or more different maternal sources. One is mature source with rich organic matter contents and has good hydrocarbon generation potential; the other is low mature source.
The VIS and UV-VIS spectra of single OGIs were measured under excited by external monochromatic light source. The fluorescence from background was subtracted, so the fluorescence interference from background was greatly decreased. The VIS fluorescence spectra from single OGIs take more information than that of traditional VIS fluorescence spectra without subtracting the interference from background. The CIE chromaticity coordinates of the singles OGIs by the VIS spectra were calculated. The CIE chromaticity coordinates are more objective than those judging by eyes. By analysis the UVVIS spectra of single OGIs from Bai 95 well, the main aromatic hydrocarbons in the OGIs can be qualitative determined. With the buried depth increasing, the fluorescence peaks have red shifts; the aromatic hydrocarbons tend to become heavy. The UV-VIS spectra showed that there may be two maternal sources charging the strata in the second episode, one is mature, the other is low mature. This result coincides with the analysis results from Th, S, polarized fluorescence microscope identification of OGIs and GOIs.
In principle, this technique is not limited or limited slightly by the background fluorescence. It can be used to measure the UV-VIS fluorescence of single OGIs trapped in any detrital grains or cements. The fluorescence from light, medium or heavy aromatic contents are all showed on the UV-VIS spectra. Compared with the traditional VIS spectra technique, the fluorescence range is wider. By analysis the UVVIS spectra, the main aromatic constitutes, the maturity of palaeo oil and gas, and the oil and gas charging information could be qualitatively estimated. For using a cheap common inversed microscope, but not an expensive DUV microscope, the setup cost was greatly decreased. Our experimental results showed it is a reliable and promising technique in measuring the UV-VIS fluorescence spectra of micro samples, such as bio-inclusions, oils trapped in micro fractures in mineral slides, special mineral grains and so on.
This work was supported by the National Nature Science Foundation of China (granted No. 41172110 and 41402108). The author is appreciated for Jilin Oil Field to supply sandstones. The authors deeply thank the reviewers and editors for their constructive suggestions about this manuscript.