Journal of Alcoholism & Drug Dependence
Open Access
ISSN: 2329-6488
ISSN: 2329-6488
Short Communication - (2015) Volume 3, Issue 2
Background: The Russian Federation has the 11 highest burden of tuberculosis (TB) in the world and thirdhighest burden of multidrug resistant TB. Alcohol continues to play a crucial role in the Russian TB mortality crisis. Objectives: The aim of the present study was to estimate the TB mortality attributable to alcohol abuse in Russia using aggregate-level data of TB mortality and the level of alcohol sales from 1980 to 2010. Methods: Age-standardized sex-specific male and female TB mortality data for the period 1980-2010 and data on alcohol sales were analyzed by means ARIMA time series analysis. Results: The results of the analysis suggest that 35.4% of all male TB deaths and 32.0% female TB deaths in Russia could be attributed to alcohol. Conclusions: The outcomes of this study provide support for the hypothesis that alcohol is an important contributor to the high TB mortality rate in Russian Federation. Therefore prevention of alcohol-attributable harm should be a major public health priority in Russia.
Keywords: Tuberculosis; Mortality; Alcohol sales; ARIMA time series analysis; Russia; 1980-2010
Tuberculosis (TB) continues to be among the most fatal and disabling disease, globally [1]. The World Health Organization (WHO) estimates that 8.6 million people developed TB and 1.3 million died in 2012, and up to 2 million people worldwide may be infected with drug-resistant TB by 2015 (WHO, 2014).
The association between alcohol and TB has been documented in numerous publications, which reported a strong link between heavy drinking and the incidence of TB, as well as worsening of the disease course [2-4]. Most of these publications based on case-control studies, where either newly detected or recurrent cases of active TB were compared to control populations. At the individual level, there is evidence of an exponential dose-response relationship between level of alcohol use and risk of TB [3]. A recent review of the epidemiological studies with individual-level data on alcohol exposure and TB disease status suggest that the risk of TB substantially increase among people who drink more than 40 g alcohol per day, and/or have an alcohol use disorder [2]. The pooled effect size across studies in the high-exposure category was 2.94 (95%: CI 1.89-4.59) after excluding the three studies with largest standard errors in order to make a crude adjustment for the suspected publication bias. Similar evidence of a strong link between alcohol and TB emerged from aggregate-level studies. Close aggregate level association between alcohol sales and pulmonary TB mortality rates has been reported in Belarus [5]. It was suggested, that 1% increase in alcohol sale per capita might cause 0,49 and 0,36% increase in pulmonary TB mortality rates in males and females respectively [6].
The association between harmful drinking and TB mortality may be attributable to biomedical and socio-behavioral mechanisms. Alcohol may assert a direct or indirect (through nutrition deficiency) toxic effects on the immune system, and increases the susceptibility to active TB infection [7,8]. In addition to alcohol’s role in the onset of TB, there is also strong evidence of a negative effect of heavy drinking on the clinical course of TB. Alcohol dependent individuals show higher relapse rates, a higher probability of an unfavorable clinical course (multidrug-resistance) and interruptions of treatment, which leads to a lack of effectiveness of the treatment in general [9,10]. It is also obvious, that alcohol abuse leads to social downward drift, social exclusion and marginalization, which may lead to exposure to TB infection in overcrowded places, including prisons [11].
The Russian Federation has the 11 highest burden of TB in the world and third-highest burden of multidrug resistant TB [12]. Recently, the WHO warned the high rates of tuberculosis in Russia could pose a threat to health in Western Europe (WHO, 2014). Currently, TB is the leading infectious cause of death in Russia [13]. Higher TB mortality in Russia has been attributed to a dramatic rise in multidrug- resistance, deteriorations in TB services and increase in hazardous drinking [14]. Alcohol continues to play a crucial role in the Russian TB mortality crisis [12]. In St. Peterburg, for example, over half of patients with TB have been shown to be heavy drinkers [15]. Most of those who are diagnosed with multidrug-resistant TB are alcohol abusers [16]. In a cohort study, alcoholism was not only associated with an increased risk of death but also contributed heavily, either directly or indirectly, to the mortality among TB patients [13]. A retrospective case-controle study of 48557 adult deaths in three Russian industrial cities reported the following dose-response relationship beyond an apparent threshold: <1 half-litre bottle of vodka or equivalent per day relative risk 1.01 for men (95% CI 0.83-1.22), 0.93 for women (95% CI 0.64-1.35); one to less than 3 bottles 1.97 for men (95% CI 1.64-2.36), 4.06 for women (95%CI 2.97-5.56); 3 bottles and above 4.14 for men (95% CI3.44-4.98), 5.32 for women (95% CI 3.70-7.65) [17]. Taken together, this evidence is a good reason to expect positive association between alcohol consumption and TB mortality at the aggregate level in Russia.
The calculation of alcohol-attributable mortality currently is routinely applied to provide an indication of the public health effect of harmful alcohol consumption for developing strategy to prevent alcohol-related mortality [18]. The alcohol-attributable fraction (AAF) is generally defined as the proportion of the disease that would not occur if lifetime exposure to alcohol were hypothetically changed to the counterfactual level of zero [18]. Globally, about 10% of the TB was estimated to be attributable to alcohol [4]. The proportion of TB attributable to alcohol varies between settings, due to varied social context of alcohol use and different mix of other risk factors that could modify the effect of alcohol use. The AAF range from close to zero in parts of Eastern Mediterranean Region to more than 30% in Eastern Europe [3].
The aim of the present study was to estimate the TB mortality attributable to alcohol abuse in Russia using aggregate-level data of TB mortality and the level of alcohol sales from 1980 to 2010.
Data
The data on age-adjusted sex-specific TB mortality rates per 100,000 of the population are taken from the Russian State Statistical Committee (Rosstat). The Rosstat’s cause of death classification has undergone several changes in recent decades. Until 1988 the cause of death classification was based upon the Soviet nomenclature which had a limited number of causes of death in comparison with the International Classification of Diseases (ICD) system. From 1989-1998 Rosstat used a coding scheme that was based on ICD-9. From 1999 a new coding system based on ICD-10 was introduced. Rosstat issued a table of correspondence between its classification system and ICD-9 and ICD-10 and it has been claimed that the Russian system of coding was and is compatible with the ICD.
Statistical analysis
To examine the relation between changes in the alcohol sales and TB mortality across the study period a time-series analysis was performed using the statistical package “Statistica”. The dependent variables were the annual TB mortality and the independent variable was aggregate overall alcohol consumption. Bivariate correlations between the raw data from two time-series can often be spurious due to common sources in the trends and due to autocorrelation [19]. One way to reduce the risk of obtaining a spurious relation between two variables that have common trends is to remove these trends by means of a ‘differencing’ procedure, as expressed in formula:
∇xt = xt - xt-1
This means that the annual changes ‘∇’ in variable ‘X’ are analyzed rather than raw data. The process whereby systematic variation within a time series is eliminated before the examination of potential causal relationships is referred to as ‘prewhitening’. This is subsequently followed an inspection of the cross-correlation function in order to estimate the association between the two prewhitened time series. It was Box and Jenkins [20] who first proposed this particular method for undertaking a time series analysis and it is commonly referred to as ARIMA (autoregressive integrated moving average) modeling. We used this model specification to estimate the relationship between the time series TB mortality and alcohol sales rate in this paper. In line with previous aggregate studies [19, 21], we estimated semi-logarithmic models with logged output. The following model was estimated:
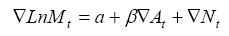
where ∇ means that the series is differenced, M is TB mortality rate, α indicates the possible trend in TB mortality due to other factors than those included in the model, A is the alcohol consumption, β is the estimated regression parameter, and N is the noise term. The percentage increase in TB mortality rate rates associated with a 1-litre increase in alcohol consumption is given by the expression: (exp(β1)-1) × 100. The temporal structure of the error term was estimated by using autoregressive (AR) or moving average (MA) parameters in the model. A diagnostic test for residual correlation is given by the Box-Ljung Q-test, which indicates whether the model has been adequately fitted.
In addition to the estimated effect parameter, the alcohol effect will also be expressed in terms of alcohol-attributable fraction (AAF), which is interpreted as the proportion of TB deaths that is attributable to alcohol. AAF can be calculated from the estimates obtained in ARIMA models according to following formula: AAF = 1-exp (-bX), where X is alcohol sales for the whole study period and b is the estimated effect parameter [22].
The average per capita alcohol sales figure was 8.2 liters with vodka being the drink overwhelmingly consumed. The temporal pattern of alcohol sales per capita in Russia is shown in (Figure 1). As can be seen, the alcohol sales have experienced sharp fluctuations across the period. Thus, a brief Andropov’s anti-alcohol campaign in the early 1980s resulted in a decline in alcohol sales. An especially sharp fall was recorded in alcohol sales in 1985-1988 that coincided with Mikhail Gorbachev’s anti-alcohol campaign. Similarly, the collapse of the Soviet Union and the ending of the state’s alcohol monopoly in the early 1990s were accompanied by a sharp rise in alcohol sales.

Figure 1: Trends in TB mortality rate and alcohol sales per capita in Russia between 1980 and 2010.
According to official statistics, the male TB mortality rate increased by 30.8% (from 11.7 to 15.3 per 100.000 of population) and female mortality rate increased by 53.5% (from 7.1 to 10.9 per 100.000 of population) in Russia from 1980 to 2010. Across the whole period the male TB mortality rate was 1.3 times higher than the female rate (10.7 vs. 8.2 per 100.000) with a rate ratio of 1.7 in 1980 decreasing to 1.4 by the 2010. The trends in the age-adjusted, sex-specific TB mortality rates are displayed in Figures 1. For both sexes the time series TB mortality rates fluctuated greatly over the period: decreased markedly between 1984-1988, than started on an upward trend from 1988-1989, before increasing substantially during 1992 to 1994 (by 50.7% and 39.3% for men and women respectively). From 1995-1998 there was a fall in the rates before they again jumping dramatically between 1998 and 2002 (by 78.9% and 67.9% for men and women respectively) while a decrease in rates has been recorded in the most recent years.
The graphical evidence suggests that the trends in both alcohol sales per capita and TB mortality for males and females seem to follow each other across the time-series (Figure 1). As can be seen, there were sharp trends in the time series data across the study period. These systematic variation was well accounted for by the application of firstorder differencing and the specification of a first order moving average parameter. All of the final univariate models meet the diagnostic criterion (i.e., none of the autocorrelation functions are significant at the 0.05 level). The specification of the bivariate ARIMA model and outcome of the analyses are presented in (Table 1). According to the results, alcohol sales is a statistically significant associated with both male and female TB mortality rates, implying that a 1-litre increase in per capita sales is associated with an increase in male mortality of 5.3% and female mortality of 4.7%. (Table 1) also shows the relative proportion of alcohol-attributable deaths to all TB deaths by gender. The results of the analysis suggest that 35.4 % of all male deaths and 32.0% female deaths from TB in Russia could be attributed to alcohol.
| Parameter | Model | Estim. | p | AAF |
|---|---|---|---|---|
| Mortality males | 0.1.1* | 0.053 | 0.020 | 0.353 |
| Mortality females | 0.1.1 | 0.047 | 0.016 | 0.320 |
Table 1: Estimated effects (bivariate ARIMA model) of alcohol sales on TB mortality rate.
According to the results of ARIMA time series analysis there was a positive and statistically significant effect of per capita alcohol sales on the TB mortality rate in Russia. These findings clearly indicate that population drinking and TB mortality are positively related phenomena in Russia. The results of present study are important because despite the growing literature on alcohol and alcohol-related mortality in Russia there has been no prior time-series analysis of alcohol sales on the TB mortality rate.
Estimation the proportion of alcohol-attributable fraction suggests that 35.4% of male TB deaths and 32.0% of female deaths in Russia are attributable to alcohol. These aggregate-level findings are comparable to previous individual-level estimates for males (37.0%), but exceed substantially estimates for females (9.2%) [23]. Relatively high estimates of AAF for women, where heavy drinking is restricted to a relatively small proportion of the population, gives rise to the suspicion of possible measurement error and may imply that the alcohol effect for women is overestimated. Nevertheless, there are some indications that Russian women are drinking more now which likely to be a factor in the narrowing of the male-female TB mortality rate ratio [24]. In his recent study, based on the results of RLMS Perlman highlighted that frequent heavy drinking almost doubled among women between 1994 and 2004 [25]. An alternative explanation for these findings is that women might be more sensitive to an increased risk of TB, even at the relatively low levels of alcohol consumption.
Natural experiments, such as sudden and large changes in alcohol consumption level, provide an opportunity to test the efficacy of policy attempts to reduce the rate of alcohol-related problems in the population. These types of experiments are being used in the social epidemiology and allow to rigorously evaluating the efficacy of public health interventions. Russia, due to its high overall level of consumption, hazardous drinking pattern and its high TB rate, provides an important contextual setting for this type of analysis [26,27]. During the last decades, Soviet and later Russian governments adopted a series of restrictive measures in an attempt to curb the alcohol-related burden [28]. Gorbachev’s anti-alcohol campaign in the 1985-1988 is the most well-known natural experiment in the field of alcohol policy. It seems obvious that sudden decline in TB mortality rate between 1985 and 1988 appears to be entirely due to anti-alcohol campaign that significantly reduced alcohol consumption by limiting its manufacture and availability.
In contemporary Russia, recognizing the central role of alcohol in the mortality crisis President Putin signed a law regulating production and sale of alcohol production in 2005 [26]. The law contained regulations aimed at controlling the volume and quality of alcohol products and requiring the registration of alcohol production and distribution facilities. A coincidence in the TB mortality and alcohol sales trends between 2004 and 2010 allows us to hypothesize that the reduction in the TB mortality rate during the most recent years might be attributed to the implementation of the alcohol policy reforms, which increased government control over the alcohol market [23]. A fairly close aggregate-level match between alcohol sales and TB mortality rate during the Gorbachev’s anti-alcohol campaigns and during the last years may be use as evidence for the hypothesis suggesting that a restrictive alcohol policy can be considered as an effective measure of TB mortality prevention.
The increase in alcohol consumption has contributed to the dramatic rise in TB deaths between 1992 and 1995. This increase was to a great extent due to increase of alcohol availability following the repeal of the state alcohol monopoly in January 1992 [26]. Furthermore, the increase in heavy drinking in Russia during transition, which triggered the dramatic rise in TB mortality rate, resulted from an increase in the affordability of vodka. With price liberalization in 1992, vodka became much more affordable because of a sharp drop in the price of vodka relative to those of other goods and alcoholic beverages including beer [28]. There is strong evidence of a key role of alcohol in explaining of Russian TB mortality crisis between 1998 and 2002, when affordability of vodka increased substantially [29].
Before concluding, several potential limitations of this study must be mentioned. In particular, when trying to assess the impact of per capita alcohol consumption on TB mortality rate it is important to have accurate consumption figures. In present study, we relied on official alcohol sales data as a proxy measure for trends in alcohol consumption across the period. However, the unrecorded consumption of alcohol was commonplace in Russia throughout the study period, especially in the mid-1990s, when a considerable proportion of vodka came from illicit sources [28,30]. The consumption of homemade spirits (samogon) and surrogates might also have a particularly negative impact on alcohol-related mortality [30].
Further, there might have been confounding variables that could have biased the estimates. A number of correlates like social marginalization, malnutrition, homelessness, poverty, and imprisonment increases the risk of TB independently of heavy drinking [2,16]. Some experts have underlined the importance of the effect of the psychosocial distress of economic and political reforms as the main reason for the mortality crisis in Russia in the early 1990s [31]. In this period Russia faced a deep socioeconomic crisis accompanied by unemployment grows, hyperinflation, dramatic decline in the wellbeing of the majority of the population [28]. The turmoil associated with socioeconomic and political transition affected Russian peoples and lead to the high prevalence of poverty, poor nutrition and adverse health behavior such as binge drinking and smoking [32]. Similarly, the dramatic rise in TB mortality rate between 1998 and 2002 may be associated with the financial crisis which resulted in hyperinflation, increasing poverty, political and economic uncertainty [26,33].
Finally, it is likely that increase in TB mortality in Russia in the mid-1990s is a consequence of deterioration in the quality of health care system, following the collapse of Soviet Union in late 1991. As command economy collapsed, the public health system faced a financial crisis. Left without proper funding, health care system was unable to maintain needed level of medical care [32]. This, along with high rates of penal incarceration due to increase crime rates, resulted in the spread of drug-resistant TB. However, confounding effects of these factors would have to be considerable magnitude to offset the strong association between alcohol sales and TB mortality in this study.
In conclusion, this is the first time-series analysis of alcohol sales and TB mortality rate in Russia, which has shown that population drinking, is the strong predictor of TB mortality rate at the aggregate level. The outcomes of this study provide indirect support for the hypothesis that the high rate of TB mortality in Russia may be related to alcohol, as indicated by a close aggregate-level association between number of deaths from TB and alcohol sales per capita [34]. The findings from the present study have important implications as regards TB mortality prevention indicating that a restrictive alcohol policy can be considered as an effective measure of prevention in countries where both higher rate of alcohol consumption per capita and TB mortality are high [35]. Given the high prevalence of alcohol use disorders among TB patients in Russia, establishing a systematic approach to screening and treating alcohol use disorders among TB patients might be useful.