International Journal of Advancements in Technology
Open Access
ISSN: 0976-4860
ISSN: 0976-4860
Research Article - (2022)Volume 13, Issue 7
Reproducing a reliable numerical model close to the reality of mining embankments represents an increasingly demanding challenge for mining researchers and geotechnical engineers. The heterogeneity and uncertainty in the geotechnical parameters of the soil are among the most critical aspects to possibly include in the advanced analysis and design of mine embankments. The exploitation of the results of field monitoring instruments can be functional here to calibrate and improve the reliability and coherence between the numerical model and reality. In New Caledonia, the mining industry produces enormous quantities of discharges developed in the form of waste dumps. The instability of these embankments can create a risk of damaging ground movement. However, the mining operator must understand the behavior of stored material in order to avoid the phenomena of unplanned instabilities. The field measurements and laboratory tests of the operated site are generally limited given the difficulty of excess to the site as well as their costs, while a realistic characterization of the soil is carried out only in numerical research tools, which limits confidence in the conditions of stability. In order to provide this efficient and innovative application to perform predictive analyses of slope stability under realistic conditions, a large-scale monitoring system was implemented for more than 20 years in the areas studied. The calibration between the numerical model and the monitoring results aims to provide a true characterization of the soil as well as to define the best rheological model adequate for the evaluation of all signs of instability.
Numerical model calibration; Field surveillance; Soil characterization; Finite element method; Soil behavior
The mining industry produces enormous quantities of discharges, namely limonite waste material, sub-economical products, and tailings. The right management of these discharges in a safe manner is the main issue because they have been the cause of major accidents and environmental disasters. Limonite waste material is often deposited on the surface in the form of waste dumps (piles or slag heaps) and consolidates over time under its weight. They can extend tens of meters above the ground. The instability of these structures can lead to the failure of embankments and consequently will generate a risk of damaging ground movement.
Nevertheless, in all cases, the mining operator must understand and predict as precisely as possible the behavior of stored waste material to avoid any phenomena that may contribute to the development of unexpected instabilities and to endanger the safety of people, machinery, the proper functioning of the operation, infrastructure and flora and fauna species.
From a rheological point of view, mining embankments are materials with complex behavior that evolves over time, from preparation to installation and consolidation on the site [1-3]. The knowledge of the behavior of soil under stress is a major challenge since it makes it possible to assess the deformations resulting from the stresses while ensuring a good consistency between the real stresses and those that have been modeled. In this context, the physical and mechanical characteristics of soil are the most interesting.
The present study concerns the characterization of a waste dump, located in New Caledonia, resting on an earthy base. In fact, nickel ore is extracted in layers of peridotites covered with limonite. Mine waste material is stored in the form of a waste dump in specially designed sites.
Since 1973, reworked limonite has been stored in the form of high-rise waste dump (more than 100 m) based on rules that have been developed from a deep geotechnical study that is synthesized in the report entitled “New design approach for limonite landfills in nickel ore mines in New Caledonia” by Samir ENN [4].
These waste dumps were equipped with monitoring instruments in order to evaluate their behaviors during their construction and in the final stage.
The objective of this study is to determine the characteristics of this waste material using finite element code. We will try to make a calibration between the experimental data, namely the results of monitoring measurements over several years and the results of displacements and pore pressure obtained by numerical models.
The cases of waste dump “MOK” and “WAWE” were considered here as case studies. Therefore, we have developed a mathematical model of these two waste dumps, to predict with acceptable reliability the behavior of these soils. We need a good knowledge of the structure of the material studied based on a sufficiently large experimental basis to be able to interpret the results of the simulation properly.
Study area
The study area named Koniambo Massif is part of a string of mountain ranges along the west coast of New Caledonia Island. The massif rises, from a narrow coastal plain to an altitude of 930 m above sea level (Figure 1). After its exploitation, the company Koniambo SAS retained concessions as mining areas for the storage of products from the exploitation of the nickel deposit. The sites of implantation of these waste dumps are generally made up of thalwegs, which induces risks concerning stability depending on the foundation and their slopes. Storage areas must be equipped with monitoring devices (inclinometers; piezometers and excess pore pressure cells) to detect the behavior of stored products during their consolidation.
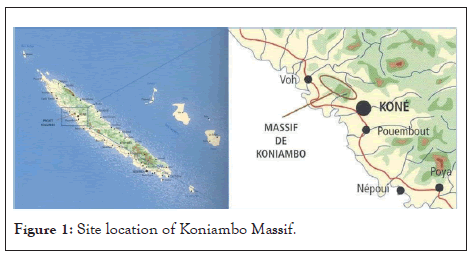
Figure 1: Site location of Koniambo Massif.
Two waste dumps were selected to characterize the limonite soil of Koniambo massif. The calibration of the numerical model of these two dumps is based on the results of field monitoring such as horizontal displacements and pore pressure. The two waste dumps are named “MOK” and “WAWE”. Their characteristics are described in Table 1.
| Location on the map | MOK | WAWE |
|---|---|---|
| Latitude: -20.9783, Longitude: 164.805 20° 58′ 42" South, 164° 48’ 19" East | Latitude: -20.9655, Longitude: 164.720° 57′ 56" South, 164°47′ 37" East | |
| Nature of products stored | Products consisting of red or yellow limonite, with very fluctuating water contents. | |
| Stalling platform rating (NGNC) (m) | 775 | 790 |
| Height of the waste dump (m) | 145 | 165 |
| Area (ha) | 21,4 | 18,7 |
| Actual storage rate per year (m) | In 2012:20 | In 2015:10 |
| In 2013:50 | In 2016:25 | |
| In 2014:35 | In 2017:30 | |
| In 2015:20 | In 2018:30 | |
| In 2016:12 | In 2019:35 | |
| In 2017:9 | In 2020:29 | |
| In 2018:2 | - | |
| In 2019:4 | - | |
Table 1: Characteristics of the waste dumps used for calibration.
The geology of the study area
Due to the dimensions, it is difficult to summarize the profile of Koniambo Massif in a single Stratigraphic model [5]. In fact, a limonite soil profile of New Caledonia is shown-at top of the profile, the crust level is mainly composed of iron oxi-hydroxides such as hematite and goethite. It results from the dissolution of all mineral components of the peridotite. Beneath the crust horizon, the limonite level represents an advanced state of alteration (Alteration 6) [6]. Under the limonite layer, the earthy saprolite shows an intermediate state of alteration (Alteration 4 and 5). Between Earthy saprolite and bedrock, the rocky saprolite layer represents a negligible state of alteration (Alteration 1, 2 and 3); (Figure 2). This profile was defined by [7].
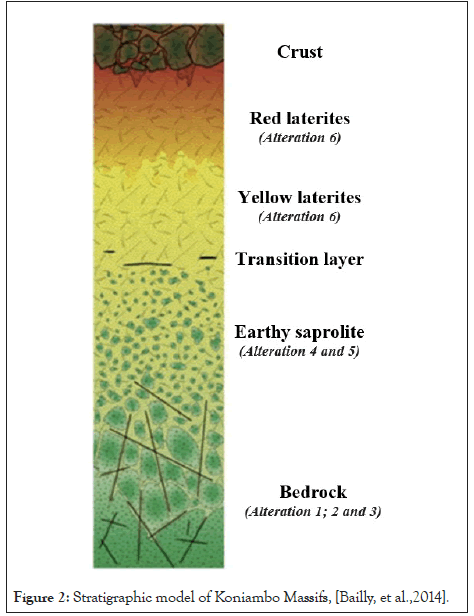
Figure 2: Stratigraphic model of Koniambo Massifs, [Bailly, et al.,2014].
The geological model was formulated based on several geotechnical investigations carried out in the study area. Their results test shows that: The waste dump “MOK” presents a foundation composed of a limonite layer whose thickness various between 4 and 12 meters (Alteration 6); a layer of earthy saprolites with a thickness varying between 2 and 12 meters (Alteration 5 and 4) and a layer of rocky saprolite with little fracture (Alteration 1, 2 and 3); (Figure 3).
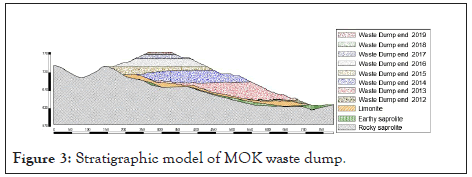
Figure 3: Stratigraphic model of MOK waste dump.
The WAWE waste dump has a foundation composed of a limonite horizon whose thickness does not exceed 3 meters (Alteration 6); a layer of earthy saprolites with a thickness varying between 0 and 8 meters (Alteration 5 and 4) and a layer of rocky saprolite with little fracture (Alteration 1, 2 and 3); (Figure 4).
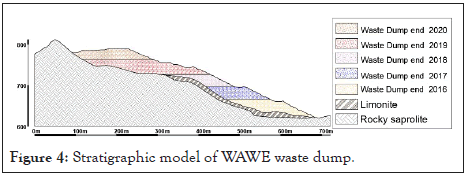
Figure 4: Stratigraphic model of WAWE waste dump.
Monitoring system
The monitoring system, designed and installed since the start of the waste dump’s construction. It includes inclinometers (INC), excess pore pressure cells (CPI), and piezometers (GW). The inclinometers were used to evaluate horizontal displacements during and after the construction of the waste dump. The excess pore pressure cells were used to capture the pore pressure generated during limonite storage. Whereas, the piezometers were used to control the fluctuation of the piezometric line of an existing aquifer.
The MOK waste dump monitoring system is currently composed of three inclinometers (INC), seven pressure cells (CPI), and two piezometers (Figure 5). Considering the results of field monitoring for more than 5 years (Table 2), the displacements measured by the inclinometers are rational and in accordance with the forecasts. In addition, given the low storage rate achieved in recent years (less than 5 m/year), the CPI installed in the waste dump is often desaturated. The behavior of the water table is related to the rainfall recorded in the measurement period. Possibly the level of the water table of the MOK waste dump remains under the natural terrain and does not reach the base of the waste dump. For this purpose, the calibration of the numerical model of MOK will be based on the measurement results of the two inclinometers INC1 and INC2. For consolidation pore pressure, the objective of the calibration is to find zero excess pore pressure values, in accordance with the observations of 2020. The monitoring system of waste dump WAWE is currently composed of five inclinometers, fifteen pressure cells, and six piezometers (Figure 6).
| Inclinometer | Installation rating | Localization | Measurement period | Displacement maximum cumulative-end of 2020 (cm) |
|---|---|---|---|---|
| INC1 | 665 | Bedrock | 2014-2021 | 10.3 |
| INC2 | 710 | 2015-2020 | 10 | |
| INC3 | 730 | 2015-2020 | Out of order | |
| Sensor of access pore pressure | Installation rating | Localization | Measurement period | Access pore pressure end of 2020 (kPa) |
| CPI1 | 710 | Waste dump | 2014-2020 | De-saturated |
| CPI2 | 710 | Waste dump | ||
| CPI3 | 710 | Waste dump | ||
| CPI5 | 730 | |||
| CPI6 | 730 | |||
| CPI9 | 730 | |||
| CPI10 | 730 | 2015-2020 | ||
| Piezometer | Installation rating | Localization | Measurement period | Piezometric level at the end of 2020 |
| GW126 | 665 | Drainage blanket | 2014-2020 | The water level is under the roof of the drainage blanket |
| GW190 | 665 | Waste dump | The water level is below the level of the natural land |
Table 2: Monitoring system details of MOK waste dump–end 2020.
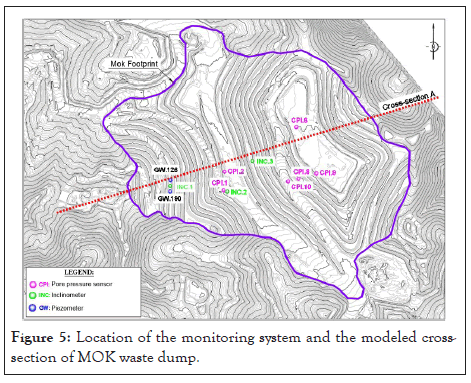
Figure 5: Location of the monitoring system and the modeled cross- section of MOK waste dump.
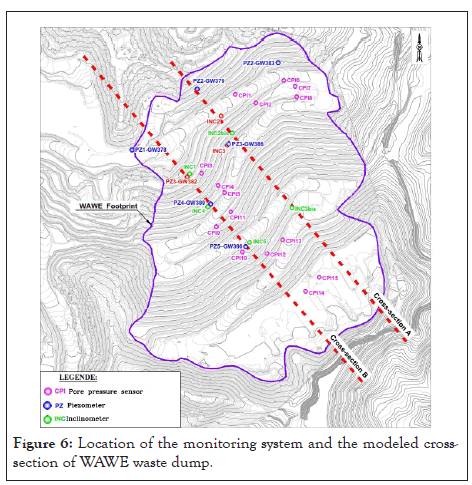
Figure 6: Location of the monitoring system and the modeled cross- section of WAWE waste dump.
Considering the results of field monitoring (Table 3), the displacements measured in the inclinometers vary according to the rate and their proximity to the storage area. The excess pore pressure is proportional to the permeability characteristics of the stored embankment. In fact, excess pore pressure measurements are more or less low based on the spacing between rip rap fingers. The level of the water table fluctuates according to the rainfall. In the rainy seasons, the level of the water table can reach the waste dump but it is followed by a quick drawdown due to the presence of riprap fingers.
| Inclinometer | Installation rating | Localization | Measurement period | Displacement maximum cumulative-end of 2020 (cm) |
|---|---|---|---|---|
| INC1 | 669.19 | Bedrock | 2017-2020 | 18 |
| INC2. bis | 686.37 | 2017-2020 | 19 | |
| INC3. bis | 751.45 | 2019-2020 | 6 | |
| INC4 | 705.68 | 2018-2020 | 21 | |
| INC5 | 736.43 | 2019-2020 | 25 | |
| Sensor of access pore pressure | Installation rating | Localization | Measurement period | Access pore pressure end 2020 (kPa) |
| CPI1 | 645.2 | Bedrock | 2016-2020 | De-saturated |
| CPI2 | 644 | |||
| CPI3 | 662.98 | Waste dump | ||
| CPI4 | 659.47 | |||
| CPI5 | 660.29 | |||
| CPI6 | 663.88 | |||
| CPI7 | 663.82 | |||
| CPI8 | 664.02 | |||
| CPI9 | 704.3 | 2017-2020 | Between 8 and 15 kPa | |
| CPI10 | 704.7 | |||
| CPI11 | 703.4 | 2019-2020 | De-saturated | |
| CPI12 | 736.1 | |||
| CPI13 | 735.7 | Between 10 and 12 kPa | ||
| CPI14 | 737.4 | 2020 | De-saturated | |
| CPI15 | 736.6 | |||
| Piezometer | Installation rating | Localization | Measurement period | Piezometric level at the end of 2020 |
| Piezometer GW378 | 648.5 | South rock drains | 2016-2020 | The flow in the wicks is done on a free surface |
| Piezometer GW379 | 639.5 | North rock drains | ||
| Piezometer GW382 | 669.62 | Out of order since May 2019 | 2017-2020 | The water table is below the level of the natural land |
| Piezometer GW383 | 671.1 | Bedrock | 2016-2020 | |
| GW386 piezometer | 690.77 | 2017-2020 | ||
| Piezometer GW389 | 705.12 | |||
| GW390 Piezometer | 736.79 |
Table 3: Monitoring system details of WAWE waste dump–end 2020.
For the calibration of the numerical model of the WAWE waste dump, we will retain the two INC2bis and INC3bis inclinometers that will be modeled in cross-section A. The three inclinometers INC1, INC4, and INC5 that will be modeled in the cross-section B; and finally, the Sensor of excess pore pressure CPI10 where we observe a water pressure over the entire period of the analysis.
The mechanical characteristics of the materials constituting the waste dump and the foundation from previous studies and feedback
The determination of waste dump materials’ mechanical parameters, as well as their basis, are the main point of this study. In this context, the calculation hypotheses will be based on the values deduced from the available documents and feedback in the field of mining limonite (studies of the MECATER Ingénierie design office, large-scale laboratory tests of some samples carried out by CERMES). The stored materials consist of non-economic products (from the exploitation of the Koniambo deposit and consist of red or yellow limonite with very fluctuating water contents) and economic products (low-grade saprolite, mineralized limonite).
Limonite is residual soil of red and yellow color. These are class A3 materials according to the GTR classification (Guide de terrassement routier du SETRA-LCPC, 1992). The maximum diameter Dmax of these materials is less than 50 mm and the percentage of particles that are bigger than 0.08 mm is about 70%.
These materials are sensitive to the remodeling produced during mining extraction. The reduction of the secondary residual structure leads to a clay-like material that is often in the plastic to a very plastic state. Several researches have been carried out on this soil to determine their characteristics. (Tables 4-6) summarize the results of recent large-diameter tests carried out as part of the characterization of limonite stored in New Caledonia (GORO Mine) by CERMES in 2019. In fact, the results of physical identification tests show that the plasticity index is close to 12 confirming that this material is very sensitive to water. Triaxial unconsolidated undrained shear tests show that limonite has high undrained cohesion. Consolidated undrained triaxial tests with excess pore pressure measurement show that limonite has a high friction angle, with an average value close to 38°, and a very low effective cohesion makeoedometer tests carried out on limonite soil makes it possible to deduce that the initial permeability of limonite having an average of 3.10-9 m/s. Considering the history of the study area and the presence of riprap fingers with a permeability of 10-3 m/s, the permeability induced in the numerical model is equal to 3.10-7 m/s.
| Sample number | Particle size distribution and sedimentation analyses | Results of physical identification tests | |||||
|---|---|---|---|---|---|---|---|
| Particle size and Sedimentometry passing (%) | Average water content 110°C (%) | Liquidity limit (%) | Plasticity limit (%) | Plasticity index (%) | Density of solid grains (t/m3) | ||
| 80 μm | 2 μm | 48.2 | 59.3 | 45 | 14.2 | 3.65 | |
| 2018-G-0518 | 69 | 20 | |||||
| 2018-G-0519 | 78 | 22 | 55.1 | 57 | 45.2 | 11.8 | 3.67 |
| 2018-G-0520 | 54 | 16 | 50.9 | 56.8 | 45.8 | 11 | 3.66 |
| Average | 67 | 15 | 51.4 | 57.7 | 45.33 | 12.33 | 3.66 |
Table 4: Summary of the results of physical identification tests carried out by CERMES (2019).
| Sample number | Results of UU triaxial tests | Cu+u triaxial test results | ||||||||
|---|---|---|---|---|---|---|---|---|---|---|
| Dry density (t/m3) | W initial % | Sr (%) | Cuu (kPa) |
φ uu (°) | Dry density (t/m3) | W initial % | W final % | C' (kPa) | φ’ (°) | |
| 2018-G-0518 | 1.24 | 49.6 | 93 | 62 | 14 | 1.24 | 49.2 | 45 | 0 | 38 |
| 2018-G-0519 | 1.22 | 50.6 | 93.3 | 68 | 11 | 1.25 | 48.2 | 45 | 0 | 38 |
| 2018-G-0520 | 1.25 | 48.2 | 91.6 | 71 | 5 | 1.18 | 54.4 | 49 | 0 | 40 |
| Average | Cuu (kPa)=67 | φ uu (°)=10 | Cu+u (kPa) =0 | φ u+u (°) =38 | ||||||
Note: Cuu: Undrained cohesion (kPa), φ uu: Undrained friction angle (°), Sr: Degree of saturation (%).
Table 5: Summary of the results of triaxial test carried out by CERMES (2019).
| Sample | Oedometric test (large diameter) | ||||||||||
|---|---|---|---|---|---|---|---|---|---|---|---|
| Initial dry density (t/m3) | Final dry density (t/m3) | W Initial | W final | e initial | e final | Cc | CV | Eoed kPa | Calculated K permeability (m/s) | ||
| Levels σv (kPa) |
Measured CV (m2/s) | ||||||||||
| 2018-G-0518 | 0.82 | 1.37 | 62.7 | 40.89 | 3.43 | 1.65 | 0.622 | 1600 | 1.62E-05 | 2.06E+04 | 7.8656E-09 |
| 1800 | 1.73E-05 | 1.77E+04 | 9.6956E-09 | ||||||||
| 2000 | 4.52E-06 | 7.54E+03 | 5.9987E-09 | ||||||||
| 2018-G-0519 | 1.05 | 1.6 | 41.91 | 30.34 | 2.49 | 1.3 | 0.647 | 1600 | 7.4E-06 | 10.5E+03 | 7.05E-09 |
| 1800 | 1.07E-06 | 21.24E+03 | 5.04E-10 | ||||||||
| 2000 | 7.02E-08 | 11.3E+03 | 6.21E-11 | ||||||||
| 2018-G-0520 | 0.8 | 1.41 | 49.47 | 30.34 | 3.57 | 1.59 | 0.752 | 1600 | 2.86E-06 | 9.8E+03 | 2.92E-10 |
| 1800 | 4.88E-07 | 21.85E+03 | 2.23E-10 | ||||||||
| 2000 | 8.10E-08 | 1.35E+04 | 6.00E-11 | ||||||||
Note: Eoed: Oedometric module, W: Water content (%), CV: Coefficient of consolidation.
Table 6: Summary of the results of the laboratory tests carried out by CERMES (2019).
The ratio is equal to 0.16 which gives a material of average compressibility.

Saprolites are soils resulting from the alteration of the source rock (peridotites). Referring to the type limonite profile (Figure 2), these types of soils appear directly above the rocky layer (bedrock). Their physical characteristics are presented in the summary (Table 7) which summarizes the different characteristics induced in the numerical model. These characteristics are collected from the history of research studies carried out on this type of material.
| Parameter | Dump limonite | Limonite | Saprolite | Bedrock | Unit |
|---|---|---|---|---|---|
| Model | Soft soil creep model | Soft soil creep model | Soft soil creep model | Mohr Coulomb | - |
| γ saturated | 20 | 18 | 18 | 22 | kN/m3 |
| γ unsaturated | 18 | 16 | 16 | 20 | kN/m3 |
| E | - | - | - | 20000 | Mpa |
| ν | - | - | - | 0.25 | - |
| Cc | 0.2 to 0.6 | 0.08 to 0.4 | 0.08 to 0.3 | - | - |
| Cs | 0.02 to 0.06 | 0.01 to 0.04 | 0.01 to 0.03 | - | - |
| C α | 0.005 to 0.022 | 0.005 to 0.022 | 0.005 to 0.012 | - | - |
| eini | 1.8 to 2.6 | 1.8 | 1.8 | - | - |
| K0 | 0.38 to 0.5 | 1-sin(φ) | 1-sin (φ) | 1-sin (φ) | - |
| C | 5 | 15 | 10 | 30 | KPa |
| φ | 37 | 35 | 25 | 45 | Degrees |
| Kx=Ky | 3.10-7to 10-9 | 10-8 | 10-6 | 10-6 | m/s |
Note: γ: Saturated/unsaturated density (KN/m3), φ: Internal angle friction (°), C: Cohesion (KN/m²), C α: Creep index, Cs: Swelling index, Cc: Compression index, Ky/Kx: Vertical/horizontal permeability (m/s), e: Void ratio, K0: Thrust coefficient at rest, ν: Poisson's ratio, E: Young modulus (MPa)
Table 7: Hydromechanical characteristics adopted in numerical model.
Numerical modeling
Numerical modeling purpose and characteristics adopted: With the goal to seek a reliable predictive calculation model, this investigation aims to make a concordance between the results of numerical calculations with experimental monitoring measurements. This research has been updated according to the duration of in-situ measurements, small-scale and large-scale geotechnical tests, new calculation codes, and the most advanced laws of behavior.
In this article, we consider the results of previous tests and research as a reference hypothesis. In this research, we will base ourselves on more than 5 years of the monitoring measurement period, using more advanced models taking into consideration the long-term consolidation and creep of materials.
For finite element modeling, we have adopted the calculation code PLAXIS2D which includes the “Soft soil creep” model well adapted to the behavior of dump limonite soil. It is a finite element modeling software recommended for the study of fine- textured soil. It calculates the displacements and stresses at any point of the structure and thus makes it possible to analyze its stability. It enables the integration of the consolidation of highly compressible soils according to several theoretical models including elasto-plastics with a breaking criterion of the type (Soft soil creep model) and permits us to simulate large deformations.
This calculation code makes it possible to consider the work hardening of soft clays and its secondary consolidation (creep). This results in an evolution of the axial deformation as a function of time and after the end of the primary consolidation. Creep evolves according to the logarithm of time (at least for observable time scales). It is characterized by the parameter C α [8]. In the calculation code PLAXIS2D, the calculations are carried out in an effective constraint using the intrinsic characteristics of the materials constituting the foundation and the waste dump (cohesion and friction angle drained).
The excess pore pressure generated by the consolidation processes of the foundation materials and the waste dump soil will be calculated according to Terzaghi’s theory. These calculations use the parameters of the consolidation (permeability and compressibility coefficient). The comparison of the actual stresses with the intrinsic fracture criterion makes it possible to assess at any time the stability potential of the waste dump.
The materials stored in the waste dump were considered as a single material with equivalent characteristics that will be determined from the calibration of the numerical model. Table 7 summarizes the different reference characteristics induced in this numerical modeling.
The boundary conditions of the numerical model studied: Calculations with the two-dimensional model in PLAXIS 2D are performed in-plane deformations. Under these conditions, the lateral extension of the waste dump is assumed to be infinite. The boundary conditions adopted for this modeling are as follows (Figures 7-9).
Figure 7: Cross-section modeled of MOK waste dump.
Figure 8: Cross-section A modeled of WAWE waste dump.
Figure 9: Cross-section B modeled of WAWE waste dump.
• Left and right sides of the model: Zero horizontal displacements and closed consolidation boundaries. These sides represent boundaries far from the model that theoretically should not be affected by the stresses induced by the waste dump.
• Model basis: Zero vertical and horizontal displacements representing a waterproof boundary.
Calculations stages: The simulated storage steps began with the gravitational loading stage of the model to create the initial stress state of the natural land. At the end of this stage all displacements will be canceled. Then, the placement and consolidation of the dump limonite layers in accordance with the real storage waste dump phasing.
In the end we will look for the profiles of the calculated horizontal displacements that correspond to the real profiles getting from the inclinometers. For the excess pore pressure cells. We compare the evolution of the measured and calculated excess pore pressure.
Calculation results and interpretation: After several simulations, the calculated inclinometer profiles are close to the measured ones. The calibration of the numerical models was carried out with an initial void ratio equal to 2.6 and a compressibility index of dump limonite ranging from 0.4 to 0.5. The parameters concluded from the numerical calibration of these two waste dumps are presented in Table 8. These calculated values are close to the values deduced from the results of the compressibility tests carried out on large diameter boreholes by CERMES in 2019. This ensures the reliability of the calibration model made. We also have managed to calibrate the index of the creep C α of the MOK waste dump which has reached its ultimate rating since 2019 with a very low storage rate (Figure 10).
| Waste dump | MOK | WAWE (Cross-section A) | WAWE (Cross-section B) | ||||
|---|---|---|---|---|---|---|---|
| Parameter | Dump limonite | Limonite | Earthy saprolites | Dump limonite | Limonite | Dump limonite | Limonite |
| Cc | 0.4 | 0.12 | 0.1 | 0.4 | 0.12 | 0.5 | 0.4 |
| Cs | 0.04 | 0.012 | 0.01 | 0.04 | 0.012 | 0.05 | 0.04 |
| C α | 0.008 | 0.008 | 0.008 | 0.01 | 0.01 | 0.015 | 0.01 |
| eini | 2.6 | 1.8 | 1.8 | 2.6 | 1.8 | 2.6 | 1.8 |
| Ratio Cc /(1+e0) | 0.11 | 0.04 | 0.03 | 0.11 | 0.04 | 0.11 | 0.04 |
| K0 | 1-sin (φ) | 1-sin (φ) | 1-sin (φ) | 0.42 | 1-sin (φ) | 0.42 | 1-sin (φ) |
| K (m/s) | 3.10-7 | 10-8 | 10-8 | 3.10-7 | 10-8 | 3.10-7 | 10-8 |
Table 8: Summary of mechanical characteristics’ results deduced from the calibration of MOK and WAWE waste dumps.
Figure 10: Comparison of recent experimental horizontal displacement (dark line) and numerical results (red line) for INC1 and INC2 inclinometers-MOK waste dump.
The numerical model carried out shows that with an equivalent permeability of limonite stored in the waste dump of 3.10-7 m/s, the calculated pore pressure value is negligible. As a result, in accordance with the 2020 observations (Figure 11).
Figure 11: Results of calculated pore pressure-MOK waste
For the WAWE waste dump. These higher displacements observed for the two cross-sections A and B were explained by the heterogeneity of the material stored. In fact the compressibility and creep parameters of the waste dump are proportional to the heterogeneity of the stored materials. These parameters can increase if the percentage of stones is low (Figures 12 and 13).
Figure 12: Comparison of recent experimental horizontal displacement (dark line) and numerical results (red line) for INC2bis and INC3bis inclinometers-WAWE waste dump.
Figure 13: Comparison of recent experimental horizontal displacement (dark line) and numerical results (red line) for INC1. INC4 and INC5 inclinometers-WAWE waste dump.
After several simulations we managed to calibrate the five inclinometers of the WAWE waste dump with a higher compression ratio ranging from 0.4 to 0.5. This index remains in the orders of magnitude for this type of material (Table 9).
| Modalities | Calibrated parameters | |||
|---|---|---|---|---|
| Dump limonite | Dump limonite | |||
| Cc | C α | Cc | C α | |
| 1 | 0.4 | 0.008 | 0.12 | 0.008 |
| 2 | 0.4 | 0.01 | 0.12 | 0.008 |
| 3 | 0.4 | 0.01 | 0.12 | 0.01 |
| 4 | 0.5 | 0.01 | 0.4 | 0.01 |
| 5 | 0.5 | 0.008 | 0.4 | 0.008 |
| 6 | 0.5 | 0.022 | 0.4 | 0.008 |
| 7 | 0.5 | 0.015 | 0.4 | 0.008 |
| 8 | 0.5 | 0.015 | 0.4 | 0.01 |
Table 9: Simulated modalities for setting the WAWE waste dump.
The models carried out show that with an equivalent permeability of limonite stored in the waste dump of 3.10-7 m/s. the field pore pressures within WAWE limonite stored are generally similar to that deduced from the numerical model (Figure 14).
Figure 14: Comparison of recent experimental pore pressure (dark line) and numerical results (red line) for CPI10-WAWE waste dump.
Note: Where black line=measured pore pressure and red line=calculated pore pressure
There are certain differences between measured and calculated displacement. We believe that these deviations are acceptable considering the following aspects-
• The heterogeneity of the materials stored in the waste dumps with the presence of a large proportion of riprap that are randomly distributed and that can sometimes concentrate near the measuring instruments and thus disrupt the results of the theoretical model (homogeneous model).
• The sequence of storage of the products: Really storage of limonite is done at the level of all the lockers with different thicknesses and different filling periods. In modeling, we only integrate the difference in level between the beginning and end of each month, regardless of the detailed storage sequence.
• The 3D effect: Simulations carried out on a two-dimensional (2D) model assume that the lateral extension of the section studied is infinite. However, the lateral confinement offered by the topography partly controls the displacement.
• The deformability of waste material stored which is very sensitive to compactness can be very variable depending on the conditions of deposition: Rainfall, the thickness of the spreading layer, and composition of the stored products.
Reliable estimates of parameters close to reality present an objective that is always intended by researchers and designers, as well as for those involved in the mining field. Definitely, from reliable numerical modeling, the mining operator can better understand and predict the real behavior of stored products and makes the good management of these discharges in a safe way. In this respect, monitoring measurements have been integrated into the storage areas to follow up on the behavior of stored waste dumps during the different storage stages.
In the present study, an in-depth interpretation of field monitoring results makes it possible to characterize the history of horizontal displacements and to evaluate the maximum values of the excess pore pressure generated during storage of the waste dumps. These results enable us to calibrate the parameters induced in the numerical model of the waste dump and consequently to develop a predictive calculation model capable of reproducing the real waste dump’s behavior.
The heterogeneity of the materials stored in the waste dump, the two-dimensional 2D simulation, the actual storage conditions such as rainfall and the way of spreading the stored products are essential factors that can give a tolerable gap between the experimental and theoretical results.
This research has been updated according to the duration of in-situ measurements, small-scale and large-scale geotechnical tests, new calculation codes, and the most advanced models. All the mechanical parameters deduced from the numerical model are in the same variation interval of CERMES laboratory tests.
1. Fuzzy AHP methodology uses rigorous and lengthy computations techniques and so a multiplatform architecture would be favorable to fully implement this methodology. Ideally a merger of MATLAB and Visual Basic. Net if possible.
2. In order to take proper decisions, strict attention needs to be paid during the implementation stages. The feedback channels must be clear and must give the expert or the decision maker the luxury to enter and manipulate the values with ease.
3. The interaction with the experts revealed the unavailability of some data that could help refine decision that needed to be made. Therefore, data such as general aquifer measurements and the average slope measurement of the various communities should be collected and be readily available to help decisionmakers make such decisions.
1. Fuzzy methods in multi-criteria situations in all facets of decision making, great attention should be paid to decision making. As a result, this technique might be used to other areas of the economy, such as manufacturing and commercial decision- making, to improve decision-making efficiency.
2. Future efforts should concentrate on creating a multipurpose architectural framework that will assist software developers in completely implementing this technique with the user at the centre.
Citation: Tlili F, Jamaa NB, Kharroubi A, Ennour S (2022) Field Monitoring and Numerical Modeling for Reliable Geotechnical Characterization of Mine Waste Dump. Int J Adv Technol. 13:196.
Received: 20-Jun-2022, Manuscript No. IJOAT-22-17990; Editor assigned: 24-Jun-2022, Pre QC No. IJOAT-22-17990 (PQ); Reviewed: 08-Jul-2022, QC No. IJOAT-22-17990; Revised: 15-Jul-2022, Manuscript No. IJOAT-22-17990 (R); Published: 22-Jul-2022 , DOI: 10.35248/0976-4860.22.13.196
Copyright: © 2022 Tlili F, et al. This is an open-access article distributed under the terms of the Creative Commons Attribution License, which permits unrestricted use, distribution, and reproduction in any medium, provided the original author and source are credited.