Journal of Medical Diagnostic Methods
Open Access
ISSN: 2168-9784
ISSN: 2168-9784
Research Article - (2015) Volume 4, Issue 4
Objective: The aim of this study is to estimate the false-positive rate of computer-aided detection (CAD) with fullfield digital mammography (FFDM) in the detection of breast cancer.
Materials and Methods: This study was conducted in the period from February, 2013 until September, 2014. It included 659 patients who presented to the radiology department for mammography. Full-field digital mammography (FFDM), three-dimensional breast tomosynthesis and computer-aided detection (CAD) were done for all patients. The patients had breast ultrasound +/- MR Mammography, with special attention to the sites of CAD suspicious lesions. Follow up protocol was done for the selected patients.
Results: From the 659 patients included in the study, 56 patients, with 70 lesions, had false positive findings of malignancy on CAD, giving a false positive rate of 8%. These cases had suspicious lesions on CAD not detected on further investigations. The results of the follow up of all patients showed no newly developed suspicious lesions.
Conclusion: The false positive rate of a CAD system in detection of breast malignancy was introduced in this study. As per the available data, example the effect of breast density on false positive CAD scores helped the radiologists in our hospital to dismiss most of the false CAD marks with more confidence with no need for further investigation. However, if CAD marks were hard to dismiss, further investigation by ultrasound +/- MR mammography was advisable.
Keywords: Full-field digital mammography; Computer-aided detection (CAD); False positive rate; Breast malignancy
Screening mammography is recognized as the single most important tool for the detection of early stage, clinically occult breast cancer, and numerous studies have demonstrated that screening mammography reduces breast cancer mortality [1,2].
Several studies have shown that nonpalpable breast cancers detected at screening are often visible in retrospect on prior mammograms [3,4]. Most studies evaluated the usefulness of computer-aided detection (CAD) to reduce the false-negative interpretations of mammograms [5-7].
Some studies have explored radiologists’ experience in evaluating mammograms as factors affecting the efficacy of CAD as an interpretive aid. Slightly increased benefits from CAD have been observed with experienced radiologists compared to novice radiologists and residents [8].
Throughout many years since the introduction of CAD, there were relatively few studies reporting the frequency of false-positive computer-aided detection (CAD) marks [9].
The aim of this study is to estimate the false-positive rate of computer-aided detection (CAD) with full-field digital mammography (FFDM) in the detection of breast cancer.
Patient selection
This study was conducted in the period from February, 2013 until September, 2014. It included 659 patients who were referred to the radiology department for mammography.
Inclusion criteria: Patients included in the study (fifty-six patients) were those who had suspicious lesions on computer-aided detection (CAD), with CAD score more than 60%, but were proven by further investigation and follow up to be negative for malignancy.
Exclusion criteria: Patients excluded from the study were those who had suspicious lesions on computer-aided detection (CAD) proven by further investigation to be positive for malignancy.
The study was approved by the local ethics committee, and an informed written consent was obtained from each patient prior to mammography and MR Mammography, whenever the latter was done.
The mammography examinations were obtained using (Selenia, Hologic Dimensions, Bedford, USA). Two craniocaudal and two mediolateral oblique views were done for each breast. No additional views were required. Three-dimensional breast tomosynthesis and CAD were generated for all patients on the Selenia workstation. The CAD system algorithms use a triangle to mark clusters of bright spots (suggestive of clustered micro calcifications) and an asterisk to mark areas of central density and radiating lines (suggestive of a spiculated mass or asymmetrical density) [10].
All obtained FFDM and breast tomosynthesis images were examined on the Selenia workstation (SecurView version7.3). In each case, an initial interpretation and assessment was done, without viewing the CAD marks. The CAD marks were then viewed and the regions of interest were re-examined on FFDM and breast tomosynthesis images, if they were not appreciated initially. The CAD marks were then classified as easy to dismiss or hard to dismiss.
Whether the CAD detected abnormality had features of spiculated mass, asymmetrical density or micro calcifications was detected for each patient. The location of the assumed lesions within the breast was recorded in centimeters.
Breast density was assessed according to breast imaging-reporting and data system (BIRADS) as fatty breasts, breasts with scattered fibroglandular tissue, heterogeneously dense and extremely dense breasts [11]. The former two categories were recorded as non-dense breasts, while the latter two categories were reported as dense breasts.
All patients had breast ultrasound done for them; as a part of the breast screening program in the hospital, using (Aplio 500, Toshiba Medical Systems, Tokyo, Japan) and (Voluson 7, GE health Care, South Carolina, USA). Special attention was given to the sites of CAD suspicious lesions. Two patients did ultrasound outside our hospital upon their request. However, they came for follow up mammography after two years with no newly developed lesions.
For the patients with hard to dismiss CAD marks, if ultrasound offered an explanation of the cause for the CAD mark, no further investigation at that time was recommended. If ultrasound wasn’t satisfactory regarding this aspect, MR Mammography was done. MRI was performed in fifteen patients.
MR Mammography was obtained using a 1.5 Tesla MRI (Optima MR 450W, GE Healthcare, South Carolina, USA) using a bilateral phased-array breast coil. The sequences used were axial STIR and sagittal fat-suppressed T2-weighted (TR/TE, 3850/67.4 ms and 4664/99.8 ms, respectively; slice thickness, 5 mm; matrix, 512 × 512), sagittal T1-weighted (TR/TE, 542/13 ms; slice thickness, 5 mm; matrix, 512 × 512), DWIs and contrast-enhanced three-dimensional dynamic Water VIBRANT-Flex sequences (TR/TE, 7.1/3.3 ms; flip angle, 12°; slice thickness, 1.5 mm; matrix, 512×512). One precontrast sequence was followed by six post contrast sequences for dynamic contrast enhanced images. Gadopentetate Dimeglumine (Magnevist; Schering, Berlin, Germany) was used as a contrast medium. The contrast medium was given intravenously over 20 s by an automatic MR compatible injector. The dose was 0.1 mmol/kg.
The DWI sequences were performed with a two-dimensional echoplanar imaging (EPI) sequence (TR/TE, 8700/63.2 ms; slice thickness, 5.5 mm; matrix, 256× 256) in the axial plane. The images were obtained with b values of 0 and 600 mm2/s. The ADC map images were created automatically by the system.
All patients were followed every six months for 2 years from the initial mammography with clinical examination and ultrasound. Follow up mammography was done every one or two years according to the patient’s age, as a part of the screening program.
The recorded data were analyzed to determine the false positive rate of CAD. McNemar’s and Chi-square tests were used to compare proportions of variables. P-values <0.05 were considered statistically significant.
From the 659 patients referred to the radiology department for mammography, 56 had false positive CAD readings. The ages of the patients varied between 40 and 68 years (mean age, 48 years).
The 56 patients had 70 lesions on CAD (10 patients had multiple lesions), (Table 1). False CAD marks were in the form of clustered micro calcifications (16 lesions), spiculated masses (19 lesions) (Figures 1 and 2) and asymmetrical breast density (35 lesions) (Figure 3).
| Lesions | Number of Lesions | CAD Score Range (%) |
| Clustered Micro calcifications | 16 | 72 - 100. |
| Spiculated Mass | 19 | 80- 100. |
| Asymmetrical density | 35 | 58-100. |
Table 1: Type of lesions suggested by CAD.
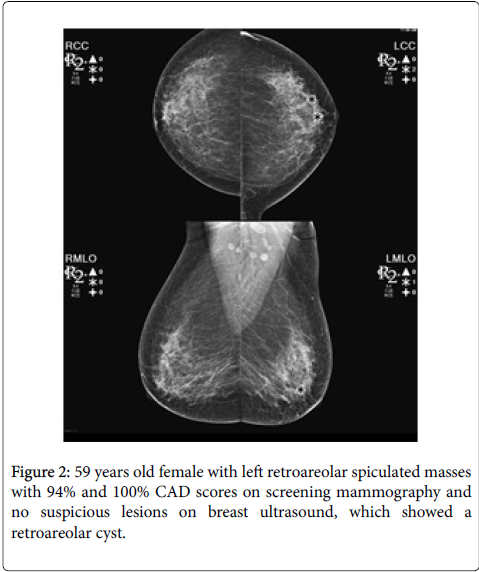
Figure 1: 43 years old female with a spiculated mass in the inner aspect of the right breast with 94% CAD score on screening mammography (A) and no suspicious lesions on dynamic MR Mammography (B and C, axial T2 STIR and post contrast water vibrant, respectively).
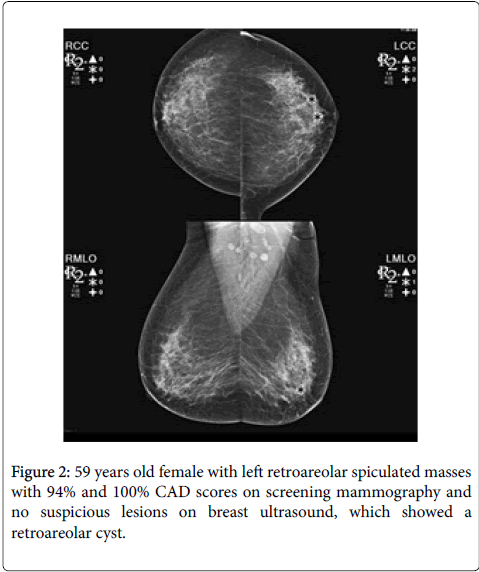
Figure 2: 59 years old female with left retroareolar spiculated masses with 94% and 100% CAD scores on screening mammography and no suspicious lesions on breast ultrasound, which showed a retroareolar cyst.
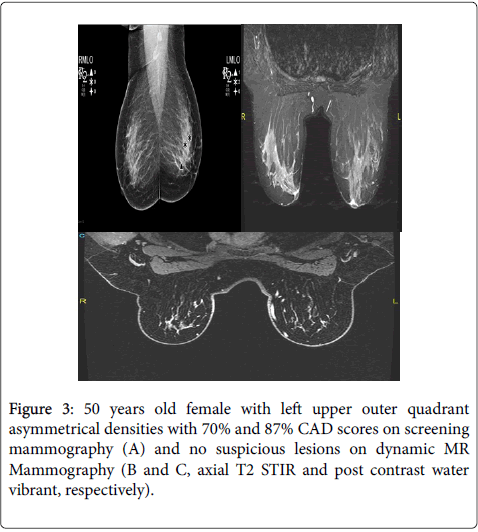
Figure 3: 50 years old female with left upper outer quadrant asymmetrical densities with 70% and 87% CAD scores on screening mammography (A) and no suspicious lesions on dynamic MR Mammography (B and C, axial T2 STIR and post contrast water vibrant, respectively).
50% of the lesions suggested by CAD (35 lesions) were easy to dismiss by the radiologist, while the other 50% were hard to dismiss, 90% of which had CAD scores 90% or more, requiring further investigation (Table 2).
| Radiologists’ Interpretation | Number of Lesions (%) |
| Hard to Dismiss | 35 (50%) |
| Easy to Dismiss | 35 (50%) |
Table 2: Refers to the results of mammographic images review after CAD interpretation.
The rates of false positive CAD marks were higher in patients with dense breasts (11%) than in patients with non-dense breasts (6.2%). From the patients with false CAD scores, 62.5% (35 patients) had dense breasts on mammography. 80% of the lesions were in the denser parts of the breasts (upper outer quadrants and retroareolar regions) (Tables 3-5).
| ACR Classification | Number of Patients |
| ACR BIRADS 3 | 35 |
| ACR BIRADS 2 | 20 |
| ACR BIRADS 1 | 1 |
Table 3: Demonstrates the ACR classification for breast densities (24) in the patients with false positive CAD.
| ACR Classification | Number of Patients |
| ACR BIRADS 3 | 322 |
| ACR BIRADS 2 | 277 |
| ACR BIRADS 1 | 60 |
Table 4: Demonstrates the ACR classification for breast densities in the study population.
| Site of Lesions | Number of Lesions |
| Upper Outer quadrant | 41 |
| Upper Inner Quadrant | 6 |
| Lower Inner Quadrant | 7 |
| Lower Outer Quadrant | 1 |
| Retroareolar | 15 |
Table 5: Specifies the site of the CAD marked lesions in the study population.
The lesions with false positive CAD marks were focal fibroadenosis (20 lesions), fibrocystic changes (11 lesions), single breast cysts (6 lesions) and benign-looking masses (3 lesions; one of which was an enlarged intramammary lymph node). Fourteen of the false CAD marks showed no abnormalities on further investigation (Table 6).
| Ultrasound Findings | Number of Patients |
| No Lesions | 14 |
| Focal Fibroadenosis | 20 |
| Fibrocystic Changes | 11 |
| Single Breast Cyst | 6 |
| Benign-looking Mass | 3 |
Table 6: Sonographic findings in the study population.
On MR Mammography, no abnormality was detected in 13 patients, while two patients had benign-looking masses, likely fibro adenomas (Table 7).
| MR Mammography Findings | Number of Patients |
| No Lesions | 13 |
| Benign-looking Mass | 2 |
Table 7: MR Mammography findings in the study population.
The results of the follow up of all the patients showed no newly developed suspicious lesions.
Accordingly, from the 695 patients who had FFDM in the study period, 56 patients, with 70 lesions had false positive findings of malignancy on CAD, giving a false positive rate of 8%.
The false positive rate of CAD causes radiologists to dismiss high numbers of CAD marks detected in a screening population [11]. With the false positive rate, a typical screening population of 1,000 women would generate 2,000 false positive marks, while detecting approximately five cancers [12].
Few studies illustrated the false positive rate of CAD. These studies used different CAD systems. Our study was the first to be performed using Selenia, Hologic Dimensions, Bedford, USA.
In our study, 50% of the lesions were considered hard to dismiss. One study pointed out that most false positive marks were easy to dismiss and didn’t affect the radiologists’ final diagnosis [13]. In another study [12], 12% and 16% (in two versions of the CAD system) of these marks were average, hard, or very hard to dismiss. The reason for the difference between our results and others could be that, in our study, most of these lesions (90%) had CAD scores equal to or more than 90% which was worrisome to the radiologist who preferred to go for further investigation to exclude breast lesions.
Yang et al. [14] found higher false positive CAD marks in non-dense breasts than in dense breasts. Conversely, Brem et al. [15] and Malich et al. [16] showed a trend towards lower false positive rates with lower breast densities. Our study results agree with Brem et al. and Malich et al. as 62.5% of the patients with false positive CAD results, had heterogeneously dense breasts, while the rest of the patients (37.5%) had fatty breasts and scattered fibroglandular tissue. In addition, from all the patients included in the study, those with false positive CAD were 11% of the patients with dense breasts and 6.2% from those with nondense breasts. The differences were statistically significant (P-value <0.05). Also, most (80%) of the false positive lesions were located in the denser parts of the breasts (Retroareolar regions and upper outer quadrants). Summation of fibroglandular tissue is the reason for the false positive CAD marks in dense breasts, giving false spiculated margins.
Most of the false positive appearances on CAD were in the form of spiculated masses and asymmetrical densities (77%). On further imaging, fibroadenosis and fibrocystic disease were present. Again, the reason for the false CAD readings was the summation of fibroglandular tissue shadows. In another patient, the lesion suspicious on CAD was an enlarged lymph node. In two patients, the lesions were benign-looking masses, likely fibro adenomas, as seen on ultrasound and MRI. In six patients, the suspicious lesions were seen on ultrasound as simple breast cysts.
Brem et al. [15] reported 63% and 58% specificities for CAD in cases with microcalcifications in non-dense and dense breasts, respectively. Yang et al. [17] reported 67% and 69% specificities in non-dense and dense breasts. In both studies, there was no statistical difference in specificity between non-dense and dense breasts. Mahoney et al. [12] had similar results with 57.4%, 70.5% and 69.2%, 82.1% specificities for v5.0 and v7.2 in non-dense and dense breasts, respectively. The specificity of CAD for microcalcifications, in our study, was 97.2% and 98.2% in dense and non-dense breasts, respectively. This difference wasn’t statistically significant.
The limitation of the study is that the assessment of the images was made by a single radiologist; who has 10 years’ experience in breast imaging and reporting.
The false positive rate of a CAD system in detection of breast malignancy was introduced in this study. As per the available data, example the effect of breast density on false positive CAD scores helped the radiologists in our hospital to dismiss most of the false CAD
marks with more confidence, with no need for further investigation. However, if CAD marks were hard to dismiss, further investigation by ultrasound +/- MR mammography was advisable.