Journal of Geology & Geophysics
Open Access
ISSN: 2381-8719
ISSN: 2381-8719
Research Article - (2023)Volume 12, Issue 2
South Mangyshlak basin is investigated in this paper. The Triassic deposits of carbonate rocks are investigated in this paper for their boundary values. These values are important for the interpretation of field geophysical data, as well as for perforation and blasting.
Triassic deposits, due to their lithological composition, are classified as either terrigenous or carbonate reservoirs. Carbonate reservoirs are found in the Middle Triassic strata containing volcanogenic dolomite and volcanogenic limestone rocks. These rocks create a complex type of reservoir that is characterized as porous-fractured, porouscavernous, and fractured. The intercalation of tuffaceous, siltstone-sandy, and mudstone rocks create the Upper Triassic sediments which overlie Middle Triassic sedimentary rocks. Oil deposits are confined to polymictic sandstones, which are saturated with oil to varying degrees.
In order to substantiate the quantitative criteria of the reservoir, experimental studies of the core samples were conducted in the laboratory. Studies of fluid flow were conducted where physical and hydrodynamic characteristics were determined when oil was displaced by displacing reagents. Correlations between reservoirs and non-reservoirs were constructed based on the obtained parameters. The boundary values were determined based on relationships between reservoir properties, such as porosity and permeability versus residual water content, as well as effective porosity and permeability versus dynamic porosity. Using these results, the porosity limits for the Middle and Upper Triassic strata have been determined to be 7%, the permeability limits for the Middle Triassic have been determined to be 0.02 × 10⁻³ m2, and the permeability limits for the Upper Triassic have been determined to be 0.3 × 10⁻³ m2.
Permeability; Effective porosity; Boundary values; Triassic deposits; Carbonate rocks reservoirs
As a result of geological exploration at Mangyshlak basin during the 70s-90s of the last century, numerous oil and gas fields were discovered with proven productivity [1-4].Triassic carbonate reservoirs in the basin exhibit a number of characteristics, including complex pore structures, high heterogeneity in flow and reservoir properties, variety of rock compositions, and many others [5-8]. These characteristics complicate the interpretation of field geophysical data, the selection of reservoirs, and the design of development models.
Since the deposits have a complex structure and several factors that negatively affect the curves, it is difficult to identify the boundaries of carbonate reservoirs in Triassic deposits using welllogging methods when applying qualitative features. Therefore, the technology of identifying reservoirs according to quantitative criteria that determine the “reservoir-non-reservoir” boundary at the static level is necessary to clarify the interpretation [9-12]. In order to determine the boundary values, correlation dependencies were constructed based on the parameters obtained from special laboratory core tests.
Lithological and petrographic characteristics of Triassic carbonate reservoirs
Lower Triassic deposits (T1): The carbonate-terrigenous sequence of the Lower Triassic (T1), which lies at the base of the oil and gas complex, is composed of rhythmically interbedded siltstones, sandstones, mudstones, and limestones. Due to numerous ammonite finds in the carbonate-terrigenous sequence, the age of the carbonate-terrigenous sequence has been determined to be late Olenekian [13-15]. The reservoirs (porous-fractured) are composed of arkosic sandstones with effective porosity from 8 to 18%, fracture permeability up to 6.5 × 10⁻³ μm2, and porous permeability from 0.1 to 141 × 10-3 μm2 [16,17].
Middle Triassic deposits (T2): The Middle Triassic deposits (T2) consist of a volcanic-carbonate grey-colored formation, which accumulated under the conditions of a marine brackish-water basin and humid conditions. The formation consists of three lithological layers (from bottom to top):
• Volcanogenic-dolomitic
• Volcanogenic-limestone
• Volcanic-argillic
A volcanic-dolomite layer lies on the underlying Lower Triassic. The composition of this rock is characterized by the wide development of oolitic-cloddy tuffs, tuffites, tuff mudstones, and clastic polydetrital limestones. Due to the development of carbonate rocks, which can be easily leached, reservoir properties such as effective porosity and permeability are high. It has a porosity of up to 28% and a permeability of 115 × 10-3 μm2 [18- 20].
The void space is represented by intra-form isolated pores formed as a result of calcite leaching. The inter-formal space is filled with clear-crystalline calcite.
Immediately above the section is a volcanogenic limestone sequence, consisting of limestones with rare interlayers of dolomites, tuffites, tuff sandstones, mudstones and siltstones. The limestones are highly bituminized, which causes the black color of the rocks. There is a significant reduction in reservoir properties due to the widespread development of tuffaceous rocks.
The upper part of the Middle Triassic section-volcanogenic- argillite sequence is composed mainly of mudstones with an admixture of tuffaceous material and thin interlayers of carbonate rocks (lower part) and siltstones (upper part). The rocks are characterized by low reservoir properties and are often taken as a seal for hydrocarbon deposits confined to the carbonate layer [21,22].
Upper Triassic deposits (T3): There is a coarse-grained unit at the base of the stratum with a thickness of 40 m to 70 m with the following reservoir properties; effective porosity up to 20%, permeability of 10 × 10-3 μm2 [23,24]. The overlying part of the section is composed of inequigranular tuff sandstones, tuff siltstones, and tuff mudstones [25,26].
The total thickness of the Middle Triassic deposits within the South Mangyshlak reaches 600 m-650 m [27,28].
To assess the boundary values, studies were carried out on the selected core in the period 2010-2019 [29-30]. General information on sampling for the core studies is presented in Table 1.
| Field/ Well | Horizon | Lithology | Number of experiments |
|---|---|---|---|
| X-10 | Т3, Basal | Fine-grained sandstone | 2 |
| X-3 | Т3, Basal | Fine-grained sandstone | 2 |
| Y-9 | Т3, Basal | Tuff sandstone | 2 |
| Y-40 | Т3, Basal | Tuff sandstone | 2 |
| X-15 | Т2, volcanic-dolomitic | Calcareous dolomite | 1 |
| X-27 | Т2, volcanic-dolomitic | Clastic dolomite, cavernous | 1 |
| Y-40 | Т2 | Tuff siltstone | 1 |
Table 1: Detailed information about selected samples.
To assess the boundary values of porosity and permeability properties, a 2-phase flow unit was used, the main elements of which are:
1. Vertically positioned core holder designed for core samples with a diameter of 1½ inches and a length of 12 inches.
2. Vertically positioned X-ray system for continuous core scanning and real-time determination of water-oil saturation.
3. A set of precision pumps and temperature sensors for fluid flow under thermobaric conditions.
4. Transducer module for differential pressure detection.
Preparation of core samples
The preparation of core samples for experimental studies included several stages.
Stage 1: Drilling samples with a diameter of 1½ inches were collected from the working part of the sawn core.
The resulting cylindrical samples were packed in plastic bags and sent to the extraction room for cleaning from hydrocarbons, formation water and salts. Samples were extracted in Soxhlet devices using toluene as a solvent [31-33], then a mixture of chloroform and methanol in a ratio of 9:1, respectively.
Purification completeness was determined in the process of daily monitoring by fluorescence in UV light as well as by weighing the samples after extraction and drying.
As soon as the cleaning process was complete, the samples were dried in a controlled humidity oven at 65ºC until their weight reached a constant value.
Afterward, the samples were placed in a desiccator with silica gel to prevent the adsorption of moisture from the air and sent for standard and special core studies.
Stage 2: Matrix density, porosity, and absolute permeability were determined by standard core testing. To measure the matrix density of grains, coefficients of effective porosity, and absolute permeability of rocks, an UltraPoroPerm-500 device from Core Laboratories Instruments (CLI) was used [34,35].
The operating principle of the porosimeter is based on the use of the Boyle-Mariotte law. The gas volumetric method using helium was used to determine the matrix density and porosity of the samples. The porosity coefficient was calculated by the program as the ratio of the pore volume to the volume of the sample, with pore volume being the difference between sample volume and grain volume.
Absolute gas permeability was measured during steady-state flow using a standard Hassler core holder by injection of nitrogen gas. The operating principle of the permeameter is based on the use of Darcy's law [34,36]. A hydrostatic pressure of 400 psi was applied to the side surface of the sample. The absolute permeability of the rock was automatically calculated when the airflow followed the Darcy law.
Stage 3: In addition to the saturation of core samples using an auto-saturator with a reservoir water model, measurements were made of partial and residual water saturation coefficients, relative phase permeability of oil and water, and residual oil saturation. Before the start of the experiments, the selected samples were saturated in a vacuum saturator with a Reservoir Water Model (RWM) using a prepared synthetic solution of the NaCl type with a mineralization of 20–40 g/l. A preliminary vacuum of the samples and saturating fluid was performed. In order to determine if the pore space is completely saturated, the porosity obtained by the saturation of the samples with RWM was compared with that calculated from the gas-volume method using helium. Crude-filtered oil was also prepared to saturate the core sample during the experiments.
The core samples, pre-saturated with RWM, were placed in a specially designed gamma-ray-transmitting core holder, where reservoir pressure was created. First, the water phase permeability of the rock was determined at 100% RWM saturation. Then, without removing the sample from the core holder, water was displaced under reservoir conditions using crude oil, and the coefficients of residual water saturation and oil phase permeability were determined. The coefficient of residual water saturation of core samples was determined from the results of X-ray scanning [37-39].
Steady-state studies
As soon as the core samples had been prepared, oil and water were injected simultaneously in different proportions: 75/1, 25/1, 5/1, 1/1, and 1/10. Each subsequent batch injection was performed after the stabilization of the differential pressure.
With the aid of an X-ray scanner, the effective permeability of each phase and water saturation of the samples were measured at each stage of the experiment.
After batch injection of two phases, water injection equal to 25 times the pore volume was performed until residual oil saturation was achieved, and oil phase permeability was determined.
The water saturation of the sample extracted from the core holder was also determined by the extraction method in the Dean-Stark apparatus [40-42].
To determine the oil phase permeability, the samples were additionally cleaned, dried, and saturated with crude oil. Then, the samples were placed in a core holder, after which crude oil was injected and the oil permeability coefficient was determined at 100% oil saturation.
The results of the experiments performed are presented in Table 2.
| Indicators | Unit of meas. | Experiment | ||||||||
|---|---|---|---|---|---|---|---|---|---|---|
| No 1 | No 2 | No 3 | No 4 | No 5 | No 6 | No 9 7 | No 8 | |||
| Field/well | X-10 | X-3 | Y-9 | Y-40 | ||||||
| Laboratory no of the sample | 26 | 22 | 5 | 7 | 225 | 242 | 219 | 220 | ||
| Lithology | Sand-stone | Sand-stone | Sand-stone | Sand-stone | Tuff sandstone | Tuff sandstone | Tuff sandstone | Tuff sandstone | ||
| Depth | m | 3256.2 | 3262.12 | 3699.54 | 3698.87 | 2962.03 | 3037.31 | 3703.05 | 3703.23 | |
| Effective porosity | Fraction | 0.155 | 0.175 | 0.143 | 0.140 | 0.246 | 0.138 | 0.180 | 0.182 | |
| Absolute Permeability | × 10-3 µm2 | 107.9 | 206.9 | 32.0 | 31.6 | 23.1 | 1.4 | 51.1 | 29.1 | |
| Density of formation water | g/cm3 | 1.056 | 1.056 | 1.056 | 1.056 | 1.061 | 1.061 | 1.061 | 1.061 | |
| Oil viscosity | mPa.s | 0.560 | 0.560 | 0.560 | 0.560 | 1 | 1 | 1 | 1 | |
| Oil density | g/cm3 | 0.758 | 0.758 | 0.758 | 0.758 | 0.798 | 0.798 | 0.798 | 0.798 | |
| General mineralization | g/l | 28 | 28 | 28 | 28 | 21 | 21 | 21 | 21 | |
| Residual water saturation | Fraction | 0.220 | 0.230 | 0.276 | 0.262 | 0.384 | 0.470 | 0.334 | 0.391 | |
| Residual oil saturation | Fraction | 0.356 | 0.325 | 0.349 | 0.355 | 0.345 | 0.349 | 0.366 | 0.351 | |
| Water permeability at residual oil | × 10-3 µm2 | 5.676 | 5.860 | 8.022 | 7.977 | 6.545 | 0.216 | 17.556 | 5.470 | |
| Oil permeability | × 10-3 µm2 | 13.583 | 13.292 | 4.920 | 5.687 | |||||
| Oil permeability at residual water | × 10-3 µm2 | 5.988 | 5.860 | 4.305 | 4.399 | 15.620 | 1.010 | 42.510 | 18.950 | |
| Oil displacement coefficient | Fraction | 0.539 | 0.578 | 0.519 | 0.519 | 0.441 | 0.273 | 0.450 | 0.424 | |
| Experiment temperature | ºC | 130.6 | 130.6 | 130.6 | 130.6 | 115 | 115 | 115 | 115 | |
Table 2: Results of special core studies.
According to the results of the studies, Figure 1 presents graphs of relative permeability for both water and oil. The following conclusions can be drawn from these graphs of relative permeability:
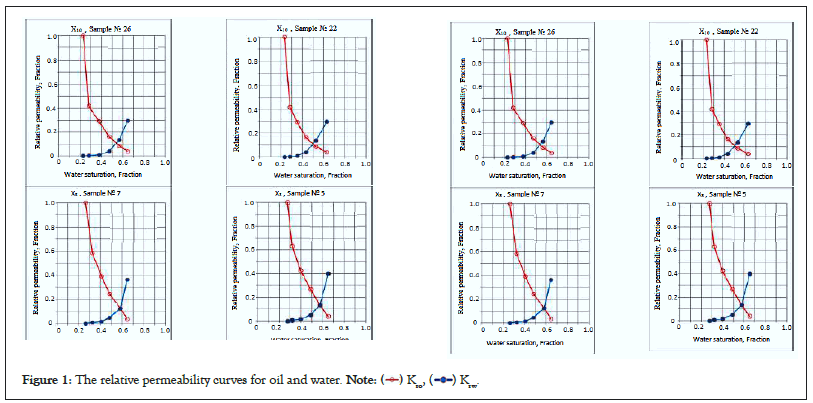
Figure 1: The relative permeability curves for oil and water. 
1. Residual oil saturation of rocks varies within 32.5-36.6%.
2. Residual water saturation within 22.0-47.0%.
3. Oil displacement ratio is 27.3-57.8%.
4. The limiting value of the relative permeability of water is 0.2- 0.4 units, indicating that the rocks are hydrophilic.
According to the results of special studies conducted, residual water saturation and oil saturation were determined.
The dynamic porosity of rocks was calculated using the following expression:
ϕD=ϕe*(1-Sw-S0) ...(1)
Where:
ϕD-Dynamic porosity;
ϕe-Effective porosity of rocks by helium;
Sw-Residual water saturation;
S0-Residual oil saturation.
As the residual water-oil saturation is considered, the dynamic porosity characterizes the capacitive and flow properties of the formation. When the rock has a dynamic porosity of 0%, the residual water-oil saturations fill the entire pore space, making it a non-reservoir. It is possible to estimate the boundary values of Upper Triassic productive reservoirs using the constructed relationships "dynamic porosity-effective porosity" and "dynamic porosity-absolute permeability" presented in Figures 2 and 3.
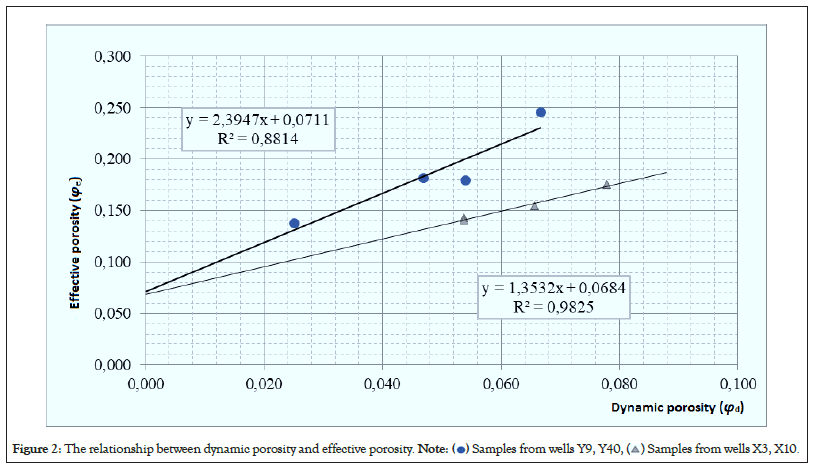
Figure 2: The relationship between dynamic porosity and effective porosity. 
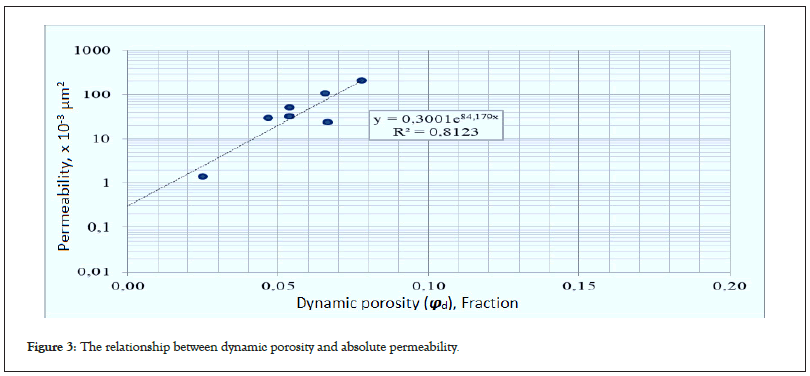
Figure 3: The relationship between dynamic porosity and absolute permeability.
Thus, the limit values for Upper Triassic reservoirs are defined as:
1. The porosity boundary value is 7%.
2. The value of the boundary permeability is 0.3 × 10⁻³ μm2.
The Middle Triassic rocks were also studied in depth. Samples were taken from different wells and fields.
However, when performing studies for rocks from several fields, when water was injected, the differential pressure increased to 3200 psi, and the water permeability was less than 0.1 × 10⁻³ μm2, which did not allow further studies. This factor may be related to the hydrophobicity of the rocks. A summary of the initial information and results can be found in Table 3.
| Indicators | Unit of measurement |
Experiment | ||
|---|---|---|---|---|
| No 5 | No 6 | No 7 | ||
| Field/well | Х-15 | Х-27 | Y-40 | |
| Laboratory no of the sample | 259A | 161 | 2 | |
| Lithology | Calcareous dolomite | Dolomite | Tuff siltstone | |
| Depth | m | 2944.91 | 3789.55 | 3588.31 |
| Effective porosity | Fraction | 0.237 | 0.153 | 0.103 |
| Absolute permeability | × 10-3 µm2 | 63.7 | 0.63 | 0.237 |
| Density of formation water | g/cm3 | 1.061 | 1.06 | 1.061 |
| Oil viscosity | mPa.s | 1 | 1 | 1 |
| Oil density | g/cm3 | 0.798 | 0.8 | 0.798 |
| General mineralization | g/l | 24.5 | 21 | 21 |
| Residual water saturation | Fraction | 0.27038 | 0.453 | 0.35 |
| Residual oil saturation | Fraction | 0.464 | - | - |
| Oil permeability | × 10-3 µm2 | 4.81 | 0.11 | 0.05 |
| Oil permeability at residual water | × 10-3 µm2 | 3.76 | - | - |
| Oil displacement coefficient | Fraction | 0.364 | - | - |
| Experiment temperature | ºC | 115 | 115 | 115 |
Table 3: Results of special core studies.
For a more reliable determination of the hydrophobization of rocks, the most permeable laboratory sample No. 259A (63.7 × 10⁻³ μm2), represented by calcareous dolomite, was chosen. The studies were carried out in a steady-state mode. The results are presented in Figure 4.
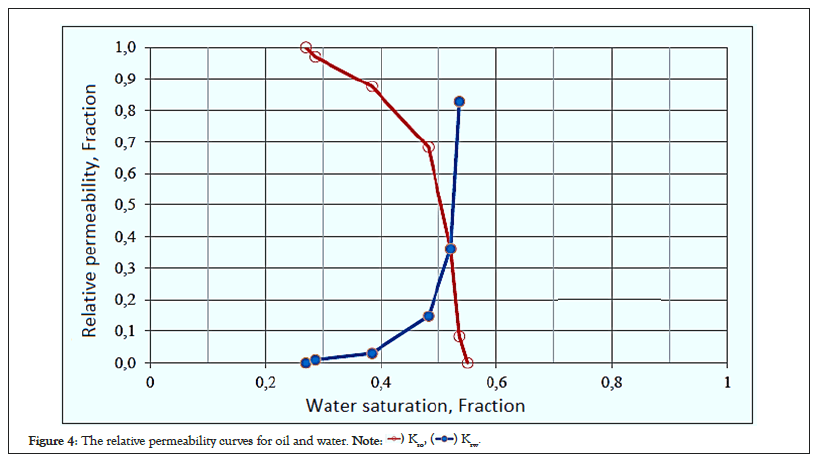
Figure 4: The relative permeability curves for oil and water. 
As a result of the relationship between the relative permeability of oil and water, we can conclude the following:
1. Residual oil saturation of rocks is high-46.4%;
2. Residual water saturation-27.0%;
3. Oil displacement ratio is only 36.4%;
4. The limiting value of the water's relative permeability is 0.83 units, which indicates the hydrophobicity of the rocks.
To determine the boundary value of the effective porosity of rocks, instead of determining the residual oil saturation and, accordingly, dynamic porosity, a mass determination of capillary pressure was performed under reservoir conditions using a high- speed centrifuge.
The studies involved 124 samples selected in 2012-2015 [43-45]. A maximum capillary pressure of 215 psi was used to determine residual water saturation. The obtained values of residual water saturation are compared with effective porosity. The dependencies are shown in Figures 5 and 6.
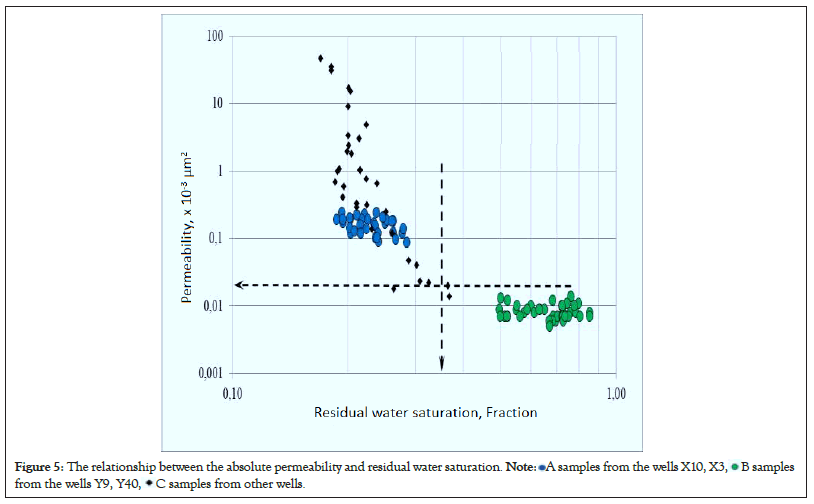
Figure 5: The relationship between the absolute permeability and residual water saturation. 

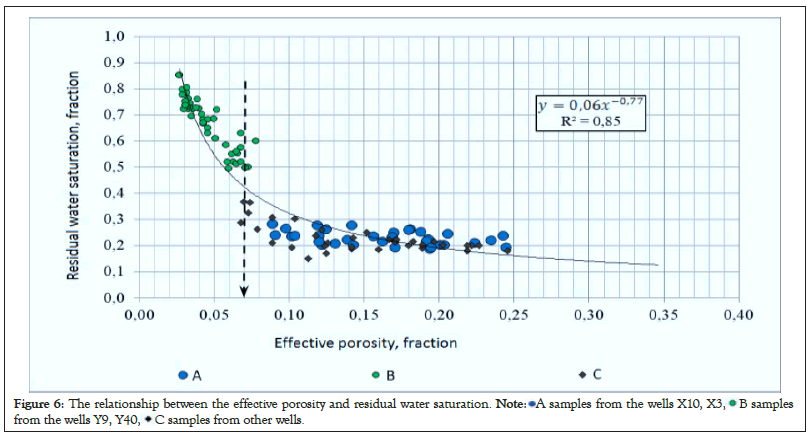
Figure 6: The relationship between the effective porosity and residual water saturation. 

According to the constructed dependencies, it can be seen that with a residual water saturation of more than 35%, the reservoir properties of rocks deteriorate, the fluid occupies the entire pore space, and the rock becomes a non-reservoir.
Thus, the defined limit values for volcanic-carbonate rocks of the Middle Triassic are as follows:
1. The porosity boundary value is 7%.
2. The value of the boundary permeability is 0.02 × 10⁻³ μm2.
The reliability of reservoir properties determination in the course of well-logging data interpretation depends on the reliability of established petro-physical relationships and parameters. The quality of the core analysis carried out in the 80s does not allow today to use the results of these analyzes to build petro-physical relationships for the following reasons:
1. A low level of core recovery.
2. The lack of results from the profile studies intended to link the core to the rock section.
3. Lack of uniform sampling of cylindrical samples from all intervals, including low-permeability and non-reservoirs.
4. Insufficiency of studies-the lack of a set of studies on the same samples to establish the closeness of relationships between various parameters.
Consequently, the selection of cores and the study of reservoir properties of rocks should be continued.
Experimental analyses of the core samples were conducted in the laboratory in order to substantiate the quantitative criteria of the reservoir. By analyzing the parameters, correlations were constructed between reservoirs and non-reservoirs. Boundary values were determined by analyzing the relationships between reservoir properties, such as porosity and permeability, and residual water content. Based on the results of this work, the porosity limits for the Middle and Upper Triassic strata are 7%, the permeability limits for the Middle Triassic are 0.02 × 10⁻³ μm2, and the permeability limits for the Upper Triassic are 0.3 × 10⁻³ μm2. The use of the obtained boundary values contributes to the identification of complex carbonate reservoirs using both qualitative and quantitative features based on the difference in reservoir properties of reservoir rocks and host rocks. Since cores are being taken from new wells and various fields, the study of boundary values needs to be continued.
[Crossref]
Citation: Al-Obaidi SH, Chang W (2023) Evaluation of the Quantitative Criteria of Triassic Carbonate Rocks Reservoirs. J Geol Geophys. 12.1072.
Received: 20-Jan-2023, Manuscript No. JGG-23-21475; Editor assigned: 23-Jan-2023, Pre QC No. JGG-23-21475 (PQ); Reviewed: 13-Feb-2023, QC No. JGG-23-21475; Revised: 20-Feb-2023, Manuscript No. JGG-23-21475 (R); Published: 27-Feb-2023 , DOI: 10.35248/2381-8719.23.12.1072
Copyright: © 2023 Al-Obaidi SH, et al. This is an open-access article distributed under the terms of the Creative Commons Attribution License, which permits unrestricted use, distribution, and reproduction in any medium, provided the original author and source are credited.