Journal of Geology & Geophysics
Open Access
ISSN: 2381-8719
ISSN: 2381-8719
Research Article - (2022)Volume 11, Issue 8
The upper crust of the Sanoukou area, Kenieba district in the southwest parts of Mali are well known for the placer gold occurrences. The extraction of the gold by using primitive tools has been practiced since long period in the region. However, mining of placer gold in Mali has not been given due consideration so far. The study of the placer deposit of Sanoukou stream terrace has, therefore, been carried out to determine the mineralogy their texture, size and shape of these placer deposits, which help in investigation the source rock for gold and also to design methods for the extraction of placer gold in more economic manner. Placer deposits result from weathering and release of the gold from lode deposits, transportation of the gold, and concentration of the gold dominantly in stream gravels which composed mainly of laterite-gravels with clay cemented. Unless preserved by burial, a placer subsequently may be eroded, and either dispersed or re-concentrated.
The estimation of mineral resources/reserves together with a quantification of the distribution of metallurgical attributes provide strong evaluation of the large alluvial gold deposits within west Sanoukou and its surrounding, which occurs along the flank of the stream. This reduces the risk arising from uncertainties within the ore body as far as geological and metallurgical information are concern and also improve decision making processing during the production stage of the mining project.
Hand-dug pits data formed the basis for the estimation of the source as well as the determination of the spatial distribution of the metallurgical parameters of the west Sanoukou gold deposits. A typical grid density of 50 m × 50 m was used for the pitting between 2 m to 7 m depth. Detailed logging of pit samples together with processing provided first-hand information concerning the metallurgical behaviour of the gold bearing gravels and subsequent distribution of these parameters. The estimation of the mineral sources have been based on an initial estimation of the gold grade and gravel section using the Inverse Distance Weighting (IDW) technique and subsequent estimation of the sources using the volume and mean grade of the ore. A total volume of 448,672 m3/717875 tones gold bearing gravels were estimated at average grade of 0.1675 g/t and 120,244 grams of the alluvial gold within the area of 600 m × 300 m. With 92% purity of gold so the estimate resource will be 110,624.538 g equal 3,539.71439 oz.
The gold within the study area are usually fine in nature with majority of the fine to medium gold occurring at the upstream of the drainage in the area. Clayey materials also represent large portion of the gold bearing gravels in almost all the sampled area.
Gold in Placer; Gravels; Laterite
The exploration block of West-Sanoukou covers an area of about 23.5 km2. This will describe the recent geological works and Gold in Placer potentiality performed on the block of West-Sanoukou as well as the conclusion and recommendation of the future works.
Alluvial gold deposits occurred throughout the country in favorable areas overlying Birimian metavolcanics and metasediments rocks. The vast majority of historical gold production from Mali came from a myriad of small streams and rivers draining areas with underlying oxide and primary gold deposits. In addition, several of the major rivers have been mined with dredges; large alluvial operations were started up on river valleys in several alluvial gold districts. With the recent increase in the gold price over the past several years, the amount of small‐scale gold mining, primarily of alluvial deposits, has increased dramatically throughout Mali and especially in places like the Kenieba and south west Mali, where substantial alluvial gold resources are known. Those of the alluvial gold occurred along the Rivers and streams, north of Kaye in the central region of Mali. As reported by Levich et al. [1], the lower gold bearing gravel lies on top of weathered Birimian with thickness ranging between 2-7 m and is overlain by similar thickness of gravel barren overburden consisting of silt and clay materials. The gold bearing gravels of the streams and River deposit contains large pebbles to cobbles size clast up to 15 cm in diameter, in matrix of quartz and heavy minerals at the deposit of Senegal River flanks. The deposits are found within the valleys and are covered by silt and clay-rich overburden and ferricrete. The overburden is massive and is in sharp contact with the underlying gravels which also filled most of the valleys within the area. The overburden within the area is very thick and sometimes can be deep as 4-7 m although some few areas may record very thin overburden where the gravel section seems to appear on the surface. The Kenieba (Sanoukou) area has long been known for very significant alluvial gold and although some dredging was attempted within the Upper Birimian, most of the production has come from dozens of the smaller drainages all along the flanks of the Kenieba Range. The most famous historical site was at Dabara and other around areas where artisanal mining took place for generations and several sluicing operations were carried out in the early indicated that the Kenieba and the Senegal flanks area features boulder gravels up to 2.5 m thick and these are overlain by clay/silt overburden of a similar thickness; very coarse nuggets.
Location and accessibility
The exploration block of West-Sanoukou is 7 km far by the lateritic road in south-west of Kéniéba city and is located in the topographical map of Kéniéba in west of Mali, Kéniéba in the region of Kayes (Figure 1). The block is located around 8 km far from the high deposit of Gounkoto and 25 km far from the deposit of Tabakoto. It is located to 640 km far from Bamako. It is accessible through the paved road from Bamako-Kita-Kéniéba and the unpaved lateritic road Kéniéba-Sanoukou.

Figure 1: Location of West-Sanoukou Block.
The sector of Sanoukou is administratively part of the Kéniéba. It is determined by A, B, C, and D; therefore, its coordinates (Table 1) are as follow:
| Points | Geographical coordinates | UTM Coordinates | Area Km2 | ||
|---|---|---|---|---|---|
| X Easting |
Y Northing |
X Easting |
Y Northing |
23.5 | |
| A | 11°20'42"W | 12°49'39’’N | 245466 | 1419217 | |
| B | 11°18'00"W | 12°49'39’’N | 250353 | 1419173 | |
| C | 11°18'00"W | 12°47'03"N | 250310 | 1414377 | |
| D | 11°20'42"W | 12°47'03"N | 245423 | 1414421 | |
Geomorphological characteristics of the study area
The largest part of the region is marked by very dominated and accidental plates with slight attitude which overhangs a serial of peneplains. The region of Kéniéba is morphologically characterized by a succession of lateritic hills and grey-wakes schists outcrops separated by valleys with many streams. We distinguish there two major types of morphology (Figure 2): The largest part is characterized by the slight attitude plates whose long Crests are recovered by hard layers containing lateritic breastplates which extend to several kilometres. In the east, the cliff Tambaoura made of sandstone rises more than 350 m and overhangs the vast peneplains that extends to alluvial lowland of Falemé in west and here represent the DEM (Figure 3), with lowest elevation of about 109.9 m and the highest point is about 140.9 m.

Figure 2: The Geomorphological Map of West Sanoukou Block.

Figure 3: Shows the DEM of the West Sanoukou Area.
Many seasonal streams among them we mention Mogoyafara makes border around this region and flow to North-west direction in order to flow in Falémé near the frontier of Senegal.
The Sudan-Sahel climate is characterized by two alternated seasons:
1. A dry season which is composed of.
2. A dry and cold period from (November to February) which is characterized by a decrease of temperature between (30°) daylight and (6-10) during the night;
3. A dry and warm season from (March to May) which knows the highest temperatures (35-45°) less marked variations.
4. A rainy season from June to October with some respites which last several days. The average rainfall of the last ten years oscillates from 800 to 1,200 mm opposed to 1,200 -1,600 mm the previous years.
The vegetation is wooded Savannah where wild grasses are dominated by huge trees such as Shea, néré, cail-cedrat, etc. The type of vegetation is identified by the relief structure and the soil type. The dense and leafy vegetation (gallery forest) generally grows along the streams. The wildlife till exists in some wooded and isolated zones. It essentially includes antelopes, monkeys, warthogs, and some scare panthers and lions as well as birds like guinea fowls, partridges, vultures, and owls. It is also characterized by poaching because of secular hunting in this area. The population is essentially made of Malinkés that practice traditional mining, agriculture and breeding. The incomes of the region derive from agriculture, breeding and gold.
Geology of the study area
Based on field observation and previous information a lithostratigraphic sequence is proposed below (Table 2). The dominate rock group is a low grade volcano sedimentary sequence which comprises andesitic, dacitic, volcanics and sub volcanic unit overlain directly by volcano-classtic rocks derived from the underlain volcanics (Figure 4).
| S. No. | Unit |
|---|---|
| 1 | Lateritic ferricrete |
| 2 | Old alluvial silt and gravel |
| 3 | Sand Stone formation |
| 4 | -------------------- unconformity ---------------------------- |
| 5 | Dykes and Veins |
| 6 | Low grade Volcano-sedimentary Sequence (green stone) |
Table 2: Proposed Litho-stratigraphic Sequences.

Figure 4: Geological Map around Sanoukou Village.
They show typical graded bedding characteristic of turbidities (Figure 5). They are weakly metamorphosed in lower green schist facies of regional metamorphism.The volcanic and volcano-classtic sediments are cut by series basic (dolerite) and acidic (felsite) dykes. The volcano sedimentary sequence is unconformity overlain by a sandstone formation. The sandstone is endiorated and shows clear cross bedding structure typical of alluvial depositional environment. The sandstone forms topographically high sacraments (Figure 6). The younger most units in the area are a thick facies of lateritic ferricrete (Figure 7). The low land and water curve contain older gravel and silt deposits (Figure 8).

Figure 5: Showing Typical Graded Bedding Characteristic of Turbidities.

Figure 6: Showing Sandstone Forms Topographically High Sacraments.

Figure 7: Showing Lateritic Soil Profile Capping by Ferricrete Horizon.

Figure 8: Showing Older Gravel and Silt Deposits.
The area of Kenieba is affected by a sinistral strike slip shear zone (Kenieba Shear Zone–KSZ) of a regional extent. A kinematic indicator of shearing includes sub horizontal stretching lineation (Figure 9), asymmetrical interfolial S-shape folds, Boudinage structures, and mylonite zones. The shear bands vary in width from few cm in the hard rocks to tens of meters in the soft metasediments. This shear has played an important role by creating structural porosity and control gold mineralization in the terrain.

Figure 9: Shows Kinematic Indicators of Shearing Include Sub Horizontal Stretching Lineation.
Placer gold
The area witnesses intense artisanal gold mining activities. The blocks have been largely hit by illegal miners who targeted the richest horizons leaving behind the low grade and devastating the environment. The study executed a pitting program which slowed good results both in old tresses and berried channels along active and seasonal streams. An area of 600 m × 300 m (0.377 km2) has been selected for evaluation rich is now in progress. The result obtained so far are very encouraging and mining with consideration to the environment will be soon.
All pits data were derived from the work done in the field by using two methods of pitting. The first time the team used 1 m × 1 m dug pitting with the help of a typical hand dug tools consisting of axes, long sharp metal and spade up to 2 m depth, the second time after verified the results in the same area of the study used excavators machine for pitting up to the bedrock and then the sections of the alluvial sediments were described.
Pitting and process of samples
A 1 m × 1 m hand dug on grid density of 50 × 50 m was used in getting through the overburden up to two meters depth in the first round of the study after verified the work and discussion, in second round with an excavator excavation of 3 m × 3 m was used in getting through the overburden, gravel section, saprolite horizons to the bedrock during the pitting activities. The pitting into placer deposit is one of the oldest techniques use to sample alluvial deposits.
Pitting is more reliable than drilling especially in the area where the deposits occurs close to the bedrock, because it gives more reliable information about various sections and also provide more representative samples.
Bulk samples from the exploration program were processed using panning dishes where final concentrate were collected and hand separated with the help of binocular microscope. The recorded gold from pan concentrate is then recorded in grams together with the pit ID. Depends on the previous work done in the area, the gravelly samples have been washed in order to ensure that all of the gravels are really well cleaned so that all the gold liberated and subsequently recorded. However, the second method is very impractical and takes long time, but used to check and confirm results from the previous pits where the gravels were processed through a Prospector.
Data analysis
Data analysis which forms a small portion of the overall scheme of the work has the potential of revealing database errors which can be detrimental to the efficient reporting of resource volume, grade and classification. The histogram has been used to graphically examine the data-set. In addition to the graphical examination, descriptive statistics were carried out to compute statistical measure such as mean, mode, variance, standard deviation etc.
Geo-spatial interpolation
Geo-spatial technique was used for the interpolation of the gold grade and grade thickness of the deposit to determine the weighted average. The method used in this study is the Inverse Distance Weighting (IDW) method which estimates spatial variability of parameters based on the weighting of neighbourhood sample points. Several authors [2-4], have used the technique to analyse the spatial variability of gold grade in fluvial sediments and other soil parameters.
The idea behind IDW interpolation is based on Tobler’s first law of geography [5], which states that “All places are related, but nearly places are more related than distance places”. The estimation of values for unsampled areas is primary based on the nearest point than further away sampled points. To satisfy the Tobler’s law IDW uses another exponential number which gives more weighting to the close points during its estimation. For the purpose of this study, exponential power of two (2) is used for the interpolation of the various parameters. This value is known to be the best exponential values that best fit the IDW estimation [2,6].
To evaluate the accuracy of the estimation cross validation using the Root Mean Square Error (RMSE) was initiated. This validation has been recommended by authors Tunçay et al. [3], Mettemicht et al. [4], Webster et al. [7].
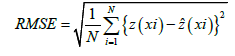
Where (xi) is the estimated (predicted) value, the known value is represented by z, N is the number of samples and RMSE is the root mean squared error. Getting predictions values close to the observed values gives a small RMS error. These smaller l values are preferred as far as the geostatistical interpolation is concerned. Although RMS error is able to tell much about the accuracy of the estimation, errors may still exist within neighbourhood sample points [2].
Resource estimation
The resource potential was estimated to know the amount of fine gold within the study area after the estimation of the mean gold grade and gravel thickness. The method used for the resource potential here is given as P=VG.
After Chirico et al. [8], where P is the estimated resource potential of the study area, V is the volume of the gravel section (deposit) and G is the mean (average) grade of the deposit. The mean grade used for the final calculation of the gold resource potential was derived from the generated grade estimation from the IDW model.
Pit lithology
The various sections of the pits (Figure 10) were logged to determine the overburden thickness, gravel thickness, depth to bedrock, and the overburden materials as well the gravel section lithology. The depth of most of the pits ranges from 2 m-6 m with most section being the overburden. Overburden ranges from 0-5.0 m whiles the mineralized section ranges from 3.0 to 5.0 m in some places up to 7.0 m. The uppermost layer is mostly clay with laterite whiles the middle section comprises of quartz pebbles with silty clay or with laterite in some areas. The layer which usually ends the pit is the saprolite zone which continues as the bedrock. The various layers or sections encountered conform well to other alluvial deposits studied elsewhere [9]. They normally consist of three lithographically in-homogeneous units in vertical succession.

Figure 10: Showing Location of Pits Samples. Note: ( ) Location of pits
sample.
) Location of pits
sample.
Statistical results
About 112 pits have been analyzed for the optimal resource estimation. Since the technique of determining normal distribution of datasets is either through graphical representation of the data or descriptive analysis, the histogram and other diagram is used as the best graphical representation of the normal distribution of this geological datasets (Figure 11). It is important to have a normally distributed datasets before performing any inferential statistical analysis. The graphical representation of the gold grade using the histogram shows some positive skewness in the gold grade data. The Au grade is positively skewed as shown in Figure 11. The standard deviations, variance for the Au grade and mean grade include 0.247889 g/m3. The minimum and maximum grades obtained values were 0.0422 g/m3 and 1.1948 g/m3 as indicated in Table 3 and Figure 12. Gravel section (ore zone) shows some skewness and various outliers as shown in the graphical histogram. The arithmetic mean of the gravel thickness within the area is 2.5 m.

Figure 11: The histogram Plot of the Gold Grade with a Positively Skewed
Data. Note: ( ) Grain size percentage.
| Gold Size | No of Grains | % of Grains |
|---|---|---|
| M | 20 | 3.241491086 |
| F | 82 | 13.29011345 |
| V.F | 515 | 83.46839546 |
| Total | 617 | 100 |
Table 3: Reveals the Percentages of the Grain Sizes of Placer Gold West Sanoukou.

Figure 12: Diagram of Statistics Analysis of Placer gold, West Sanoukou.
Note: ( ) Frequency, (
 ) Cumulative frequency.
Shape and texture of gold grain
The variable of gold grain shape and surface texture from irregular flat and moderately worked to sub rounded that represent increase distance of transport, and so most of the gold grains shape and surface texture indicate nearness of bed rock source (Figures 13A-13D).

Figure 13: A: Irregular flat and moderately worked gold grain, B: subrounded gold grain with slightly modified morphology C: folded rod and wire D: gold grain shape and surface texture should indicate nearness of bed rock source.
Resource estimation
All log transformed data were back transformed for the purpose of resource estimation. The results of the gold resource are shown in the equation below. The gravel thickness and Au grade (Table 4) used for the calculation were derived from the IDW using the surfer software with the power of 2 as indicated in Table 5. The area was calculated from the polygon around the pit holes in Figures 14 and 15 using the MapInfo software. The area covered is 600 × 300 m (0.377 km2) as studied area, but the total area is 23.5 km2 (Figure 16).
| Hole ID | Depth/m | Lithology | Au Weight/g | Au Size | |
|---|---|---|---|---|---|
| From | To | ||||
| SNK-P86-1 | 0 | 1 | Lateritic soil | 0.002 | 3 F+ 2 V. F |
| SNK-P86-2 | 1 | 2 | Lateritic soil | 0.0005 | 5 V. F |
| SNK-P86-3 | 2 | 3 | Saprolite | 0.0005 | 3 V. F |
| SNK-P86-4 | 3 | 4 | Saprolite | 0.0004 | 1 V. F |
| SNK-P86-5 | 4 | 5 | Bedrock | 0.0002 | 2 V. F |
| SNK-P87-1 | 0 | 1 | Lateritic soil | 0.0009 | 7 V. F |
| SNK-P87-2 | 1 | 2 | Lateritic soil | 0.0005 | 8 V. F |
| SNK-P87-3 | 2 | 3.4 | Lateritic soil | 0 | 1 V. F |
| SNK-P87-4 | 3.4 | 4 | Bedrock | 0.0001 | 2 V. F |
| SNK-P87-5 | 5 | 6 | Bedrock | 0.0001 | 3 V. F |
| SNK-P88-1 | 0 | 1.5 | Silty gravels | 0 | 0 |
| SNK-P88-2 | 1.5 | 2.4 | Silty lateritic soil | 0 | 2 V. F |
| SNK-P88-3 | 2.4 | 4 | Saprolite | 0 | 0 |
| SNK-P89-1 | 0 | 1 | Laterite | 0 | 1 F+ 1 V. F |
| SNK-P89-2 | 1 | 2 | Laterite | 0 | 4 V. F |
| SNK-P89-3 | 2 | 3 | Laterite | 0 | 0 |
| SNK-P89-4 | 3.7 | 4.2 | Saprolite | 0 | 1 V. F |
| SNK-P90-1 | 0 | 1 | Laterite | 0 | 6 V. F |
| SNK-P90-2 | 1 | 2 | Laterite | 0 | 0 |
| SNK-P90-3 | 2.5 | 3.5 | Saprolite | 0 | 3 V. F |
| SNK-P91-1 | 0 | 0.8 | Silt | 0.0006 | 5 V. F |
| SNK-P91-2 | 0.8 | 2 | F. gravels | 0 | 3 V. F |
| SNK-P91-3 | 2 | 3.2 | F. gravels | 0 | 2 V. F |
| SNK-P91-4 | 3.2 | 4.1 | F. gravels | 0 | 0 |
| SNK-P91-5 | 4.1 | 4.7 | F. gravels | 0 | 0 |
| SNK-P91-6 | 4.7 | 5.2 | Saprolite | 0 | 4 V. F |
| SNK-P93-1 | 0 | 1.2 | silt | 0 | 5 V. F |
| SNK-P93-2 | 1.2 | 2 | laterite | 0 | 4 V. F |
| SNK-P93-3 | 2 | 2.5 | Laterite | 0 | 1 V. F |
| SNK-P93-4 | 2.5 | 3.5 | Laterite | 0 | 3 V. F |
| SNK-P93-5 | 3.5 | 4 | Laterite | 0 | 1 V. F |
| SNK-P94-1 | 0 | 1 | Silt | 0.0006 | 2 F+ 5 V. F |
| SNK-P94-2 | 1 | 2 | Silty gravels | 0 | 1 F |
| SNK-P94-3 | 2 | 3 | Lateritic soil with gravels | 0.0001 | 1 F+ 3 V. F |
| SNK-P94-4 | 3 | 4 | Lateritic soil with gravels | 0 | 1 F+ 3 V. F |
| SNK-P94-5 | 4 | 5 | Lateritic soil with gravels | 0 | 3 V. F |
| SNK-P94-6 | 6.5 | 7 | F. gravels | 0.0009 | 4 F+ UC V. F |
| SNK-P97-1 | 0 | 1 | Silty gravels | 0.0005 | 3 F+ 2 V. F |
| SNK-P97-2 | 1 | 2 | Silty gravels | 0.0029 | 1 M+ 5 V. F |
| SNK-P97-3 | 2 | 3 | Lateritic soil with gravels | 0.0001 | 2 V. F |
| SNK-P97-4 | 3 | 4 | Lateritic soil with gravels | 0.0001 | 3 V. F |
| SNK-P97-5 | 3.7 | 4.5 | Lateritic soil with gravels | 0.0004 | 12 V. F |
| SNK-P97-6 | 4.5 | 6 | Clayey gravels | 0.0068 | UC V. F |
| SNK-P97-7a | 6 | 7 | F. gravels | 0.008 | 2 F+ UC V. F |
| SNK-P97-7b | 6 | 7 | F. gravels | 0.0189 | UC V. F |
| SNK-P98-1 | 0 | 1 | silty gravels | 0.002 | 3 M+ 3 F |
| SNK-P98-2 | 0.2 | 2 | F. gravels | 0.0055 | 1 M+ 4 F+ UC V. F |
| SNK-P98-3 | 2 | 2.5 | Saprolite | 0.0189 | 4 M+ 10 F+ UC V. F |
| SNK-P98-4 | 2.5 | 4 | Saprolite | 0.0006 | 1 F+ 5 V. F |
| SNK-P99-1 | 0 | 1 | Laterite | 0.0001 | 10 V. F |
| SNK-P99-2 | 1 | 2 | Laterite | 0.0001 | 1 F+ 6 V. F |
| SNK-P99-3 | 2 | 2.6 | Laterite | 0.0001 | 1 F+ 2 V. F |
| SNK-P99-4 | 2.6 | 4.2 | Saprolite | 0.0001 | 2 F+3 V. F |
| SNK-P100-1 | 0 | 1 | Laterite | 0.0007 | 3 F+3 V. F |
| SNK-P100-2 | 1 | 2 | Laterite | 0 | 1 F+ 4 V. F |
| SNK-P100-3 | 2 | 2.6 | Laterite | 0.0007 | 1 M+1 V. F |
| SNK-P100-4 | 2.6 | 4.2 | Saprolite | 0.002 | 1 M+1 F+ 1 V. F |
| SNK-P101-1 | 0 | 1.2 | silt | 0 | 1 F+ 4 V. F |
| SNK-P101-2 | 1.2 | 2.8 | Pisolitic gravel | 0 | 2 V. F |
| SNK-P101-3 | 2.8 | 3.5 | F. gravels | 0 | 2 F+ 4 V. F |
| SNK-P101-4 | 3.5 | 4 | Saprolite | 0.001 | 1 F+ 7 V. F |
| SNK-P102-1 | 0 | 1 | Laterite | 0 | 2 F+ 2 V. F |
| SNK-P102-2 | 1 | 2 | Laterite | 0 | 4 V. F |
| SNK-P102-3 | 2 | 3 | Laterite | 0 | 3 V. F |
| SNK-P102-4 | 3 | 4 | Laterite | 0 | 1 F+ 3 V. F |
| SNK-P102-5 | 5.5 | 6.3 | Saprolite | 0 | 2 V. F |
| SNK-P103-1 | 0 | 1.5 | Laterite | 0.0122 | 1 M+3 F+ 5 V. F |
| SNK-P103-2 | 1.5 | 2.7 | Lateritic soil | 0 | 1 F+ 1 V. F |
| SNK-P103-3 | 2.7 | 3.5 | Lateritic soil | 0 | 5 V. F |
| SNK-P103-4 | 3.5 | 4.5 | Saprolite | 0.065 | 1 M+ 2 F+ 10 V. F |
| SNK-P104-1 | 0 | 1 | Laterite | 0 | 5 V. F |
| SNK-P104-2 | 1 | 2.5 | Laterite | 0 | 6 V. F |
| SNK-P104-3 | 2.5 | 3.6 | Argillite | 0.0001 | 4 V. F |
| SNK-P104-4 | 3.6 | 5 | Saprolite | 0 | 2 V. F |
| SNK-P105-1 | 0 | 0.8 | F. gravels | 0.001 | 2 F+ 15 V. F |
| SNK-P105-2 | 0.8 | 1.7 | Laterite | 0.0003 | 6 V. F |
| SNK-P105-3 | 1.7 | 4.2 | Laterite | 0 | 10 V. F |
| SNK-P105-4 | 4.2 | 5 | Argillite | 0 | 6 V. F |
| SNK-P105-5 | 5 | 6 | Saprolite | 0 | 1 F |
| H1-1 | 3 | 5.5 | F. gravels | 0.002 | 3 F+ 17 V. F |
| H1-BS | 3 | 5.5 | F. gravels | 0.0015 | 25 V. F |
| H2-BS | 2.2 | 6.1 | F. gravels | 0.0017 | 2 F + 11 V. F |
| H3-1 | 0 | 2 | silt | 0.0009 | 2 F+ 14 V. F |
| H3-2 | 2 | 4 | Argillite | 0 | 5 V. F |
| H3-3 | 4 | 5 | F. gravels | 0.0087 | 2 M+ 3 F+ 55 V. F |
| H3-4 | 0 | 0.3 | F. gravels | 0.0011 | 16 V. F |
| H4-1 | 0 | 0.8 | F. gravels | 0 | 5 V. F |
| H4-2 | 0.8 | 2 | Argillite | 0 | 1 F |
| H4-3 | 5.3 | 8.8 | Saprolite | 0 | 8 V. F |
| H5-1 | 0 | 1 | F. gravels | 0 | 5 V. F |
| H5-2 | 1 | 2 | F. gravels | 0 | 1 V. F |
| H5-3 | 2 | 2.6 | Argillite | 0 | 0 |
| H5-4 | 2.6 | 4.3 | Argillite | 0.0065 | 1 M+ 13 V. F |
| H5-5 | 4.3 | 8 | F. gravels | 0.014 | 2 M+ 3 F+ 25 V. F |
| H6-1 | 0 | 1 | F. gravels | 0 | 4 V. F |
| H6-2 | 2.2 | 4.3 | Argillite | 0 | 6 V. F |
| H6-3 | 4.3 | 5 | F. gravels | 0 | 2 V. F |
| H6-4 | 5 | 6 | F. gravels | 0 | 8 V. F |
| H7-4 | 2.4 | 3.7 | silt | 0.0001 | P |
| H7-5 | 3.7 | 5 | F. gravels | 0.003 | 4 F+ 37 V. F |
| H8-BS | 3.3 | 4 | F. gravels | 0.1003 | 2 M+ 3 F+ UC V. F |
| H9-BS | 3.5 | 4 | F. gravels | 0.5974 | UC F+ V. F |
| H10-BS | 3.4 | 3.9 | F. gravels | 0.1131 | UC F+ V. F |
Table 4: Showing Depth, Lithology, Gold Weights, and Sizes of the Placer Gold at West-Sanoukou.
| Volume/m3 | Tones | Average Grade g/t | Gold Content |
|---|---|---|---|
| 448,672 | 717,875 | 0.1675 | 120,244.0625 |
Table 5: Showing Estimation of Resource in the Study Area.

Figure 14: Showing Solid Model of Placer.

Figure 15: Showing Constraints of Placer Gold.

Figure 16: Showing the Study Area within the West Sanoukou Gold
in Placer Block. Note: ( ) Placer estimate, (
 ) Sanoko west shakreen
P=GV, P is the resource potential, G is the mean grade of the gold grade model which is 0.1675 g/m3 and V is the volume of the deposit.
Volume of deposit=Area × mean gravel thickness
V=717875 t
P=717875 × 0.0.1675 g/t
P=120,244.0625 g
This estimated resource with value 120,244.0625 g of gold may contain some impurities, so it was converted based on the purity of gold reported by Chackrine Mining Company Ltd (CMCL) as well as that purity of gold reported from the study area. The purity from the area is noted (approximately) to be 92%. Using a purity value of 92%, the gold resource was estimated as indicated below;
At 92.0%, P=120,244.0625 g × 0.92
P=110,624.538 g
P=3,539.71439 oz.
In the study area for pitting the team have used two methods, in the first round used 1 m × 1 m dug pitting with the help of a typical hand dug tools consisting of axes, long sharp metal and spade were used for pitting up to 2 m depth. In the second time in the same area of study used excavator for pitting but this time dug up to the bedrock through ferricrete, silt-clay, gravelly bed and saprolite horizon to the bedrock. The pits in the second time were 3 m × 3 m the depth up to the bedrock. The hand dug pit used in this study is seen as the best method for sampling alluvial deposit and this can be used elsewhere especially where the depth of the deposit ranges to a maximum of 8 m. Beyond this depth, it is not preferable to use this method. The grid density 100 m × 100 m and 50 m × 50 m for the pitting has recorded the same standard error as indicated in the Figure 5 with other high dense grids (50 m × 50 m) and is term as optimum grid density for evaluating placer deposit. It is only preferable, may be under some consideration to reduce to much closer grid in upstream areas where the grade seem to be high. The various sections which span from the overburden, gravel section to the bedrock comprises of different geologic materials. The reddish brown (ferricrete) clay/silty component of the alluvial deposits may have been formed by the weathering of the rocks of the Kenieba belts rocks which comprises of metavolcanics, metasediments and quartz veins. This estimation has been solely based on the 50 m × 50 m and 100 m × 100 m pitting interval which is term as the optimal pitting interval for the Sanoukou placer gold deposit. The determination of the processing parameters from logging of the deposit is very important as they render processing difficulties. The clay materials associated with alluvial deposits is one of the minerals considered before setting up the wash plant. Too much clay slows the throughput rate and thus lower the amount of gold recovered in an hour per washing leading to reduction in general quarterly production rate.
The variable of gold grain shape and surface texture from irregular flat and moderately worked to sub rounded that represent increase distance of transport, and so most of the gold grains shape and surface texture indicate nearness of bed rock source.
The gold projects gold in placer, the results obtained so far are, encouraging.
The total area has been investigated and evaluated through pitting, sampling and panning and collection of the pan and weighted and calculated the tonnage as well as gold, meanwhile, study the size, shape and texture of the gold in the studied area as shown in the figures and tables in the report.
The west Sanoukou placer deposit evaluation has primarily been based on the logging parameters from the hand dug pits and excavation. The hand dug pit provided representative samples for the purpose of the resource evaluation and deriving key processing parameters like gold grain sizes, clayey content, gravel sizes and silica cemented medium up to 2 m depth and grid method 50 × 50 m. Also with the help of excavator the 100 m × 100 m and depth varies between 3.0 m up to 7.0 m in some places was used for the estimation of the resource which is seen as the optimal sampling density. In the overall evaluation process, it is established that the west Sanoukou deposit contains much clay materials within the gravel sections (ore zone) with gold grain sizes decreasing downstream. The total resource estimate for the study area include 448,672 m3 volumes, and 717,875 tons of gravels with average grade of 0.1675 g/t and total estimated gold of 120,244,0625 grams. According of the purity of gold from Sanoukou about 92%, the resource has been recalculated for the studied area is about 110,624.538 g and equal to 3,539.71439 oz.
The gold projects in Kenieba area south west of Mali. There are some recommendation for the study and the production in west Sanoukou area:
• Start exploitation now during the wet season.
• Start with areas abandoned by the Artisanal miners along the river sides.
• Start with pilot Plant and then develop the production by more than one unit.
• Mine the lower coarse gravel unit and test the upper horizon.
• Have more concentration studies for the gold placer along river sides target buried channels.
• It is recommended that additional studies be conducted within the area to provide a spatial model of the variation of the clay content within the mineralized zones as well as the spatial distribution of the gold grain sizes, as it provide the basis of building the alluvial wash plant.
• It was observed that some areas recorded much lower values of gold grade which affected the final estimated mean gold grade value.
• In future studies, such low grade areas must be block and resource estimate provided separately for such areas. This will provide a more detailed resource estimate of the area under study a midst high variation of gold grade within the area.
• According to the finding of the study we recommend a suitable productive plant suit the placer deposit and the grain size and shape of the gold in the studied area.
The authors are very keenly thank the joint venture Chackrine and Abu Rugia Development Co. Ltd. for giving all the requirements for the study of the gold in placer in west Sanoukou area, Kenieba district, Kaye Region, south west of Mali.
Citation: Siddig EM, Osama S, Abdelrhman EM, Osman MB, Mohamed T, Sadig F, et al. (2022) Evaluation of Placer Gold Deposit in Kenieba District, Kaye Region, Mali: A Case Study from West-Sanoukou Village. J Geol Geophys. 11:1046.
Received: 17-Oct-2022, Manuscript No. JGG-22-19895; Editor assigned: 19-Oct-2022, Pre QC No. JGG-22-19895 (PQ); Reviewed: 02-Nov-2022, QC No. JGG-22-19895; Revised: 09-Nov-2022, Manuscript No. JGG-22-19895 (R); Published: 17-Nov-2022 , DOI: 10.35248/2381-8719.22.11.1046
Copyright: © 2022 Siddig EM, et al. This is an open-access article distributed under the terms of the Creative Commons Attribution License, which permits unrestricted use, distribution, and reproduction in any medium, provided the original author and source are credited.