Journal of Stock & Forex Trading
Open Access
ISSN: 2168-9458
ISSN: 2168-9458
Research - (2022)Volume 9, Issue 3
With approximately 25 million readers a month, Benzinga has grown into one of the largest providers for actionable information on capital markets. This information can be utilized in practical trading in multiple ways. In this paper we: 1) Explore the effects of Benzinga-generated analyst rating and rating revisions, 2) Construct a trading indicator by combining information from Benzinga-provided prior and current ratings used in conjunction with prior and updated price targets, 3) Rank the individual performance of all Benzinga-covered research firms and individual analysts between 01/01/2021-12/31/2021, and 4) Compare the simulated trading results using various trading strategies based on the constructed indicators. We defined three indicators with differing enter criteria and measured the success of rates for overall research firms and individual analysts. After testing the efficacy of these three metrics, we find that several indicators could be used in trading. Furthermore, we test and find that there is extra information conferred in the distance from the target from the current price, as well as whether the change in rating is “consensus” vs. “first mover”. Overall, Benzinga-provided ratings were found to be useful indicators in practical trading.
Trading; Fundamental analysis; Technical analysis
At the moment, 55% of Americans invest in the stock market in various ways. There are many resources available to these investors to research and evaluate their next investment. Numerous private analytical companies offer paid-for market signals based on technical analysis, fundamental analysis, and/or sentiment.
We seek to review applicable literature and evaluate the efficacy of using analyst recommendations as a trading signal for individual investors. In a recent paper the authors examined the performance of the Motley Fool’s Stock Advisor premium service [1]. It concluded that trading based on the Stock Advisor service outperforms both the general market and several groups of companies used as a benchmark during initial and extended periods of time. Another research study evaluated the performance of Jim Cramer’s, the host of CNBC’s Mad Money, security buy and sell recommendations [2]. The authors concluded that Cramer’s buy recommendations resulted in short term profit but had negative alpha over time. The recommendations by the Wall Street Journal were also found to have a statistically significant effect on stock prices [3]. Focused on whether investors could profit from security analysts’ recommendations, using data from 1985 to 1996 researchers noted that recommended securities earned an 18.8% return compared to a 5.78% average market appreciation for securities which were not recommended [4]. However, other papers show evidence that analysts can also systematically underperform. A paper which evaluated sell-side analysts’ stock recommendations during the years 2000 and 2001, found that favored stocks were outperformed by the least favored stocks [5]. The securities recommended underperformed the market by 7.06%. When looking at data between the years of 1996 and 2003, the paper noted that buy recommendations from independent research firms outperformed those from investment banks [6]. It has also been stated that financial analysts’ downward stock recommendation revisions provide superior information to investors than do upward stock recommendation revisions [7].
Another important aspect to focus on is the bias and influence of the individual analyst and not just the company on which they are reporting. One paper found that analysts can credibly convey unfavorable information but can never credibly convey favorable information [8]. Similarly, another paper, found that analysts greatly prefer to move from a buy recommendation to a hold recommendation rather than immediately moving to a sell recommendation [9]. It is also found that the market typically heeds downgrade decisions made by analysts with a higher percentage of buy ratings.
Many different investment recommendation websites and analysts provide a multitude of different indicators for each recommendation. However, these indicators are often hard to understand, and it is even harder to know which indicators to act upon. Researchers found that a singular change in price target (increasing or decreasing), or a singular change in rating (e.g., neutral → buy), is not strong enough to indicate a buy from an investor [10]. Contradictory signals neutralize each other, and confirmatory signals reinforce each other. The researchers also showed that large decreases in price target can be explained by the stock price increasing. However, large price target increases are not based on the stock price increasing. One of the largest stock market relevant resources is Benzinga. Benzinga.com was founded in 2010, and has around 25 million readers per month, as officially published by the company. It provides stock ratings/ rating revisions, multiple charting tools, earnings information, news stories and other information relevant to the market.
In this paper we will focus on evaluating Benzinga Ratings provided through the Benzinga API. The Benzinga Ratings feature provides research analyst stock ratings from established firms, e.g., Morgan Stanley or Goldman Sachs.
Hypothesis
In this paper we measure the success of Benzinga-provided analyst ratings in conjunction with several take-profit/stop-loss pairs of values.
We hypothesize those analysts provided ratings and price targets may contain useful information about future price movements. This effect is well-known and confirmed by our own monitoring of the stock price movements in the period 2020-2021, following recommendations issued by two Motley Fool’s services, Stock advisor and Rule breakers (Figure 1).

Figure 1: Analyst rating vs. Price movement–The immediate effects of Motley Fool's Stock Advisor and Rule Breakers services issued stock recommendations on stock price movements. The plot shows the stock price in USD around and at the exact time when the recommendations were issued (19:00:00 for ZBRA (Stock advisor) and 17:00:00 for CHGG (Rule breakers), in the Central European time zone, on 11/19/20 and 11/25/20, respectively).
In reality, the impact could be mutual, as renowned analysts could impact the behavior of retail investors, causing swings in the stock price. Vice versa, the future price change either affirms or negates the findings by the analyst, improving or diminishing the analyst’s own prestige and future potential to impact the market. For this analysis, it is not important whether the price changes happen because the analyst caused them, or whether the analyst properly predicted price changes that would have happened anyway. We limit our analysis to the performance of the publicly issued ratings and price target changes.
We define success through several indicators, using both expert understanding and various data driven approaches. We anticipate that appropriate indicators will be able to uncover the meaningful ratings changes, those that, in aggregate, have high success rates and where the value of their predictions are significantly higher than a random walk. This leads to our main goal of identifying specific strategies individuals may want to employ in their trading, as well as which analysts and research houses that they may want to follow closely due to their outperformance.
The data for our research is retrieved using the Benzinga API and the Alpaca trading API. From the Benzinga API we used the financial_data library to get Benzinga analyst ratings. We collected the ratings for a year’s time, 01/01/2021-12/31/2021. During this period, Benzinga provided 34,049 Analyst ratings and rating revisions from 169 different research houses covering 4,636 different stocks. The two main components of the ratings we will focus on is the rating label and the associated price target. The rating label is a key word with which analysts will classify their report. For example, a rating could be classified as “Buy” or “Outperform”, meaning the analyst suggests a buy, or a rating could be classified as “Sell” or “Underperform”, meaning the analyst suggests selling the security. The price target indicates the price the analyst believes the security will rise or fall too. We used the Alpaca trading API to get the price of the equities being rated by the Benzinga analysts. Security price data was aligned with the time the rating was published or the time closest to the ratings publishing during open market hours (excluding pre- and postmarket activity). We also retrieved security price low and high data from 3 trading days before the rating was published until 179 days after the rating was published.
Note, the analyst price targets provided by Benzinga are not adjusted for stock splits. However, the analysis has included the appropriate adjustments, checking for equities which had splits in the year 2021 and appropriately adjusts the target price if the split date occurred during the expected trading timeline.
We focused our research on three main indicators using the above data:
(I1) Rating pairs
We define a rating pair as the grouping of the second most recent rating of a security and the most recent rating of on security given by the same analyst. Based on expert understanding and common sense, we postulated a set of 39 ratings pairs which indicate that the security should be bought, and a set of 50 ratings pairs which indicate that the security should be sold.
We postulated that the main ratings that signified a buy were in (Table 1).
| Buy | Strong buy | Sector overweight |
|---|---|---|
| Outperformer | Overweight | Sector outperform |
| Positive | Outperform | Market outperform |
Table 1: The main ratings that signified a buy.
The main ratings that signified a sell were postulated to be (Table 2).
| Market underperform | Sector underperform | Strong sell |
|---|---|---|
| Underweight | Underperform | Reduce |
Table 2: The main ratings that signified a sell were postulated.
A transition from any type of rating (buy, sell, neutral) to a buy rating would signify a buy rating pair, and a transition to a sell rating would signify a sell rating pair:
Buy rating: Buy ≥ strong buy Sell rating: Neutral ≥ sell
All ratings pairs postulated to signify buy or sell actions are provided in the appendix.
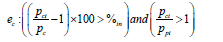
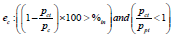
(I2) Market value vs. target value
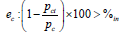
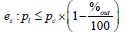
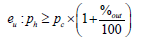
After determining the buy and sell rating pairs we can check the success of analyst ratings using an enter and exit percentage. The enter percentage is defined as the ratio of the target price of the rating compared to the market value of the security at the time when rating was issued. For example, if the new target price was higher than the market price by a given threshold, such a rating constituted a valid buy signal, and equivalent for sell signals. Once the decision to enter has been made we then track how many days the security should be held using daily low and high prices for all subsequent days from the time when the order was placed. If the High daily stock price exceeded the entry price by a given profit threshold, we closed the simulated trade and recorded the number of days the trade lasted. Similarly, if the trade was losing (based on daily low or high) we closed the trade after the loss exceeded the predefined threshold. In this study, we kept profit and stop loss identical for every trade (symmetric around the entry price). The minimum possible trade duration is 1 day and the maximum possible is 180 days. Meaning a trade entered on a specific day must wait until the following day to exit.
pc : Price at the time the rating is published
pct : Target price of the current rating
ph : High price of day being evaluated for exit
pl : Low price of day being evaluated for exit
%in : Enter Percentage
%out : Exit Percentage
ec : Enter Criteria
es : Successful Exit
eu : Unsuccessful Exit
ei : Inconclusive Exit
If buy rating pair:

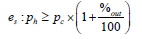
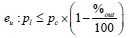
ei:es and eu …………… (1)
If sell rating pair:
ei:es and eu …………… (2)
(I3) Current target value vs. previous target value
We build from indicators (1) and (2) by adding a third criterion which compares the current target value with the previous target value. If the ratio of current target value by previous target value is greater than 1 we consider this an additional buy indicator, if the ratio is less than 1 we consider this an additional sell indicator. This addition to indicator (2) allows us to better evaluate cases where the previous and current ratings both signify a buy or a sell.
ppt : Target price of the previous rating
If buy rating pair:
If sell rating pair:
Since both indicators market value vs. target value and current target value vs. previous target value depend on indicator rating pairs, the rating pairs indicator was the most important to identify correctly.
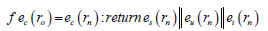
Additionally, we explored a combination of the above indicators, evaluating how one rating could affect another. If the same security had 2 or more ratings in a 3-day period, and both ratings passed the same enter criteria for the specific indicator used, we observed whether the newest rating was more or less likely to be successful (synergy and anti-synergy).
rn : Newest rating
r0 : Rating published for the same security within 3 days before
Synergy:
Anti-synergy:
To understand the performance of the indicator strategies against a passive strategy, we included a calculation of return above baseline, with the S and P 500 (SPX) acting as the benchmark. Due to the fact that retail investors very rarely have the ability to short stocks, we have prepared a practical simulation: in the case of a “buy”, the investor purchases the security recommended, and in the case of a sell rating, the investor will buy the S and P 500 (SPX) instead of the security.
Return is calculated as the percentage change in the security
b : Security “buy” rating return-SPX return
s : Percent SPX return-security “sell” rating return
Return above baseline:
Mean ([∀b, ∀s])
In total, 73.5 percent of the total ratings over the 1-year period were classified as either a buy or a sell action by our methodology. This forms Dataset1. We found Dataset1 had a much skewed distribution of buy and sell ratings, with the number of buy ratings exceeding the number of sell ratings by a factor of almost 7. 21,835 ratings pairs were classified as a buy action, while only 3,189 ratings pairs were classified as a sell action.
To begin our analysis, we evaluate the success rate of each of our indicator-strategy pairs across Dataset1. Here success is defined as the rating directive matching the real market outcome. I.e. the value of an asset increased following a rating of buy. I1 performed only slightly better than pure chance with a success rate ranging from 50.31% (Exit: 20) to 52.41% (Exit: 10) (Table 3). I2 performed similarly to I1, with a success rate of 47.72% (In: 20 Exit: 20) to 52.51% (In: 20 Exit: 5) (Table 4). I3, which accounts for changing target prices of ratings, performs best of the indicators with a success rate ranging from 52.55% (In: 15 Exit: 5) to 55.56% (In: 20 Exit: 15) (Table 5 and Figure 2).
| Strategy | Buy count | Buy success count | Sell count | Sell success count | Buy success rate | Sell success rate | Overall success rate |
|---|---|---|---|---|---|---|---|
| Exit: 5 | 21337 | 10964 | 2971 | 1626 | 51.38% | 54.73% | 51.79% |
| Exit: 10 | 20988 | 11059 | 2891 | 1457 | 52.69% | 50.40% | 52.41% |
| Exit: 15 | 18889 | 9806 | 2516 | 1245 | 51.91% | 49.48% | 51.63% |
| Exit: 20 | 16206 | 8155 | 2103 | 1056 | 50.32% | 50.21% | 50.31% |
Table 3: Indicator 1 performance.
| Strategy | Buy success count | Buy count | Sell success count | Sell count | Buy success rate | Sell success rate | Overall success rate |
|---|---|---|---|---|---|---|---|
| In: 5 Exit: 5 | 10356 | 20121 | 578 | 1049 | 51.47% | 55.10% | 51.65% |
| In: 5 Exit: 10 | 10416 | 19807 | 533 | 1043 | 52.59% | 51.10% | 52.51% |
| In: 5 Exit: 15 | 9186 | 17844 | 465 | 935 | 51.48% | 49.73% | 51.39% |
| In: 5 Exit: 20 | 7625 | 15309 | 420 | 799 | 49.81% | 52.57% | 49.94% |
| In: 10 Exit: 5 | 9384 | 18318 | 438 | 784 | 51.23% | 55.87% | 51.42% |
| In: 10 Exit: 10 | 9504 | 18108 | 412 | 793 | 52.49% | 51.95% | 52.46% |
| In: 10 Exit: 15 | 8449 | 16463 | 374 | 726 | 51.32% | 51.52% | 51.33% |
| In: 10 Exit: 20 | 7060 | 14255 | 340 | 634 | 49.53% | 53.63% | 49.70% |
| In: 15 Exit: 5 | 7481 | 14684 | 307 | 556 | 50.95% | 55.22% | 51.10% |
| In: 15 Exit: 10 | 7572 | 14608 | 296 | 567 | 51.83% | 52.20% | 51.85% |
| In: 15 Exit: 15 | 6875 | 13550 | 268 | 520 | 50.74% | 51.54% | 50.77% |
| In: 15 Exit: 20 | 5839 | 11989 | 255 | 474 | 48.70% | 53.80% | 48.90% |
| In: 20 Exit: 5 | 5640 | 11018 | 194 | 359 | 51.19% | 54.04% | 51.28% |
| In: 20 Exit: 10 | 5672 | 11035 | 195 | 371 | 51.40% | 52.56% | 51.44% |
| In: 20 Exit: 15 | 5186 | 10438 | 177 | 345 | 49.68% | 51.30% | 49.74% |
| In: 20 Exit: 20 | 4511 | 9487 | 166 | 314 | 47.55% | 52.87% | 47.72% |
Table 4: Indicator 2 performance.
| Strategy | Buy success count | Buy count | Sell success count | Sell count | Buy success rate | Sell success rate | Overall success rate |
|---|---|---|---|---|---|---|---|
| In: 5 Exit: 5 | 5836 | 11051 | 164 | 292 | 52.81% | 56.16% | 52.90% |
| In: 5 Exit: 10 | 5879 | 10783 | 140 | 287 | 54.52% | 48.78% | 54.37% |
| In: 5 Exit: 15 | 5090 | 9332 | 139 | 256 | 54.54% | 54.30% | 54.54% |
| In: 5 Exit: 20 | 4142 | 7605 | 125 | 219 | 54.46% | 57.08% | 54.54% |
| In: 10 Exit: 5 | 4999 | 9516 | 106 | 182 | 52.53% | 58.24% | 52.64% |
| In: 10 Exit: 10 | 5088 | 9324 | 92 | 183 | 54.57% | 50.27% | 54.49% |
| In: 10 Exit: 15 | 4456 | 8151 | 96 | 169 | 54.67% | 56.80% | 54.71% |
| In: 10 Exit: 20 | 3661 | 6707 | 88 | 151 | 54.58% | 58.28% | 54.67% |
| In: 15 Exit: 5 | 3531 | 6725 | 59 | 106 | 52.51% | 55.66% | 52.55% |
| In: 15 Exit: 10 | 3611 | 6649 | 51 | 107 | 54.31% | 47.66% | 54.20% |
| In: 15 Exit: 15 | 3275 | 5939 | 55 | 99 | 55.14% | 55.56% | 55.15% |
| In: 15 Exit: 20 | 2750 | 5015 | 54 | 96 | 54.84% | 56.25% | 54.86% |
| In: 20 Exit: 5 | 2339 | 4310 | 38 | 65 | 54.27% | 58.46% | 54.33% |
| In: 20 Exit: 10 | 2387 | 4297 | 32 | 65 | 55.55% | 49.23% | 55.46% |
| In: 20 Exit: 15 | 2188 | 3942 | 37 | 63 | 55.50% | 58.73% | 55.56% |
| In: 20 Exit: 20 | 1896 | 3446 | 33 | 60 | 55.02% | 55.00% | 55.02% |
Table 5: Indicator 3 performance.

Figure 2: Indicator 3 success rates split into buy vs. sell trades–It can be seen that almost all measures have a success rate greater than 50%.
On average, Indicator 3 shows the most consistent performance, with all overall success rates well above 50%. Requiring a threshold of 20 to enter but exiting after the stock has moved 15% has the highest success rate, at 55.56%. Not only that, if you assume a baseline 50/50 success rate in a binomial distribution, all thresholds of I3 are statistically significant at a p-value<0.01.
Given that analyst ratings have been shown to contain signal, we investigate indicator performance for specific research houses to see if there are some firms that investors may want to pay more (or less) attention to. The following analysis focuses on the top 15 firms by ratings volume, irrespective of whether their issued ratings resulted in trades. These 15 firms represent 60% of all ratings issued over the course of 2021 (Table 6).
| Analyst | Ratings issued |
|---|---|
| Morgan stanley | 4473 |
| Raymond james | 1912 |
| Credit suisse | 1689 |
| Barclays | 1458 |
| Wells fargo | 1405 |
| Keybanc | 1302 |
| Rbc capital | 1185 |
| Jp morgan | 982 |
| Goldman sachs | 959 |
| Needham | 906 |
| Deutsche bank | 889 |
| Citigroup | 881 |
| Hc wainwright & co. | 832 |
| Piper sandler | 800 |
| B of A Securities | 755 |
Table 6: Dataset 2.
For all the top 15 analyst firms, I3 performs the best overall. Success rates range from 50% (HC Wainwright and Co.) to 70.15% (Keybanc) (Table 7). Breaking down performance on buy vs. sell ratings reveals that I3 is the best performer for buy ratings across the top 15 firms (Table 8) but the best performer for sell ratings varies (Table 9). This variation may suggest that different indicators are stronger predictors for some analyst firms but, given the small size of the sell ratings set, we advise caution in attributing undue significance to this result.
| Analyst | Buy count | Buy success count | Sell count | Sell success count | Overall success rate | Indicators | Best strategy |
|---|---|---|---|---|---|---|---|
| Morgan stanley | 391 | 258 | 7 | 5 | 66.08% | I3 | In: 20 Exit: 15 |
| Raymond james | 677 | 421 | 0 | 0 | 62.19% | I3 | In: 5 Exit: 20 |
| Credit suisse | 232 | 152 | 5 | 1 | 64.56% | I3 | In: 20 Exit: 10 |
| Barclays | 180 | 107 | 5 | 2 | 58.92% | I3 | In: 20 Exit: 5 |
| Wells fargo | 112 | 78 | 3 | 2 | 69.57% | I3 | In: 20 Exit: 20 |
| Keybanc | 134 | 94 | 0 | 0 | 70.15% | I3 | In: 20 Exit: 20 |
| Rbc capital | 115 | 67 | 2 | 1 | 58.12% | I3 | In: 20 Exit: 15 |
| Jp morgan | 488 | 271 | 257 | 155 | 57.18% | I1 | Exit: 5 |
| Goldman sachs | 68 | 37 | 8 | 6 | 56.58% | I3 | In: 20 Exit: 5 |
| Needham | 460 | 232 | 0 | 0 | 50.43% | I3 | In: 5 Exit: 10 |
| Deutsche bank | 472 | 253 | 11 | 4 | 53.21% | I1 | Exit: 10 |
| Citigroup | 114 | 79 | 4 | 1 | 67.80% | I3 | In: 20 Exit: 10 |
| Hc wainwright & co. | 306 | 153 | 0 | 0 | 50.00% | I3 | In: 15 Exit: 5 |
| Piper sandler | 88 | 56 | 1 | 1 | 64.04% | I3 | In: 20 Exit: 15 |
| B of A Securities | 52 | 32 | 3 | 2 | 61.82% | I3 | In: 20 Exit: 10 |
Table 7: Top 15 analyst best overall performance.
| Analyst | Buy count | Buy success count | Buy success percentage | Overall success rate | Indicators | Strategy |
|---|---|---|---|---|---|---|
| Morgan stanley | 391 | 258 | 65.98% | 66.08% | I3 | In: 20 Exit: 15 |
| Raymond james | 677 | 421 | 62.19% | 62.19% | I3 | In: 5 Exit: 20 |
| Credit suisse | 232 | 152 | 65.52% | 64.56% | I3 | In: 20 Exit: 10 |
| Barclays | 180 | 107 | 59.44% | 58.92% | I3 | In: 20 Exit: 5 |
| Wells fargo | 112 | 78 | 69.64% | 69.57% | I3 | In: 20 Exit: 20 |
| Keybanc | 134 | 94 | 70.15% | 70.15% | I3 | In: 20 Exit: 20 |
| Rbc capital | 115 | 67 | 58.26% | 58.12% | I3 | In: 20 Exit: 15 |
| Jp morgan | 195 | 111 | 56.92% | 55.92% | I3 | In: 5 Exit: 10 |
| Goldman sachs | 68 | 37 | 54.41% | 56.58% | I3 | In: 20 Exit: 5 |
| Needham | 460 | 232 | 50.43% | 50.43% | I3 | In: 5 Exit: 10 |
| Deutsche bank | 472 | 253 | 53.60% | 53.21% | I1 | Exit: 10 |
| Citigroup | 114 | 79 | 69.30% | 67.80% | I3 | In: 20 Exit: 10 |
| Hc wainwright & co. | 306 | 153 | 50.00% | 50.00% | I3 | In: 15 Exit: 5 |
| Piper sandler | 88 | 56 | 63.64% | 64.04% | I3 | In: 20 Exit: 15 |
| B of A Securities | 52 | 32 | 61.54% | 61.82% | I3 | In: 20 Exit: 10 |
Table 8: Top 15 analyst best buy performance.
| Analyst | Sell count | Sell success count | Sell success percentage | Overall success rate | Indicators | Strategy |
|---|---|---|---|---|---|---|
| Morgan stanley | 8 | 6 | 75.00% | 60.17% | I3 | In: 20 Exit: 5 |
| Raymond james | 110 | 52 | 47.27% | 54.56% | I1 | Exit: 10 |
| Credit suisse | 6 | 4 | 66.67% | 58.92% | I3 | In: 10 Exit: 20 |
| Barclays | 24 | 18 | 75.00% | 48.45% | I2 | In: 20 Exit: 15 |
| Wells fargo | 10 | 7 | 70.00% | 59.71% | I3 | In: 10 Exit: 15 |
| Keybanc | 1 | 1 | 100.00% | 55.05% | I3 | In: 15 Exit: 10 |
| Rbc capital | 7 | 6 | 85.71% | 50.66% | I2 | In: 20 Exit: 10 |
| Jp morgan | 6 | 4 | 66.67% | 50.00% | I3 | In: 20 Exit: 10 |
| Goldman sachs | 21 | 17 | 80.95% | 47.47% | I2 | In: 20 Exit: 20 |
| Needham | 2 | 2 | 100.00% | 45.10% | I1 | Exit: 10 |
| Deutsche bank | 3 | 3 | 100.00% | 50.26% | I2 | In: 20 Exit: 10 |
| Citigroup | 11 | 8 | 72.73% | 50.68% | I2 | In: 20 Exit: 5 |
| Hc wainwright & co. | 1 | 1 | 100.00% | 43.32% | I2 | In: 10 Exit: 10 |
| Piper sandler | 1 | 1 | 100.00% | 51.20% | I3 | In: 15 Exit: 10 |
| B of A Securities | 10 | 8 | 80.00% | 54.22% | I2 | In: 20 Exit: 5 |
Table 9: Top 15 analyst best sell performance.
Looking at the overall and firm-specific ratings results, I2 has significantly worse performance than I1 and I3. Given this, the remaining analysis will focus on I1 and I3 while exploring other dimensions of the data.
Firstly, we will investigate how individual analysts perform. We have focused only on analysts from these top 15 firms, and those whose ratings yielded at least 20 indicator 3 trades over the course of the year.
We can see that, even at these large and overall successful firms, there is a large dispersion in success (Table 10). This indicates that, while in aggregate analyst’s ratings contain meaningful data that can be constructed into a trading signal, more work needs to be done to understand individual analyst performance.
| Analyst name | Analyst | I3 Strategy | I3 overall success rate | I3 ratings count | I1 strategy | I1 overall success rate | I1 ratings count |
|---|---|---|---|---|---|---|---|
| David long | Raymond james | In: 15 Exit: 20 | 88.46% | 26 | Exit: 20 | 84.44% | 45 |
| Devin mcdermott | Morgan stanley | In: 15 Exit: 20 | 83.33% | 24 | Exit: 20 | 66.67% | 54 |
| John walsh | Credit suisse | In: 10 Exit: 15 | 79.17% | 24 | Exit: 20 | 67.57% | 37 |
| John freeman | Raymond james | In: 15 Exit: 20 | 75.00% | 52 | Exit: 20 | 70.00% | 70 |
| Rajvindra gill | Needham | In: 20 Exit: 20 | 72.41% | 29 | Exit: 15 | 63.64% | 55 |
| Stephen byrd | Morgan stanley | In: 10 Exit: 5 | 71.43% | 28 | Exit: 5 | 63.16% | 76 |
| Sami badri | Credit suisse | In: 10 Exit: 5 | 68.18% | 22 | Exit: 15 | 65.00% | 40 |
| Andrew fein | Hc wainwright & co. | In: 10 Exit: 5 | 62.50% | 24 | Exit: 5 | 57.14% | 42 |
| Michael sison | Wells fargo | In: 15 Exit: 10 | 62.50% | 24 | Exit: 10 | 56.52% | 46 |
| Alex henderson | Needham | In: 15 Exit: 10 | 61.54% | 39 | Exit: 5 | 53.33% | 60 |
| Stephen ju | Credit suisse | In: 20 Exit: 10 | 60.71% | 28 | Exit: 10 | 56.52% | 92 |
| Adam tindle | Raymond james | In: 5 Exit: 20 | 60.00% | 25 | Exit: 20 | 58.62% | 29 |
| Ravi shanker | Morgan stanley | In: 5 Exit: 5 | 59.26% | 27 | Exit: 5 | 48.53% | 68 |
| Heiko ihle | Hc wainwright & co. | In: 10 Exit: 10 | 57.14% | 35 | Exit: 10 | 48.65% | 74 |
| Matthew hedberg | Rbc capital | In: 10 Exit: 5 | 55.56% | 45 | Exit: 5 | 56.52% | 69 |
| Raghuram selvaraju | Hc wainwright & co. | In: 15 Exit: 5 | 52.00% | 25 | Exit: 5 | 43.53% | 85 |
| Scott berg | Needham | In: 10 Exit: 10 | 48.15% | 27 | Exit: 5 | 48.89% | 45 |
| Ryan macdonald | Needham | In: 5 Exit: 5 | 45.45% | 22 | Exit: 5 | 41.67% | 48 |
| Michael turrin | Wells fargo | In: 5 Exit: 10 | 41.67% | 24 | Exit: 5 | 42.50% | 40 |
| Jack andrews | Needham | In: 5 Exit: 10 | 41.03% | 39 | Exit: 5 | 44.07% | 59 |
Table 10: Individual analyst best overall performance for indicators 1 and 3.
We note that there are several paid services that score analyst efficacy and offer alerts when analysts change their ratings. Our results are consistent with the idea that some analysts are better than others, and that these services could provide value to end investors. Future versions of this paper may explore analyst-level indicators or other approaches to understanding which analysts may be worth following (e.g. is performance correlated from one year to the next).
An interesting phenomenon that became apparent during analysis was that of ratings clusters, one analyst will issue a rating and then several others will also issue in quick succession. This phenomenon is more pronounced on buys than sells, but happens on both ratings types.
Studying this further, we wanted to explore whether analyst “consensus” (having a confirmatory rating from a second analyst) conferred any benefits to a trading strategy. We define synergy as when entry criteria are hit but has followed another similar recommendation (within 3 days), and anti-synergy as a trade meeting entry criterion with no similar recommendation in the prior 3 days.
Examining the data, it is clear that investors should pay attention to analysts that are either “first movers” or independent thinkers (those that change ratings without other analysts doing the same), as the anti-synergy model outperforms the synergy model in both I1 and I3 and under all entry and exit criteria (Tables 11 and 12). The data suggests that analysts who change their targets independently are more successful than those who might be changing their recommendations because it’s the consensus thing to do.
| Strategy | General model overall success rate | Synergy model overall success rate | Anti-synergy model overall success rate |
|---|---|---|---|
| Exit: 5 | 51.79% | 50.90% | 54.23% |
| Exit: 10 | 52.41% | 51.58% | 54.68% |
| Exit: 15 | 51.63% | 50.31% | 55.20% |
| Exit: 20 | 50.31% | 48.86% | 54.17% |
Table 11: Indicator 1 synergy models best overall performance.
| Strategy | General model overall success rate | Synergy model overall success rate | Anti-synergy model overall success rate |
|---|---|---|---|
| In: 5 Exit: 5 | 52.90% | 51.74% | 55.34% |
| In: 5 Exit: 10 | 54.37% | 52.93% | 57.37% |
| In: 5 Exit: 15 | 54.54% | 52.45% | 58.71% |
| In: 5 Exit: 20 | 54.54% | 53.14% | 57.19% |
| In: 10 Exit: 5 | 52.64% | 51.38% | 54.82% |
| In: 10 Exit: 10 | 54.49% | 52.91% | 57.18% |
| In: 10 Exit: 15 | 54.71% | 52.55% | 58.29% |
| In: 10 Exit: 20 | 54.67% | 53.17% | 57.03% |
| In: 15 Exit: 5 | 52.55% | 50.96% | 54.40% |
| In: 15 Exit: 10 | 54.20% | 52.24% | 56.47% |
| In: 15 Exit: 15 | 55.15% | 52.76% | 57.82% |
| In: 15 Exit: 20 | 54.86% | 53.59% | 56.24% |
| In: 20 Exit: 5 | 54.33% | 52.69% | 55.54% |
| In: 20 Exit: 10 | 55.46% | 52.35% | 57.75% |
| In: 20 Exit: 15 | 55.56% | 52.49% | 57.78% |
| In: 20 Exit: 20 | 55.02% | 53.42% | 56.19% |
Table 12: Indicator 3 synergy models best overall performance.
As splitting the overall ratings set into synergy and anti-synergy reduces the opportunity set, we examine the proportion of trades that meet each criterion, taking I3 as an example (Figure 3).

Figure 3: Proportion of all I3 trades that are Anti-synergy–Interestingly, the proportion of “anti-synergy” analyst ratings increases with a threshold. This is consistent with our prior findings that a higher threshold/more extreme rating may confer further information not contained in the rating and indicator itself.
Having found an approach and indicators that show high hit rates, readers may be asking “does this outperform a passive strategy?” Due to the fact that retail investors very rarely have the ability to short stocks, we have prepared a practical simulation: In the case of a “buy”, the investor purchases the security recommended, and in the case of a sell rating, the investor will buy the S and P 500 (SPX) instead of the security. We measure the success rate and the profitability of the strategy by looking at the difference in returns between the purchased security, and the alternative (e.g., “buys” look at Security-SPX, “sells” look at SPX-security).
We find that an anti-synergy strategy implemented on either I1 or I3 outperforms the baseline strategy (Tables 13 and 14).
| Strategy | Anti-synergy model overall success rate | Anti-synergy returns above baseline |
|---|---|---|
| Exit: 5 | 54.23% | 0.26% |
| Exit: 10 | 54.68% | 0.42% |
| Exit: 15 | 55.20% | 0.58% |
| Exit: 20 | 54.17% | 0.40% |
Table 13: I1 anti-synergy performance above baseline.
| Strategy | Anti-synergy model overall success rate | Anti-synergy returns above baseline |
|---|---|---|
| In: 5 Exit: 5 | 55.34% | 0.12% |
| In: 5 Exit: 10 | 57.37% | 0.26% |
| In: 5 Exit: 15 | 58.71% | 0.59% |
| In: 5 Exit: 20 | 57.19% | 0.35% |
| In: 10 Exit: 5 | 54.82% | 0.06% |
| In: 10 Exit: 10 | 57.18% | 0.19% |
| In: 10 Exit: 15 | 58.29% | 0.40% |
| In: 10 Exit: 20 | 57.03% | 0.25% |
| In: 15 Exit: 5 | 54.40% | 0.06% |
| In: 15 Exit: 10 | 56.47% | 0.11% |
| In: 15 Exit: 15 | 57.82% | 0.38% |
| In: 15 Exit: 20 | 56.24% | 0.01% |
| In: 20 Exit: 5 | 55.54% | 0.22% |
| In: 20 Exit: 10 | 57.75% | 0.45% |
| In: 20 Exit: 15 | 57.78% | 0.57% |
| In: 20 Exit: 20 | 56.19% | 0.15% |
Table 14: I3 anti-synergy performance above baseline.
Throughout this paper we focused on analyst ratings published on Benzinga.com. We defined several different but interconnected indicators to filter out the best analyst ratings for various trading goals. We determined that many individual analysts and overall research firms with ratings on Benzinga that pass the enter criteria for each indicator have high success rates during the studied period of January 1, 2021, through December 31, 2021. This period saw a significant rise in security prices; as such, many of the ratings were buy recommendations. Indicator 1 focused solely on the rating pairs published by the analyst which classified a rating change as either a “buy” or a “sell”. Indicator 2 built off indicator 1 and incorporated the target price of the security in relation to the market value of the security at the time of the rating being published. Indicator 3 built off indicator 2 and added an additional entry criterion which was the target price of the new rating in relation to the previous rating for the security. When testing the indicators on different threshold levels (the amount the security was expected to increase or decrease), the findings showed that all 3 indicators were successful at a rate higher than 50% most of the time. Additionally, we found that the most reliable indicator was indicator 3 with a statistically significant average success rate of 54.37%. Indicator 3 performed best when the target price of the rating was at least 20% greater than the market value, and the trade executed when the price of the security rose to above 15% of the original market value, with a success rate of 55.56%. Overall, we found that ratings performed better when predicting a larger change in the security, 15% or more. When focusing on the top 15 firms with the highest volume ratings, we see that Keybanc reaches an overall success rate of 70.15% (94 successful ratings out of 134 ratings) with indicator 3 at an enter percentage of 20% and an exit percentage of 20%. When looking at individual analysts from these 15 firms who published enough ratings to execute at least 20 trades, we see that David Long from Raymond James reaches an overall success rate of 88.46% (23 successful ratings out of 26 ratings) with indicator 3 at an enter percentage of 15% and an exit percentage of 20%.
We defined a notion of anti-synergy (ratings which are the first or only rating for a specific security in a 3-day span) and synergy (a rating that follows another rating within a 3-day span). Testing these concepts using both indicator 1 and indicator 3, we find that anti-synergy not only had a higher hit rate than synergy trades, they also outperformed the market. This and the rest of our findings throughout the paper strongly suggests that a retail investor using Benzinga ratings can implement not only a winning strategy, but one that outperforms a passive approach.
While this paper focuses on identifying the different indicators success rates for the 2021 year and displaying that a viable general trading strategy can be formed from Benzinga ratings for the overall market, future iterations on this paper can investigate several dimensions currently unexplored. One of the most important aspects of this paper that will need to be tested over time is whether analysts who are successful in one year are typically successful in following. Another area of interest which is yet to be investigated is whether specific types of firms (e.g., dedicated research houses vs. investment banks, or privately held institutions vs. publicly traded ones) have more or less success with their predictions. There are also many ways that the indicators we have found can be finetuned and tested to give better performance rates against more specific entry conditions, rather than being run against the entire market. For example, future indicators could be based on exploration of if analysts are better at predicting specific sectors than others, or if analysts are better at predicting moves of larger vs. smaller companies when segmented by market-cap. Additionally, implementing asymmetric stop-losses vs. take-profit levels could significantly improve the performance of trading indicators.
Thank you Benzinga.com for providing the APIs needed to research and develop this paper.
Citation: Arun A, Tadić JM, Assaly R, Gore K (2022) Evaluating the Performance of Benzinga-Provided Stock Ratings as Trading Indicators. J Stock Forex. 09:212
Received: 11-Aug-2022, Manuscript No. JSFT-22-18549; Editor assigned: 15-Aug-2022, Pre QC No. JSFT-22-18549 (PQ); Reviewed: 29-Aug-2022, QC No. JSFT-22-18549; Revised: 05-Sep-2022, Manuscript No. JSFT-22-18549 (R); Published: 12-Sep-2022 , DOI: 10.35248/2168-9458.22.09.212
Copyright: © 2022 Arun A, et al. This is an open access article distributed under the terms of the Creative Commons Attribution License, which permits unrestricted use, distribution, and reproduction in any medium, provided the original author and source are credited.