Journal of Geology & Geophysics
Open Access
ISSN: 2381-8719
ISSN: 2381-8719
Research Article - (2016) Volume 5, Issue 2
The present attempt has been made to identify potential groundwater zones using electrical resistivity and lineament pattern in the dry watershed of Uppodai. The area comprises Archean hard rocks of charnockite and biotite gneiss. The major types of soil are red sandy soil and black cotton soils. Depth to the water table varies from 1 m to 10 m below the ground level. About 23 Vertical Electrical Soundings were carried out at different locations with AB/2 spreading up to 100 m by Schlumberger configuration. The measured apparent resistivity values were interpreted by curve matching technique using RESIST87 software. Lineament map was prepared to understand its influence on the ground water system. A, K,AK and KH are the curve types obtained in the study area. The resistivity values for first , second and third layers are varied from 3.6 Ωm to 256 Ωm; 65.7 Ωm to 2022.3 Ωm and 161.5 Ωm to 2500 Ωm respectively. The layer thickness of first and second layers observed with the variation of 0.7 m to 41.5 m and 8.3 m to 65.6 m. As the resistivity value observed with a wide variation, the resistivity value below100 Ωm of second layer has been conveniently taken for potential groundwater zones. The low resistivity with high second layer thickness zones is very limited and promising zones were observed at some patches in the present study area. Two sets of lineament pattern have identified with NW-SE and NE-SW directions. The density and length of lineaments were comparatively high with NW-SE pattern in the study area and not seems a potential aquifer at shallow depths.
Keywords: Uppodai, Vertical electrical sounding, Groundwater potential, Tambaraparani river
Our very own survival on earth depends on the basic resource of water, which is nature’s valuable gift to mankind. This nature’s gift is now becoming a crucial source in throughout the world. The total water resource of our world is estimated as 1.37 Million ha m, of these global water resources, about 97.2% are salt water, mainly in oceans and only 2.8% are available as fresh water at any time on the planet earth. However, the economically extracted groundwater with the present drilling technique is about 0.3% (41.1 ×10⁴ million ha m), remaining being unavailable as it is situated below depth of 800 m [1].
Groundwater condition in hard rock terrain is multivariate because of the heterogeneous nature of the aquifer due to varying composition, degree of weathering and density of fracturing. Now a day, the geophysical methods are widely used to determine the groundwater resources in any type of terrains. There are several geoelectrical sounding techniques for the groundwater investigations described in literature [2-5]. Geoelectric Resistivity method is one of the important methods used to investigate the nature of subsurface formations by studying the variations in their electrical properties. Generally, these methods have been used for the identification of geological contacts, tectonic and structural studies [6,7]. The conventional Schlumberger resistivity sounding is extensively used for routine groundwater investigations both in alluvial and hard rock terrain [8-10].
The objective of this method in the field of groundwater exploration is to locate groundwater bearing formations, to evaluate thickness and lateral extent of aquifers to find the depth to bedrock, etc. [11]. As groundwater is the largest available source of freshwater, it is necessity to identify the potential groundwater zone for continuous and sustainable development of both socio-economic and agricultural developments. Electrical resistivity survey provides much basic information to the hydrogeologist, like depth to water table, depth to the basement topography in hard rocks. Hence, the present attempt has been made to identify potential groundwater zones for development activities in the dry watershed Uppodai where agriculture is the main occupation.
Geology and hydrogeology
The present study area Uppodai is one of the tributaries to Chittar river basin. It is located between the North latitude of 8°52’ to 9°10’ and the east Longitude of 77°35’ to 77°55’ is shown in the Figure 1. Red sandy soil and black cotton soil are found in the area. The area lies in a hot and dry climatic zone with a temperature varying from 25°C to 45°C. It falls under the semi-arid climate type [12]. The elevation is approximately of about 50 m above mean sea level. The average precipitation of 722.5 mm is recorded in Kayathar station during the year 1901 to 2003. The actual annual evapotranspiration is found to be 636 mm. The well depth level varied from 7 m to 9.5 m. It is observed that the top soil thickness varied from 1 m to 3 m. As this study area is a hard rock terrain, the secondary porosity could be the main source for ground water storage. In this basin, water occurs mainly under water table conditions in the weathered crystalline complex terrains. The pattern of precipitation is essentially of a tropical monsoon type where the effect of the winter monsoon is dominant.
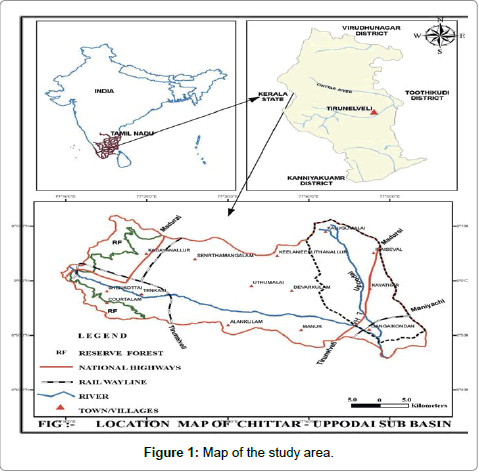
Figure 1: Map of the study area.
The area comprises Archean hard rocks of charnockite and biotite gneissic rock types (Figure 2). The charnockites are acidic to intermediate in nature and are white to grey colour. Similarly, the biotite gneiss rock type varies in colour from light grey to grey. The gneissic area has been subjected to polyphase of tectonic activities resulting in high degree of metamorphism and multi-generation of folding and associated shearing and faulting. The lineaments are predominantly oriented along the north-west to south east directions (Figure 3). The joints are oriented along NW-SE, N-S and NE-SW directions. The secondary structures developed in the lithounits of the district are described in detail by Abdullah and Paranthaman and Abdullah [13,14].
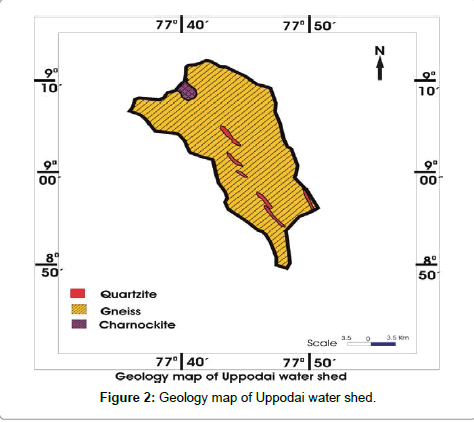
Figure 2: Geology map of Uppodai water shed.
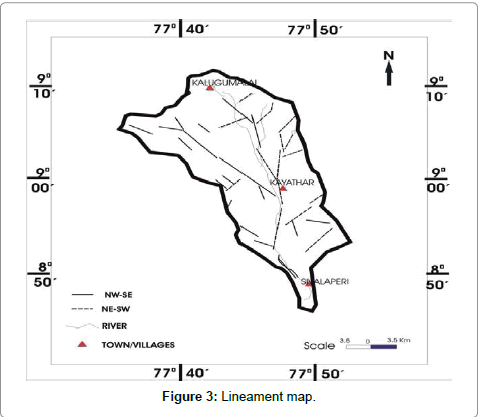
Figure 3: Lineament map.
The general geological succession of the region is presented given below (after Varadaraj) (Table 1) [15].
| Period | Lithogroup | Lithology |
| Quaternary | Recent | soils, alluvium, kankar, laterite |
| Western ghat super group | Acid intrusives | Pegmatites, Quartz vein, Pink granites, Grey granites, Leucogranites |
| A | ||
| R | ||
| C | Basic intrusives | Basic dykes, Basalt, Dolerites |
| H | ||
| A | Migmatic complex | Garnetiferousquartzofeldspathic |
| E | granulite gneisses | |
| A | ||
| N | ||
| Charnockite group | Charnockites, Pyroxene granulites | |
| Khondalite group | Crystalline limestone, Calcgranulites, Garnetiferousbiotite-sillimanitequartzites |
Table 1: The general geological succession of the region is presented given below.
Electrical resistivity method has gained considerable importance in the field of groundwater exploration because of its low cost, easy operation and efficiency to detect the water bearing formations. In the present study, about 23 Vertical Electrical Soundings (VES) have been carried out using a DDR-3 model resistivity meter in the study area (Figure 4). The Resistivity Meter is a specialized version of IGIS Resistivity meters designed for use in Resistivity surveys up to about 200 m depth. The equipment consists of two separate comportmentone for reading the current (G.Unit) and the other for directly reading the resistance/the potential (P-Unit), both housed in a single box. The equipment, powered by a 24V rechargeable battery can send highly stabilized currents up to 200 mA and read the resulting potential with a 100 micro volts resolution or ground resistance directly with 50 micro ohms resolution (www.igisindia.com) [16].
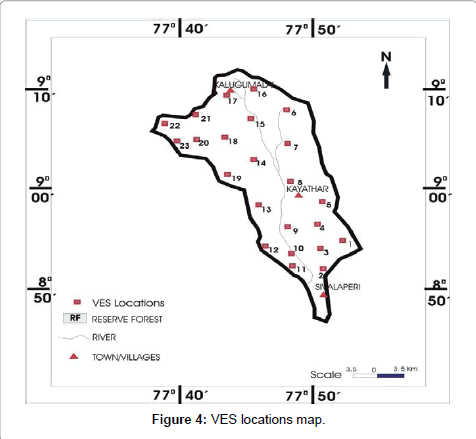
Figure 4: VES locations map.
The AB/2 separations have measured up to 100 m by Schlumberger configuration. The measured apparent resistivity signals have been interpreted through curve matching technique using RESIST87 software [17]. The software interpreted resistivity and respective layer thicknesses are converted into one, two and three layers for anlayses. The software technique has been successfully used for prospecting ground water by many researchers [8,18-21]. The resistivities of the rock types at different depth levels are used to understand the geoelectrical properties, because the behavior of conductivity mainly depends on the resistivity of lithology and age [3]. Apart from VES interpretation results, the lineament map also prepared to understand its influence on the ground water system. Because, lineaments are promising groundwater potential structures, and they act as the conduit of groundwater.
Electrical resistivity method is useful to investigate the nature of subsurface formations by studying the variations in their resistance to flow of electrical current and hence determine the occurrence of groundwater. As the present study area is a hard rock terrain, the response would have a high resistivity due to low flow of electrical current. The resistivity values obtained from the interpretation in the study area is given in the Table 2.
| VES location No | Curve Type |
Resistivity (Ωm) | Layer Thickness(m) | |||||
| 1 | 2 | 3 | 4 | 1 | 2 | 3 | ||
| 1 | A | 75.9 | 618.6 | 24.9 | ||||
| 2 | K | 56.2 | 297.9 | 161.5 | 5.5 | 22.8 | ||
| 3 | AK | 3.6 | 65.7 | 1051.0 | 247.0 | 2.6 | 23.5 | 29.0 |
| 4 | A | 33.0 | 127.4 | 288.9 | 4.4 | 45.0 | ||
| 5 | A | 72.8 | 309.0 | 8.3 | ||||
| 6 | A | 56.8 | 187.1 | 769.8 | 14.3 | 15.9 | ||
| 7 | K | 122.1 | 702.9 | 352.0 | 18.3 | 23.5 | ||
| 8 | K | 129.3 | 391.2 | 233.0 | 6.1 | 9.8 | ||
| 9 | K | 23.0 | 363.5 | 617.4 | 0.7 | 65.6 | ||
| 10 | KH | 25.1 | 469.0 | 142.0 | 446.1 | 1.2 | 27.8 | 12.5 |
| 11 | A | 92.5 | 515.8 | 1070.8 | 21.0 | 25.0 | ||
| 12 | AK | 72.8 | 268.0 | 1898.5 | 627.6 | 7.9 | 8.3 | 46.4 |
| 13 | K | 83.4 | 593.8 | 154.7 | 36.1 | 49.0 | ||
| 14 | A | 106.2 | 1163.8 | 41.5 | ||||
| 15 | A | 111.5 | 434.2 | 14.1 | ||||
| 16 | A | 31.6 | 223.4 | 752.0 | 19.0 | 26.3 | ||
| 17 | A | 23.0 | 112.1 | 265.5 | 17.9 | 28.9 | ||
| 18 | A | 71.0 | 592.3 | 1081.3 | 36.3 | 40.3 | ||
| 19 | A | 42.0 | 122.2 | 663.3 | 14.0 | 12.0 | ||
| 20 | A | 21.8 | 230.3 | 20.8 | ||||
| 21 | A | 256.0 | 1089.0 | 2500.0 | 10.0 | 30.0 | ||
| 22 | A | 51.8 | 640.2 | 890.3 | 6.4 | 54.1 | ||
| 23 | A | 89.7 | 2022.3 | 24.2 | ||||
Table 2: Interpreted Resistivity and Layer thickness.
In general, curve type A will encounter in hard rock terrains. Similarly, the present study interpretation results showed that about 15 VES curves were found with A curve type. The curve types of K, AK and KH were observed in 5,2 and 1 VES locations. Besides, out of of 23 VES interpretation, the three layer strata has been observed in 14 locatrons, 6 locations were shown 2 layer strata, and 3 locations were shown 4 layer strata. Some of the of the interpreted curve types of the study area are given in the Figure 5.
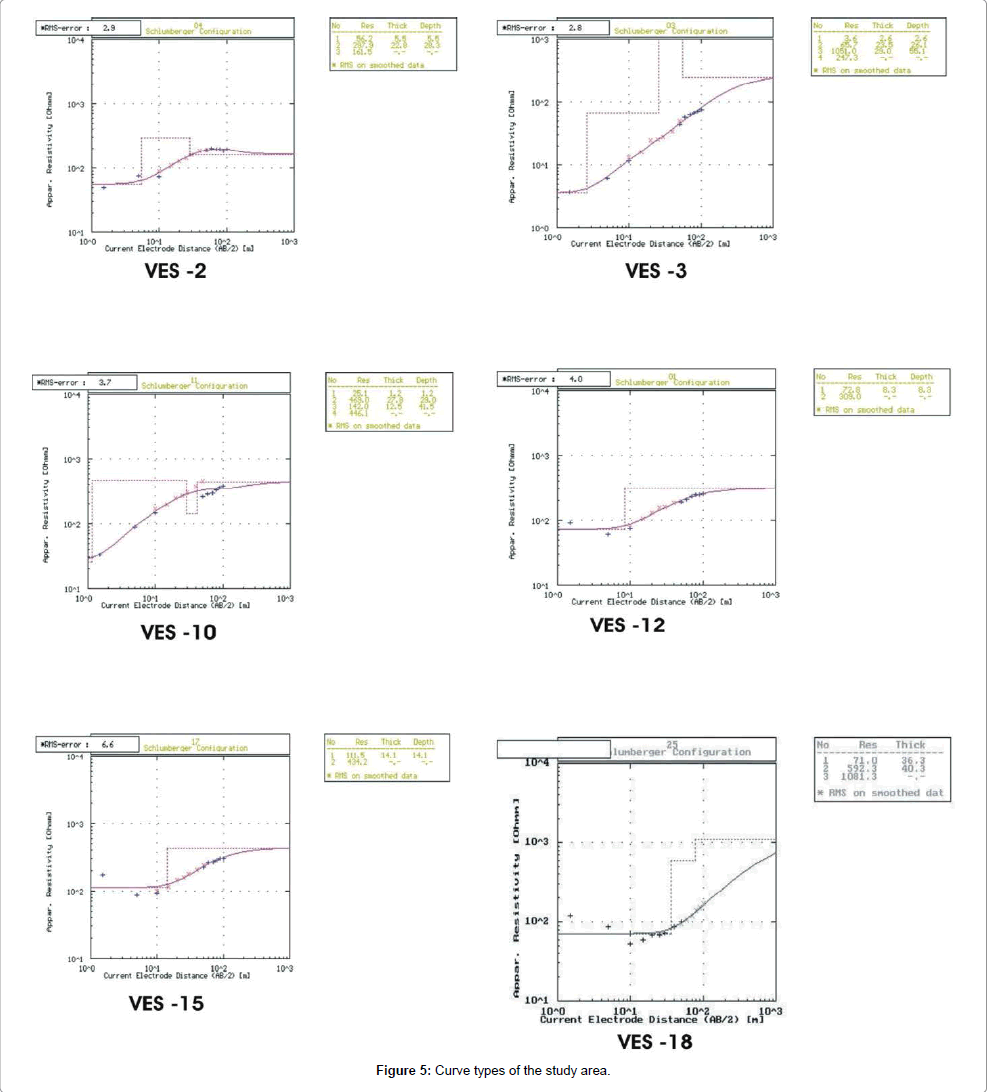
Figure 5: Curve types of the study area.
The resistivity values of first and second layers are varied from 3.6 Ωm to 256 Ωm and 65.7 Ωm to 2022.3 Ωm respectively. The respective layer thickness of first and second layer observed as 0.7 m to 41.5 m and 8.3 m to 65. 6 m. The average thickness of the first and second layers is 15.4 m and 22 m and high resistivity value observed in VES location 21 whereas low resistivity value observed in VES location 3. The second layer resistivity observed high in VES-23 and low in VES- 3. The third layer resistivity value varied from 161.5 Ωm to 2500 Ωm. High resistivity value noticed in VES-21 and low value observed in VES-2.
The high resistivity of 250 Ωm indicated in the top layer is attributed by dry soil and kankar deposit and low resistivity could be red or black soil with low moisture. In second layer, resistivity indicated up to 160 Ωm could be attributed by highly weathered gneiss and charnockite with saturation of water. The resistivity range 160 Ωm to 500 Ωm possibly indicated by poorly weathered gneiss and charnockite whereas high resistivity above 500 Ωm could be massive rocks. The low resistivity indicated in third layer attributed by fissured gneiss or semi weathered charnockite rock and high resistivity attributed by massive rocks. The interpreted resistivity layer is closely matched with the drilled hole lithology of the region. The lithology observed in bore hole (No.92442) to a depth of 43 m at Vellalankottai village of Kayathar block indicted that top soil thickness (0.5 m) followed by Kankar (0.5-6 m), Weathered Charnockite (6-8 m), Weathered and Jointed Charnockite (8-17 m) and Fissured Charnockite (17-43 m) [22].
The lineament pattern also plays an important role in groundwater potential and development. For good groundwater potential in hardrocks,the fracture systerm should be well connected. The secondary porosity in the form of fissures, fractures and joints in hard rocks provides higher permeability. Well connected fracture systems can be expected to form principal pathways for groundwater flow and mass transport. The study area has identified with two sets of lineament pattern in NW-SE and NE-SW directions. NW-SE pattern density and length of lineaments are observed comparatively high in the study area. NW-SE pattern of lineaments observed in western and southwestern part. In the eastern part of the study area observed with NE-SW pattern of lineament. The river also running on the lineament course of the study area.
In general, the first layer represents the top layer which is soil cover has shown a wide variation of geoelectrical response due to the soil condition and its nature. The subsequent second and third layers thickness and respective resistivity values are generally considered for locating groundwater potential zones. In general, the freshwater horizon encountered in hard rock terrain observed with a resistivity value range of 60 Ωm to 160 Ωm [23,24]. As the resistivity value obtained with a wide variation in the study area, it has been conveniently taken the resistivity value below100 Ωm of second layer. The low resistivity with high second layer thickness zones is very limited in the present study area. Such promising zones were observed at some patches whereas high resistivity was observed in remaining part of the study area. When compare with the lineament density, it is observed that the lineaments not seems a potential aquifer in shallow depths.
The geoelectrical resistivity survey is a good and effective method for groundwater development and management. It is observed that the overall groundwater potential is very limited in the study area. The average second layer thickness found high in south and northwestern part. The groundwater potential is low in the study area, but the lineaments are present widely with shallow in depth and not with groundwater movement. Even the VES locations on the and near the lineament structure shows high resistivity and high second layer thickness. Hence, the lineaments are not much influencing at shallow depth levels but would have a chance for deeper depth levels. In certain locations low resistivity value observed with high second layer thickness. This high weathered and jointed zone are favourable for groundwater development. Remaining part of the study area is feasible for shallow aquifer developments. The high resistivity value noticed in certain locations is mainly due to the presence of high resistive minerals such as biotite and hornblende in gneissic rocks. Besides, the increased number of open and bore wells, over exploitation and transporting water to the nearby irrigation lands by pipe also could lead to lower the water table and poor groundwater potential. This study not only helpful for groundwater development but also to monitor and conserve the resources.