Journal of Geology & Geophysics
Open Access
ISSN: 2381-8719
ISSN: 2381-8719
Research Article - (2016) Volume 5, Issue 1
Unconsolidated petroleum reservoirs are non-crystalline rock and include tight gas sands, heavy oil, and bitumen rich sands. These can be both near surface and at depth. This is a “methods” paper which discusses the use of thin section image analysis to obtain reservoir properties from unconsolidated sand reservoirs. A case study was carried out on samples from the Upper McMurray Member of the Athabasca Oil Sands in Canada. Using petrographic image analysis, porosity and permeability were obtained from thin sections from selected regions of interest (ROI). This was accomplished by generating 2D grain and void architecture models from binary images.Porosity and averaged particle size distribution for the coarse components or sand size components were derived directly from oil sand thin sections, whereas permeability was calculated. Values of porosity and permeability obtained using this method were found to be in typical value ranges of those obtained by conventional methods, including petrophysical and core analysis. The application of image analysis to sand reservoirs, such as oil sands, is a rapid and economical method of estimating reservoir properties, especially within regions of interest, and there is the added advantage of direct observation.
Keywords: Oil sands fabric, Oil sands petrology, Reservoir properties, Image analysis
Reservoirs that are non-crystalline rock are common worldwide and include tight gas sands, heavy oil, and bitumen rich sands. Historically, these unconsolidated reservoirs have been treated as rock reservoirs and are, therefore, greatly misunderstood. Determining reservoir properties, such as porosity and permeability, has been overreliant on well log-based methods and other macroscopic reservoir evaluation methods. These include modelling and numerical simulation from cores and core plugs which can be difficult in sand reservoirs. As these reservoirs are non-crystalline, the integrity of samples can be compromised during conventional analysis.
Quantitative oil sands fabric analysis employs image analysis which quickly provides direct measurements of reservoir properties for sand reservoirs. Through thin section images, reservoir porosity can be directly derived, especially within regions of interest (ROI). The recent advances in computer aided 2D image analysis, as applied to thin sections prepared from reservoir core samples, now provide the tools for rapid characterization and estimation of reservoir properties [1]. These properties include porosity, permeability, hydraulic conductivity and grain size distribution, amongst others. The method for using thin sections to determine reservoir properties in sand reservoirs, such as oil sands, is presented in the following section.
The study was based upon ten mammoth-sized petrographic thin sections of argillaceous sand and bioturbated samples from the Upper McMurray Hangingstone River outcrop in Alberta, Canada. The Hangingstone River outcrop is a well-documented estuarine environment [2] with bioturbation features reported by Pemberton et al. [3]. At the Hangingstone River outcrop, the Upper McMurray Member underlies the Wabiskaw Member. In general, the upper member of the McMurray Formation consists of horizontally bedded sands and muds; the sands are argillaceous and very fine grained, interpreted to be formed off bank or off channel from a brackish water setting [3].
The mammoth-sized petrographic thin sections were prepared according to Jongerius and Heintzberger [4] and Fitzpatrick [5], although procedures were modified in order to maintain sample integrity and minimize an alteration of the oil contained in the samples [6]. In a qualitative, or oil sand fabric descriptive analysis, reservoir constituents are grouped into coarse and fine components after setting a size limit, commonly of 20 μm, which is the upper limit for silt. Reservoir constituents are grouped into components based on a coarse to fine c/f ratio. Coarse components are sand size and above; fine components include silt and clay; bitumen is classified according to size and thus can be categorized either as a coarse or a fine component. Voids, which are spaces not occupied by solid material, are identified according to shape and size.
The qualitative descriptive study carried out prior to image analysis revealed that the coarse components in the argillaceous sands were predominately quartz grains which ranged between very fine and medium sand according to the Wentworth scale, while the fine component was speckled and dark to very dark brown in colour [7]. Voids in the argillaceous sands were macropore in size and consisted of vughs with some complex packing voids (Figure 1). The coarse components in the bioturbated samples were predominately quartz grains which ranged in size from fine to medium sand sized according to the Wentworth scale. The finer component was speckled and brown to dark brown in colour. Voids were macropore in size and consisted predominately of vughs with a few complex packing voids (Figure 2). Bitumen in the argillaceous sands and bioturbated samples were observed in both the coarse and fine components.
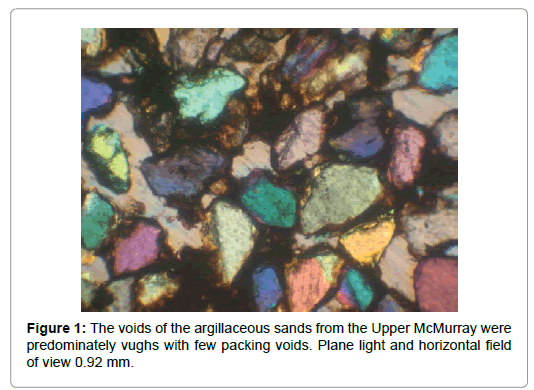
Figure 1: The voids of the argillaceous sands from the Upper McMurray were predominately vughs with few packing voids. Plane light and horizontal field of view 0.92 mm.
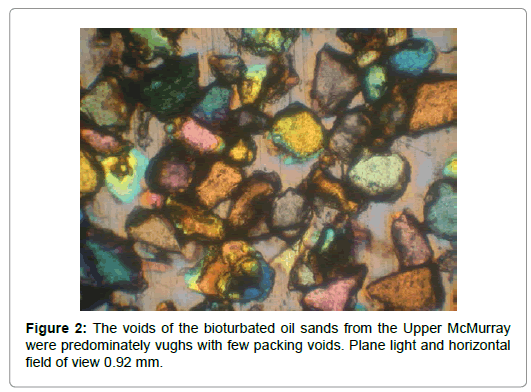
Figure 2: The voids of the bioturbated oil sands from the Upper McMurray were predominately vughs with few packing voids. Plane light and horizontal field of view 0.92 mm.
The image analysis system used in this quantitative study consisted of a digital camera mounted on the petrographic microscope for image acquisition, and a computer with the IMAGE J image analysis software package [8]. The image analysis software was calibrated using a standard calibrating slide prior to digitization of the thin sections. Examining thin sections prepared under the petrographic microscope requires systematically observing reservoir constituents so that features can be digitized and processed using the image analysis software. Thin sections were initially observed and described. Components were then measured at a magnification of 10x. The modified X-pattern was adopted for digitizing ROI in thin sections and was used for image analysis (Figure 3).
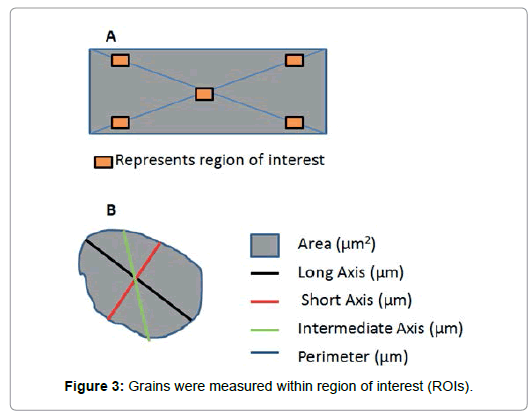
Figure 3: Grains were measured within region of interest (ROIs).
The digitized regions of interest or ROI are processed by first converting the coloured thin section image to gray scale image (black and white image). Regions of interest of any size, along with the number of sampling points on each thin section, is dependent on the size of the constituent as each ROI represents one data point [9]. The pixels in the gray scale image have value ranges from 0–255, where an image value of 0 represents black and an image value of 255 represents white. The gray scale image is then thresholded to enhance the image contrast, allowing separation between the solids (coarse and fine components) and pores. The binary image represents the pore spaces as white and the solids (coarse and fine components) as black spaces (Figure 4). The area for each ROI is 1135753.2 μm2 for the image analysis system. This is based on conversion from a photographic unit (pixel) of an image resolution of 2.76 pixel/μm, and obtained from calibrating the image analysis system. This is used to calculate the area occupied by the solid in the binary image and generated for each ROI which is represented by the black colour in the binary image (Figure 4).
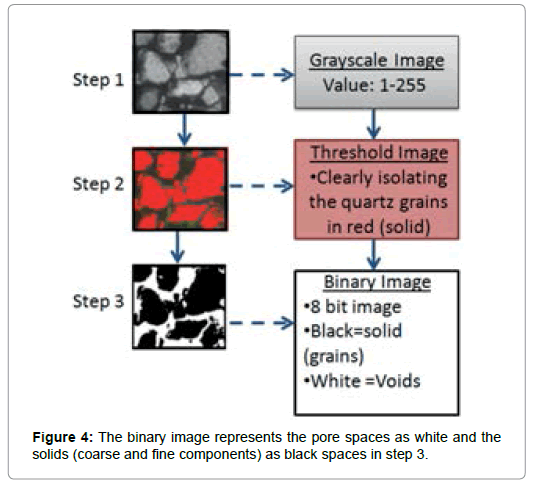
Figure 4: The binary image represents the pore spaces as white and the solids (coarse and fine components) as black spaces in step 3.
Direct observation of the reservoir constituents and direct measurements of reservoir properties are obtained. Reservoir properties are either directly observed or calculated. The calculations used to obtain reservoir properties in thin section are presented as follows. Please refer to Appendix 1 for equation nomenclature.
Porosity of a rock is readily determined as the fraction of the volume of pores to the volume of rock. It follows that the total porosity for a typical thin section image can be calculated using the conventional porosity formula:
 (1)
(1)
The Delesse principle, in which the volumetric density is derived from the areal measurement of random sections in order to quantitatively represent its composition, can be applied [10]. This principle assumes that the spatial pore distribution is isotropic and statistically homogenous.
Image based porosity can be calculated using the equation below:
 (2)
(2)
The oil sand composition is in two phases; voids or pores and constituents (coarse and fine components). Therefore, the area occupied by voids in the thin section image can be determined:
 (3)
(3)
 (4)
(4)
Empirical relationships can be used to estimate permeability by using characteristics of reservoir constituents and oil sands fabric properties included in the Van Baaren model which was adopted for estimating permeability in this study [11]. The Van Baaren model was selected because it uses grain size distribution which can be obtained in thin section and is a rapid method to ascertain permeability estimates. Permeability was calculated using the Van Baaren equation below:
 (5)
(5)
where:
D=grain diameter in μm, derived from thin section analysis=Dd
φ =porosity
m = Archie cementation factor
c=a constant derived from sorting obtained from thin section analysis.
Porosity (φ ) was calculated from image analysis with an average value of porosity from the selected ROI used as the input value for φ in the Van Baaren model. Dd was estimated from digitization of solids or constituents (coarse and fine component) from regions of interest (ROI). The Archie cementation factor m, was set as 1.3 since oil sands are generally unconsolidated with coarse components or grains servings as the reservoir framework [12-14]. Constant c is a sorting value of 0.77 and was adopted for this study as determined from Van Baaren [11].
For each ROI digitized, the coarse component grain perimeters were logged using the image analysis software, with the long, short and medial axis for each grain being measured. A true representation of the sieve diameter used for classification of grain size distribution can then be calculated from a third grain morphometry parameter known as the intermediate axis (I ) using the equation below.
 (6)
(6)
Komar and Cui [15] applied a correction factor of 1.32 to the intermediate axis in order to approximate the diameter of the sieve.
The size of each digitized grain is then calculated as:
 (7)
(7)
The average grain size representing the dominant grain size was then determined by:
 (8)
(8)
Using an image analysis system, porosity values were calculated and results ranged from 34.6%–40.2% with an average porosity value of 38% for the argillaceous sand samples and 46% for the bioturbated samples. Grain size for argillaceous sand ranged from a minimum of 83.53 μm to a maximum of 368.60 μm, with a mean grain size of 180.44 μm. The grain size for bioturbated samples ranged from a minimum of 79.21 μm to a maximum of 276.28 μm with a mean of 151.81 μm. The grain size distribution curves were created excluding silt and clay <63 μm (Figure 5). Permeability in the argillaceous sand samples was estimated at 7044 mD compared to a value of 12739.45 mD in the bioturbated sections.
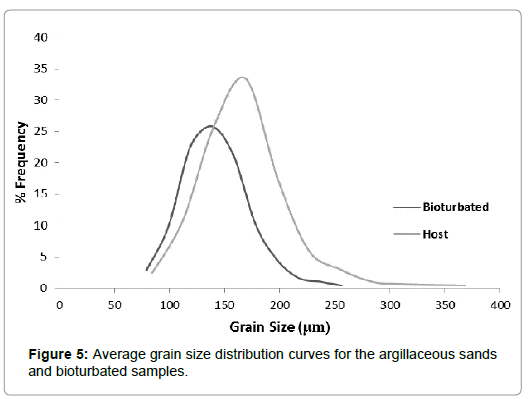
Figure 5: Average grain size distribution curves for the argillaceous sands and bioturbated samples.
While the result for the argillaceous sand falls within reasonable range, the values for the bioturbated samples did not. Permeability estimation based on the application of empirical relationships, such as the Van Baaren model employed in this study, predict permeability from porosity and other measurable parameters such as grain size, grain sorting and the degree of consolidation. Errors in determining permeability can arise from inaccurate estimations in the measured or assumed values in the calculation.
This study employs a significant number of binary images in determining porosity in order to obtain a representative value. Combination of a qualitative or descriptive analysis, where representative elementary area (REA) can be obtained followed by a quantitative analysis, may provide for more reliable results [16]. The reliability of the results can be directly attributed to the quality of the images. Ruzyla [10] concluded that judgement on the magnifications used in an image analysis system should be based on the amount within the field of view and sufficient magnification to characterize the image.
Sand reservoirs, including tight gas, heavy oil and bitumen rich sands, differ from traditional crystalline rock reservoirs and must be treated accordingly. Oil sand reservoirs, such as those located in Canada and Venezuela, should be analyzed according to the nature of the material, although methods that work in traditional rock reservoirs can be augmented to work within these reservoirs.
The findings of the quantitative thin section image analysis were consistent with published results from conventional analyses on the same material. Petrographic image analysis, combined with image analysis, is a suitable method in determining reservoir properties in oil sands, although findings should be integrated within the full data package for the reservoir. Advancement in technology makes thin section analysis of the fabric more cost effective for rapid analysis when compared to conventional core analysis.
Appendix 1: Equation nomenclature
φ =measure of the degree of sorting
K=Permeability (mD)
μ=Viscosity μm=micron
Vv=Volume of void
VT=Total volume
Av=Area occupied by void (μm2)
AT =Total Area (μm2)
D=Grain diameter (μm)
φ =Porosity (fraction)
m=Archie cementation factor
c=Consolidation constant
I=Intermediate axis morphometry parameter
ROI=Region of interest.